Ruth, NV Map & Demographics
Ruth Map
Ruth Overview
$30,227
PER CAPITA INCOME
$91,220
AVG FAMILY INCOME
0.38
INEQUALITY / GINI INDEX
189
TOTAL POPULATION
140
MALE POPULATION
49
FEMALE POPULATION
285.71
MALES / 100 FEMALES
35.00
FEMALES / 100 MALES
67.4
MEDIAN AGE
2.4
AVG FAMILY SIZE
1.6
AVG HOUSEHOLD SIZE
83
LABOR FORCE [ PEOPLE ]
43.9%
PERCENT IN LABOR FORCE
27.7%
UNEMPLOYMENT RATE
Ruth Zip Codes
Ruth Area Codes
Income in Ruth
Income Overview in Ruth
| Characteristic | Number | Measure |
| Per Capita Income | 189 | $30,227 |
| Median Family Income | 50 | $91,220 |
| Mean Family Income | 50 | $89,432 |
| Median Household Income | 117 | $0 |
| Mean Household Income | 117 | $57,023 |
| Income Deficit | 50 | $0 |
| Wage / Income Gap (%) | 189 | 0.00% |
| Wage / Income Gap ($) | 189 | 100.00¢ per $1 |
| Gini / Inequality Index | 189 | 0.38 |
Earnings by Sex in Ruth
| Sex | Number | Average Earnings |
| Male | 44 (73.3%) | $0 |
| Female | 16 (26.7%) | $0 |
| Total | 60 (100.0%) | $0 |
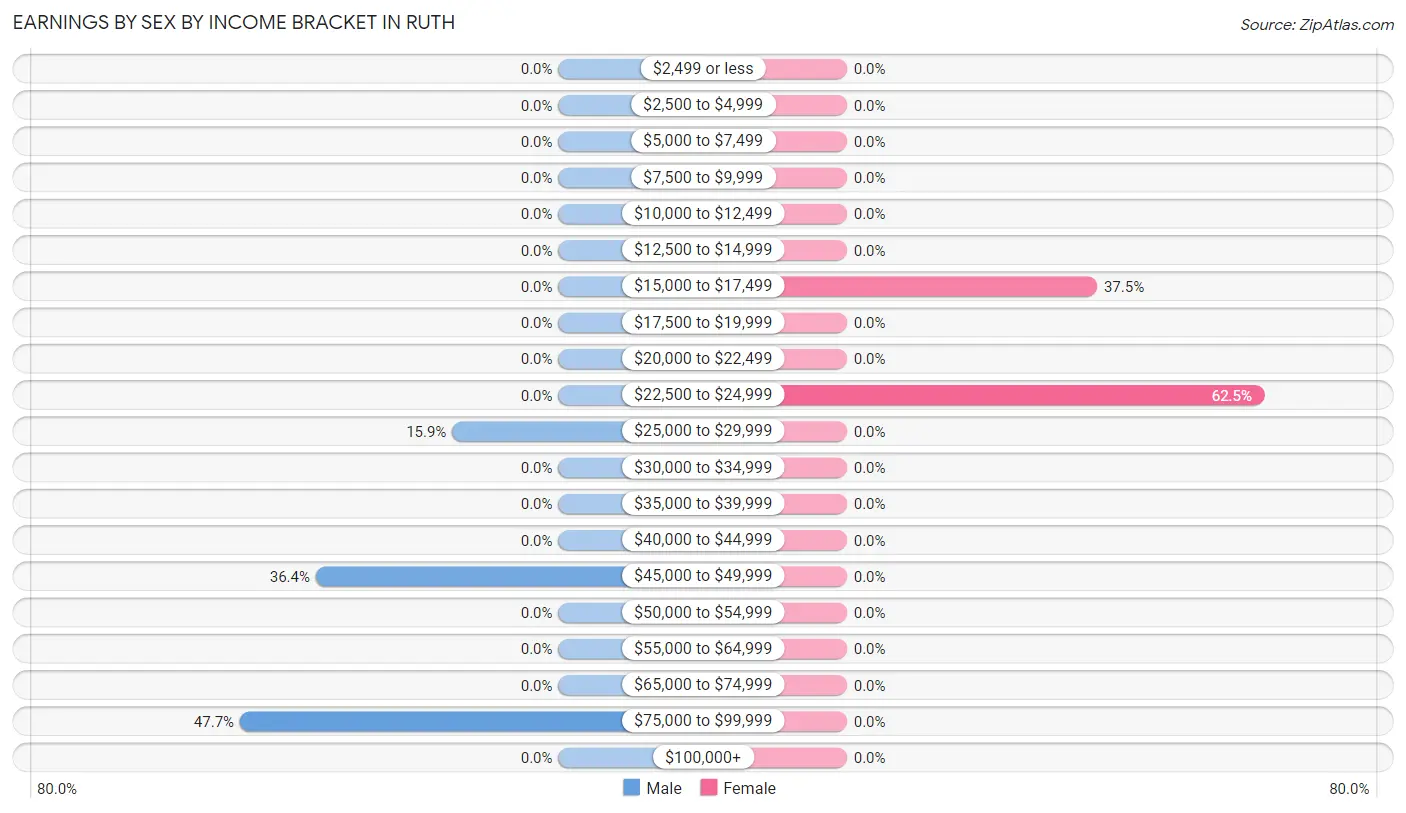
Earnings by Sex by Income Bracket in Ruth
The most common earnings brackets in Ruth are $75,000 to $99,999 for men (21 | 47.7%) and $22,500 to $24,999 for women (10 | 62.5%).
| Income | Male | Female |
| $2,499 or less | 0 (0.0%) | 0 (0.0%) |
| $2,500 to $4,999 | 0 (0.0%) | 0 (0.0%) |
| $5,000 to $7,499 | 0 (0.0%) | 0 (0.0%) |
| $7,500 to $9,999 | 0 (0.0%) | 0 (0.0%) |
| $10,000 to $12,499 | 0 (0.0%) | 0 (0.0%) |
| $12,500 to $14,999 | 0 (0.0%) | 0 (0.0%) |
| $15,000 to $17,499 | 0 (0.0%) | 6 (37.5%) |
| $17,500 to $19,999 | 0 (0.0%) | 0 (0.0%) |
| $20,000 to $22,499 | 0 (0.0%) | 0 (0.0%) |
| $22,500 to $24,999 | 0 (0.0%) | 10 (62.5%) |
| $25,000 to $29,999 | 7 (15.9%) | 0 (0.0%) |
| $30,000 to $34,999 | 0 (0.0%) | 0 (0.0%) |
| $35,000 to $39,999 | 0 (0.0%) | 0 (0.0%) |
| $40,000 to $44,999 | 0 (0.0%) | 0 (0.0%) |
| $45,000 to $49,999 | 16 (36.4%) | 0 (0.0%) |
| $50,000 to $54,999 | 0 (0.0%) | 0 (0.0%) |
| $55,000 to $64,999 | 0 (0.0%) | 0 (0.0%) |
| $65,000 to $74,999 | 0 (0.0%) | 0 (0.0%) |
| $75,000 to $99,999 | 21 (47.7%) | 0 (0.0%) |
| $100,000+ | 0 (0.0%) | 0 (0.0%) |
| Total | 44 (100.0%) | 16 (100.0%) |
Earnings by Sex by Educational Attainment in Ruth
| Educational Attainment | Male Income | Female Income |
| Less than High School | - | - |
| High School Diploma | - | - |
| College or Associate's Degree | - | - |
| Bachelor's Degree | - | - |
| Graduate Degree | - | - |
| Total | - | - |
Family Income in Ruth
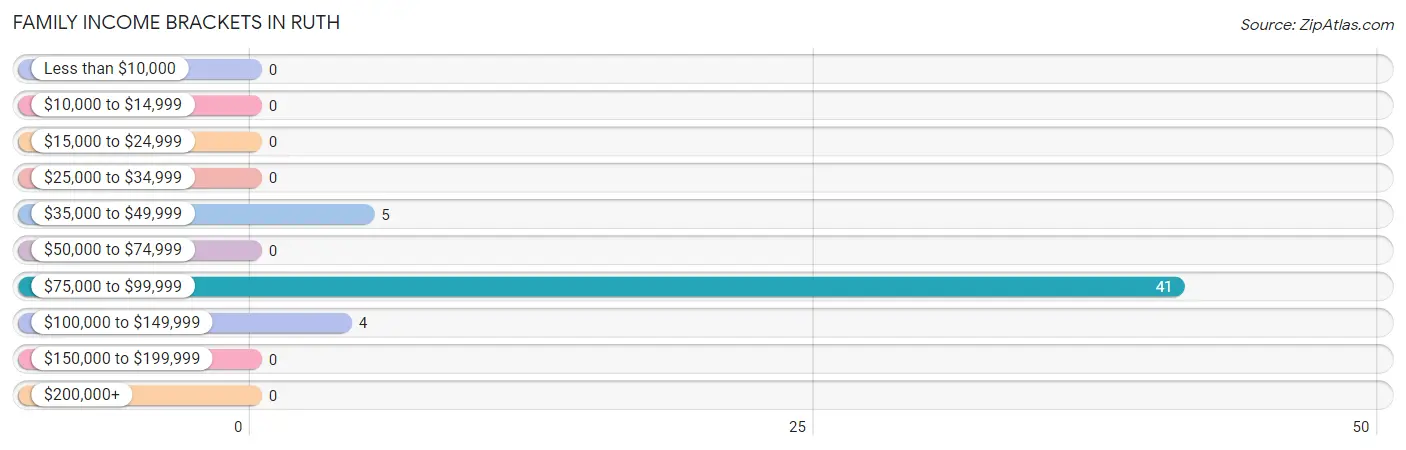
Family Income Brackets in Ruth
According to the Ruth family income data, there are 41 families falling into the $75,000 to $99,999 income range, which is the most common income bracket and makes up 82.0% of all families.
| Income Bracket | # Families | % Families |
| Less than $10,000 | 0 | 0.0% |
| $10,000 to $14,999 | 0 | 0.0% |
| $15,000 to $24,999 | 0 | 0.0% |
| $25,000 to $34,999 | 0 | 0.0% |
| $35,000 to $49,999 | 5 | 10.0% |
| $50,000 to $74,999 | 0 | 0.0% |
| $75,000 to $99,999 | 41 | 82.0% |
| $100,000 to $149,999 | 4 | 8.0% |
| $150,000 to $199,999 | 0 | 0.0% |
| $200,000+ | 0 | 0.0% |
Family Income by Famaliy Size in Ruth
| Income Bracket | # Families | Median Income |
| 2-Person Families | 5 (10.0%) | $0 |
| 3-Person Families | 45 (90.0%) | $0 |
| 4-Person Families | 0 (0.0%) | $0 |
| 5-Person Families | 0 (0.0%) | $0 |
| 6-Person Families | 0 (0.0%) | $0 |
| 7+ Person Families | 0 (0.0%) | $0 |
| Total | 50 (100.0%) | $91,220 |
Family Income by Number of Earners in Ruth
| Number of Earners | # Families | Median Income |
| No Earners | 0 (0.0%) | $0 |
| 1 Earner | 46 (92.0%) | $0 |
| 2 Earners | 0 (0.0%) | $0 |
| 3+ Earners | 4 (8.0%) | $0 |
| Total | 50 (100.0%) | $91,220 |
Household Income in Ruth
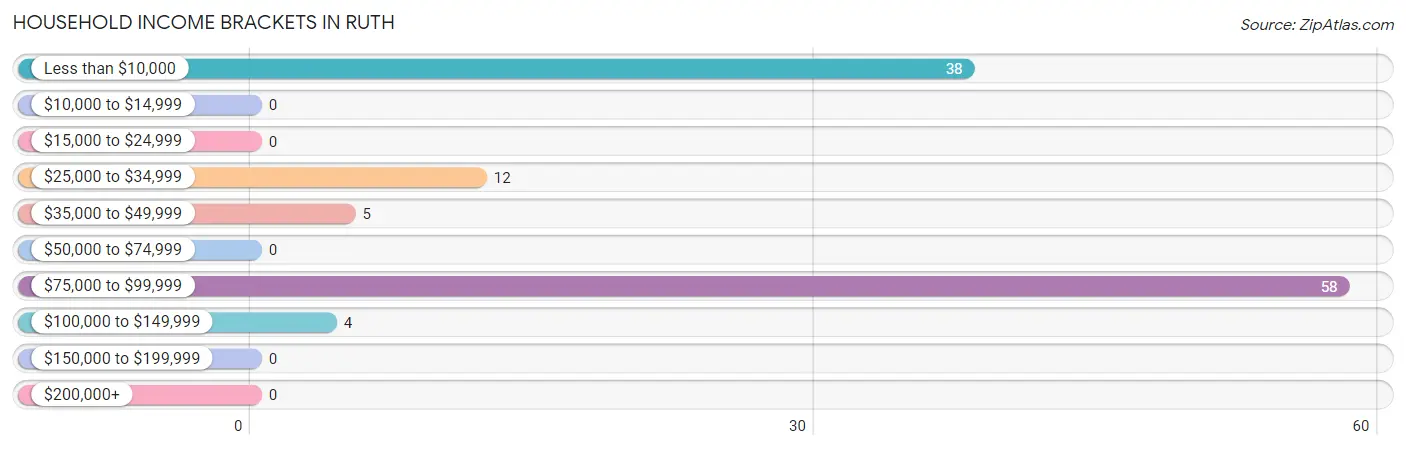
Household Income Brackets in Ruth
With 58 households falling in the category, the $75,000 to $99,999 income range is the most frequent in Ruth, accounting for 49.6% of all households.
| Income Bracket | # Households | % Households |
| Less than $10,000 | 38 | 32.5% |
| $10,000 to $14,999 | 0 | 0.0% |
| $15,000 to $24,999 | 0 | 0.0% |
| $25,000 to $34,999 | 12 | 10.3% |
| $35,000 to $49,999 | 5 | 4.3% |
| $50,000 to $74,999 | 0 | 0.0% |
| $75,000 to $99,999 | 58 | 49.6% |
| $100,000 to $149,999 | 4 | 3.4% |
| $150,000 to $199,999 | 0 | 0.0% |
| $200,000+ | 0 | 0.0% |
Household Income by Householder Age in Ruth
| Income Bracket | # Households | Median Income |
| 15 to 24 Years | 0 (0.0%) | $0 |
| 25 to 44 Years | 40 (34.2%) | $0 |
| 45 to 64 Years | 4 (3.4%) | $0 |
| 65+ Years | 73 (62.4%) | $0 |
| Total | 117 (100.0%) | $0 |
Poverty in Ruth
Income Below Poverty by Sex and Age in Ruth
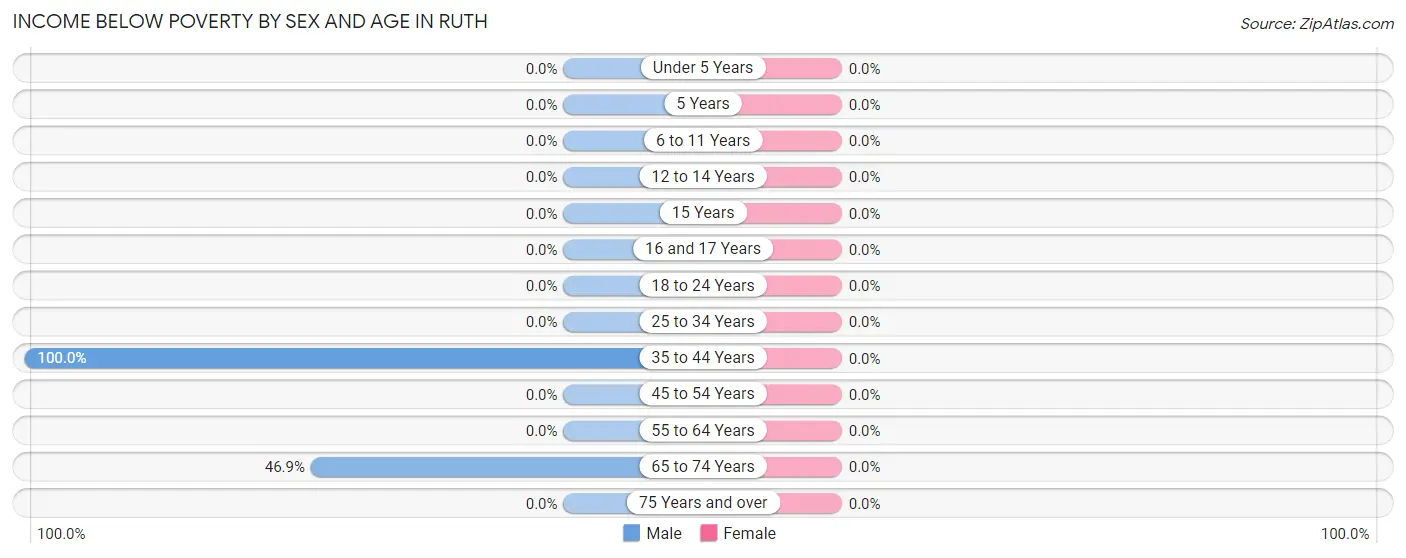
| Age Bracket | Male | Female |
| Under 5 Years | 0 (0.0%) | 0 (0.0%) |
| 5 Years | 0 (0.0%) | 0 (0.0%) |
| 6 to 11 Years | 0 (0.0%) | 0 (0.0%) |
| 12 to 14 Years | 0 (0.0%) | 0 (0.0%) |
| 15 Years | 0 (0.0%) | 0 (0.0%) |
| 16 and 17 Years | 0 (0.0%) | 0 (0.0%) |
| 18 to 24 Years | 0 (0.0%) | 0 (0.0%) |
| 25 to 34 Years | 0 (0.0%) | 0 (0.0%) |
| 35 to 44 Years | 23 (100.0%) | 0 (0.0%) |
| 45 to 54 Years | 0 (0.0%) | 0 (0.0%) |
| 55 to 64 Years | 0 (0.0%) | 0 (0.0%) |
| 65 to 74 Years | 15 (46.9%) | 0 (0.0%) |
| 75 Years and over | 0 (0.0%) | 0 (0.0%) |
| Total | 38 (27.1%) | 0 (0.0%) |
Income Above Poverty by Sex and Age in Ruth
According to the poverty statistics in Ruth, males aged 25 to 34 years and females aged 45 to 54 years are the age groups that are most secure financially, with 100.0% of males and 100.0% of females in these age groups living above the poverty line.
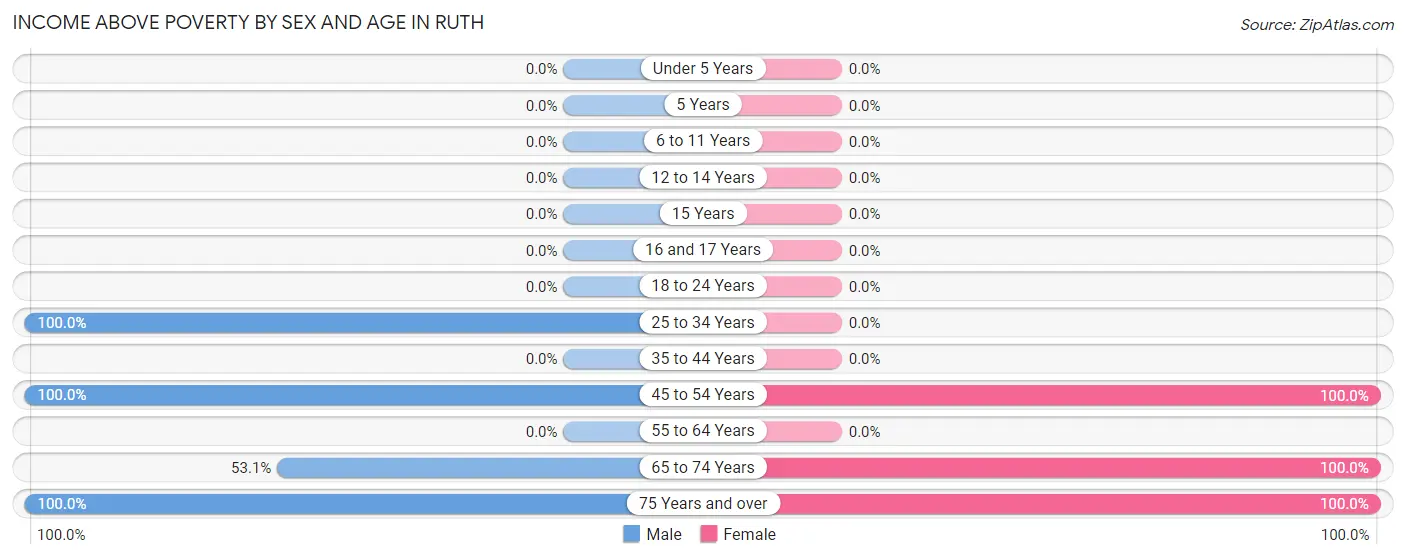
| Age Bracket | Male | Female |
| Under 5 Years | 0 (0.0%) | 0 (0.0%) |
| 5 Years | 0 (0.0%) | 0 (0.0%) |
| 6 to 11 Years | 0 (0.0%) | 0 (0.0%) |
| 12 to 14 Years | 0 (0.0%) | 0 (0.0%) |
| 15 Years | 0 (0.0%) | 0 (0.0%) |
| 16 and 17 Years | 0 (0.0%) | 0 (0.0%) |
| 18 to 24 Years | 0 (0.0%) | 0 (0.0%) |
| 25 to 34 Years | 24 (100.0%) | 0 (0.0%) |
| 35 to 44 Years | 0 (0.0%) | 0 (0.0%) |
| 45 to 54 Years | 20 (100.0%) | 6 (100.0%) |
| 55 to 64 Years | 0 (0.0%) | 0 (0.0%) |
| 65 to 74 Years | 17 (53.1%) | 10 (100.0%) |
| 75 Years and over | 41 (100.0%) | 33 (100.0%) |
| Total | 102 (72.9%) | 49 (100.0%) |
Income Below Poverty Among Married-Couple Families in Ruth
| Children | Above Poverty | Below Poverty |
| No Children | 50 (100.0%) | 0 (0.0%) |
| 1 or 2 Children | 0 (0.0%) | 0 (0.0%) |
| 3 or 4 Children | 0 (0.0%) | 0 (0.0%) |
| 5 or more Children | 0 (0.0%) | 0 (0.0%) |
| Total | 50 (100.0%) | 0 (0.0%) |
Income Below Poverty Among Single-Parent Households in Ruth
| Children | Single Father | Single Mother |
| No Children | 0 (0.0%) | 0 (0.0%) |
| 1 or 2 Children | 0 (0.0%) | 0 (0.0%) |
| 3 or 4 Children | 0 (0.0%) | 0 (0.0%) |
| 5 or more Children | 0 (0.0%) | 0 (0.0%) |
| Total | 0 (0.0%) | 0 (0.0%) |
Income Below Poverty Among Married-Couple vs Single-Parent Households in Ruth
| Children | Married-Couple Families | Single-Parent Households |
| No Children | 0 (0.0%) | 0 (0.0%) |
| 1 or 2 Children | 0 (0.0%) | 0 (0.0%) |
| 3 or 4 Children | 0 (0.0%) | 0 (0.0%) |
| 5 or more Children | 0 (0.0%) | 0 (0.0%) |
| Total | 0 (0.0%) | 0 (0.0%) |
Race in Ruth
The most populous races in Ruth are White / Caucasian (184 | 97.4%), and Two or more Races (5 | 2.6%).
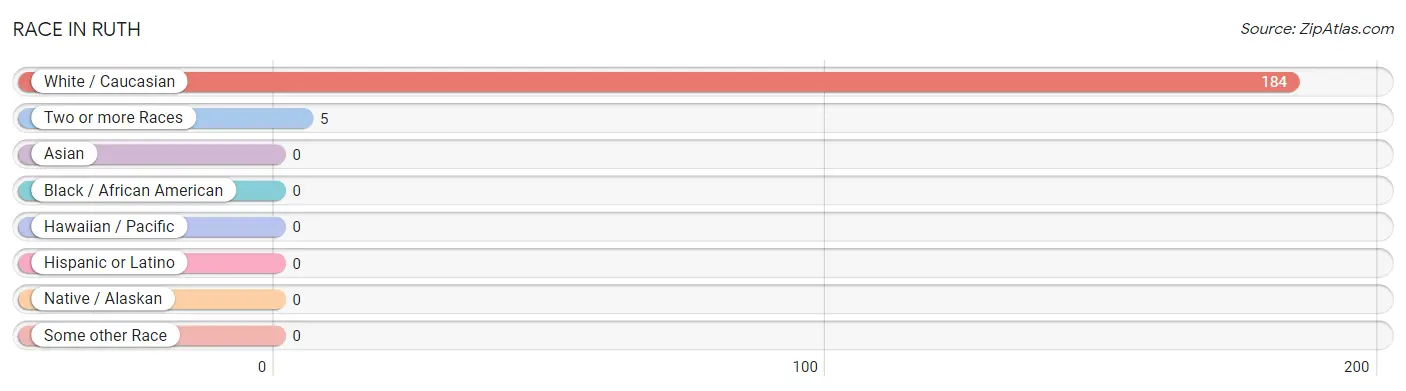
| Race | # Population | % Population |
| Asian | 0 | 0.0% |
| Black / African American | 0 | 0.0% |
| Hawaiian / Pacific | 0 | 0.0% |
| Hispanic or Latino | 0 | 0.0% |
| Native / Alaskan | 0 | 0.0% |
| White / Caucasian | 184 | 97.4% |
| Two or more Races | 5 | 2.6% |
| Some other Race | 0 | 0.0% |
| Total | 189 | 100.0% |
Ancestry in Ruth
The most populous ancestries reported in Ruth are English (144 | 76.2%), German (73 | 38.6%), Scottish (48 | 25.4%), Dutch (12 | 6.4%), and Polish (10 | 5.3%), together accounting for 151.8% of all Ruth residents.
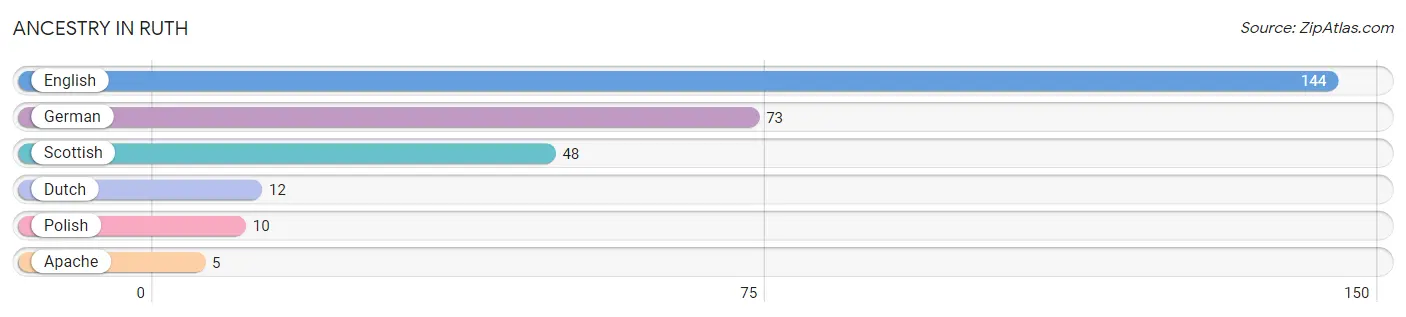
| Ancestry | # Population | % Population |
| Apache | 5 | 2.6% |
| Dutch | 12 | 6.4% |
| English | 144 | 76.2% |
| German | 73 | 38.6% |
| Polish | 10 | 5.3% |
| Scottish | 48 | 25.4% | View All 6 Rows |
Immigrants in Ruth

| Immigration Origin | # Population | % Population | View All 0 Rows |
Sex and Age in Ruth
Sex and Age in Ruth
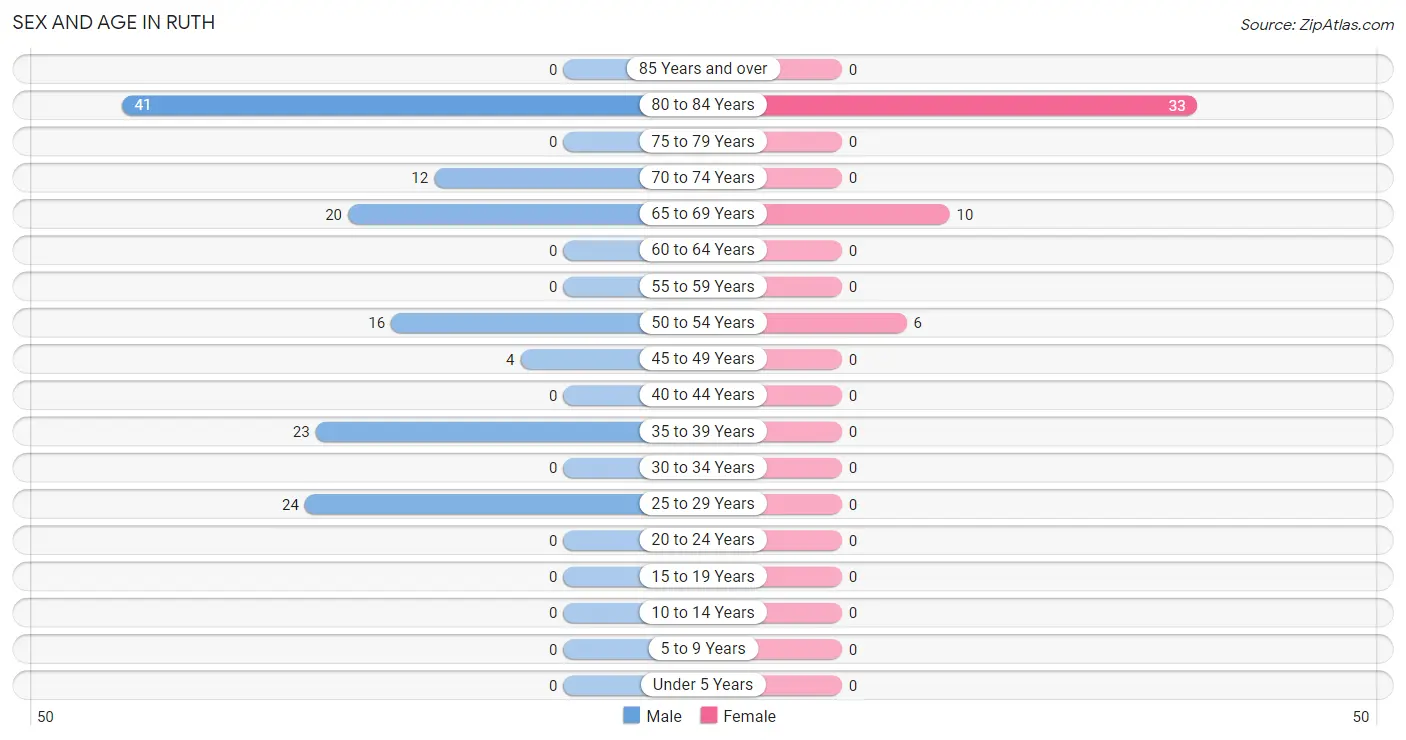
The most populous age groups in Ruth are 80 to 84 Years (41 | 29.3%) for men and 80 to 84 Years (33 | 67.3%) for women.
| Age Bracket | Male | Female |
| Under 5 Years | 0 (0.0%) | 0 (0.0%) |
| 5 to 9 Years | 0 (0.0%) | 0 (0.0%) |
| 10 to 14 Years | 0 (0.0%) | 0 (0.0%) |
| 15 to 19 Years | 0 (0.0%) | 0 (0.0%) |
| 20 to 24 Years | 0 (0.0%) | 0 (0.0%) |
| 25 to 29 Years | 24 (17.1%) | 0 (0.0%) |
| 30 to 34 Years | 0 (0.0%) | 0 (0.0%) |
| 35 to 39 Years | 23 (16.4%) | 0 (0.0%) |
| 40 to 44 Years | 0 (0.0%) | 0 (0.0%) |
| 45 to 49 Years | 4 (2.9%) | 0 (0.0%) |
| 50 to 54 Years | 16 (11.4%) | 6 (12.2%) |
| 55 to 59 Years | 0 (0.0%) | 0 (0.0%) |
| 60 to 64 Years | 0 (0.0%) | 0 (0.0%) |
| 65 to 69 Years | 20 (14.3%) | 10 (20.4%) |
| 70 to 74 Years | 12 (8.6%) | 0 (0.0%) |
| 75 to 79 Years | 0 (0.0%) | 0 (0.0%) |
| 80 to 84 Years | 41 (29.3%) | 33 (67.3%) |
| 85 Years and over | 0 (0.0%) | 0 (0.0%) |
| Total | 140 (100.0%) | 49 (100.0%) |
Families and Households in Ruth
Median Family Size in Ruth
| Family Type | # Families | Family Size |
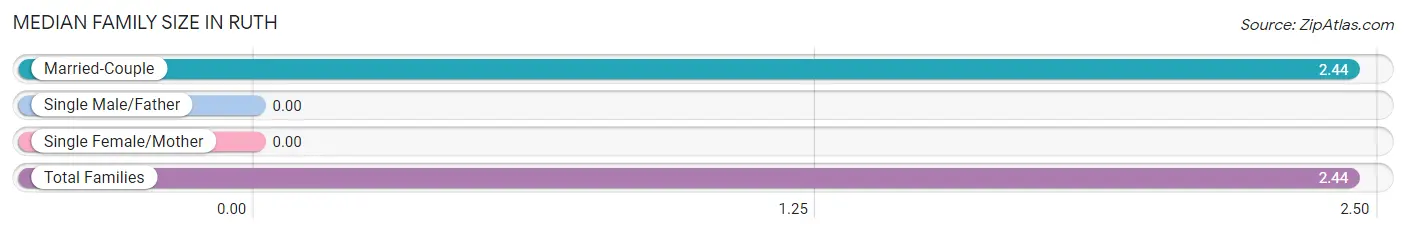
| Married-Couple | 50 (100.0%) | 2.44 |
| Single Male/Father | 0 (0.0%) | - |
| Single Female/Mother | 0 (0.0%) | - |
| Total Families | 50 (100.0%) | 2.44 |
Median Household Size in Ruth
| Household Type | # Households | Household Size |
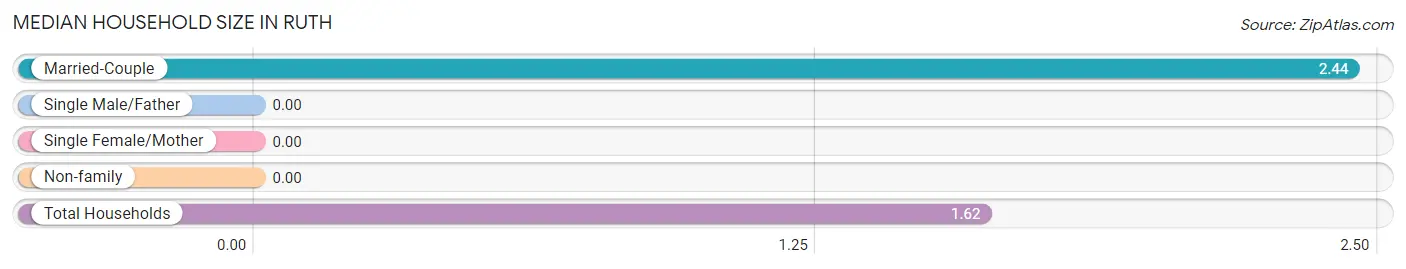
| Married-Couple | 50 (42.7%) | 2.44 |
| Single Male/Father | 0 (0.0%) | - |
| Single Female/Mother | 0 (0.0%) | - |
| Non-family | 67 (57.3%) | - |
| Total Households | 117 (100.0%) | 1.62 |
Household Size by Marriage Status in Ruth
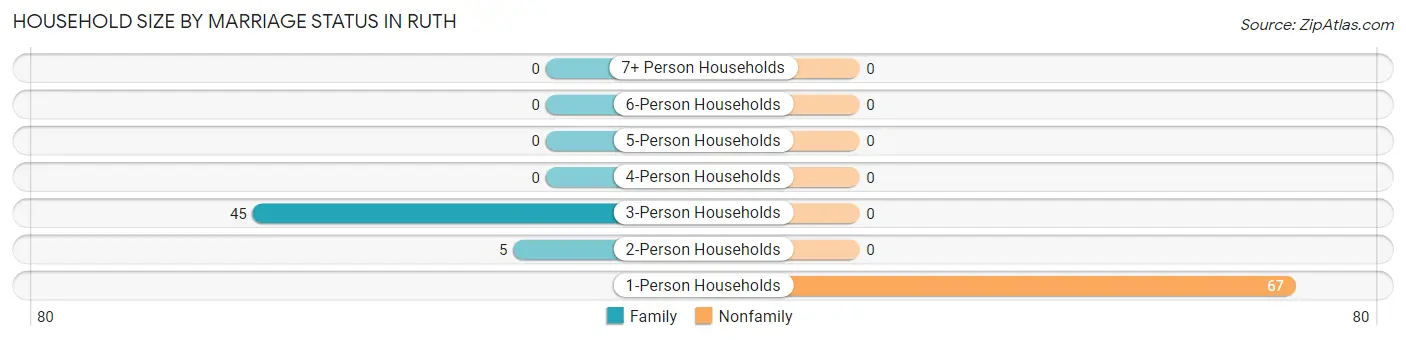
Out of a total of 117 households in Ruth, 50 (42.7%) are family households, while 67 (57.3%) are nonfamily households. The most numerous type of family households are 3-person households, comprising 45, and the most common type of nonfamily households are 1-person households, comprising 67.
| Household Size | Family Households | Nonfamily Households |
| 1-Person Households | - | 67 (57.3%) |
| 2-Person Households | 5 (4.3%) | 0 (0.0%) |
| 3-Person Households | 45 (38.5%) | 0 (0.0%) |
| 4-Person Households | 0 (0.0%) | 0 (0.0%) |
| 5-Person Households | 0 (0.0%) | 0 (0.0%) |
| 6-Person Households | 0 (0.0%) | 0 (0.0%) |
| 7+ Person Households | 0 (0.0%) | 0 (0.0%) |
| Total | 50 (42.7%) | 67 (57.3%) |
Female Fertility in Ruth
Fertility by Age in Ruth
| Age Bracket | Women with Births | Births / 1,000 Women |
| 15 to 19 years | 0 (0.0%) | 0.0 |
| 20 to 34 years | 0 (0.0%) | 0.0 |
| 35 to 50 years | 0 (0.0%) | 0.0 |
| Total | 0 (0.0%) | 0.0 |
Fertility by Age by Marriage Status in Ruth
| Age Bracket | Married | Unmarried |
| 15 to 19 years | 0 (0.0%) | 0 (0.0%) |
| 20 to 34 years | 0 (0.0%) | 0 (0.0%) |
| 35 to 50 years | 0 (0.0%) | 0 (0.0%) |
| Total | 0 (0.0%) | 0 (0.0%) |
Fertility by Education in Ruth
| Educational Attainment | Women with Births | Births / 1,000 Women |
| Less than High School | 0 (0.0%) | 0.0 |
| High School Diploma | 0 (0.0%) | 0.0 |
| College or Associate's Degree | 0 (0.0%) | 0.0 |
| Bachelor's Degree | 0 (0.0%) | 0.0 |
| Graduate Degree | 0 (0.0%) | 0.0 |
| Total | 0 (0.0%) | 0.0 |
Fertility by Education by Marriage Status in Ruth
| Educational Attainment | Married | Unmarried |
| Less than High School | 0 (0.0%) | 0 (0.0%) |
| High School Diploma | 0 (0.0%) | 0 (0.0%) |
| College or Associate's Degree | 0 (0.0%) | 0 (0.0%) |
| Bachelor's Degree | 0 (0.0%) | 0 (0.0%) |
| Graduate Degree | 0 (0.0%) | 0 (0.0%) |
| Total | 0 (0.0%) | 0 (0.0%) |
Employment Characteristics in Ruth
Employment by Class of Employer in Ruth
Among the 60 employed individuals in Ruth, , and private company employees (60 | 100.0%) make up the most common classes of employment.
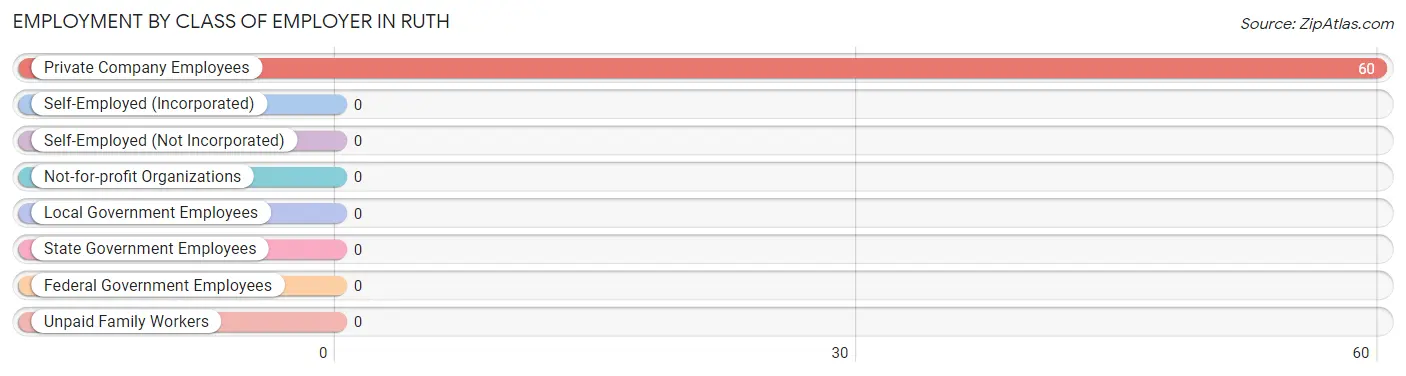
| Employer Class | # Employees | % Employees |
| Private Company Employees | 60 | 100.0% |
| Self-Employed (Incorporated) | 0 | 0.0% |
| Self-Employed (Not Incorporated) | 0 | 0.0% |
| Not-for-profit Organizations | 0 | 0.0% |
| Local Government Employees | 0 | 0.0% |
| State Government Employees | 0 | 0.0% |
| Federal Government Employees | 0 | 0.0% |
| Unpaid Family Workers | 0 | 0.0% |
| Total | 60 | 100.0% |
Employment Status by Age in Ruth
According to the labor force statistics for Ruth, out of the total population over 16 years of age (189), 43.9% or 83 individuals are in the labor force, with 27.7% or 23 of them unemployed. The age group with the highest labor force participation rate is 25 to 29 years, with 100.0% or 24 individuals in the labor force. Within the labor force, the 35 to 44 years age range has the highest percentage of unemployed individuals, with 100.0% or 23 of them being unemployed.
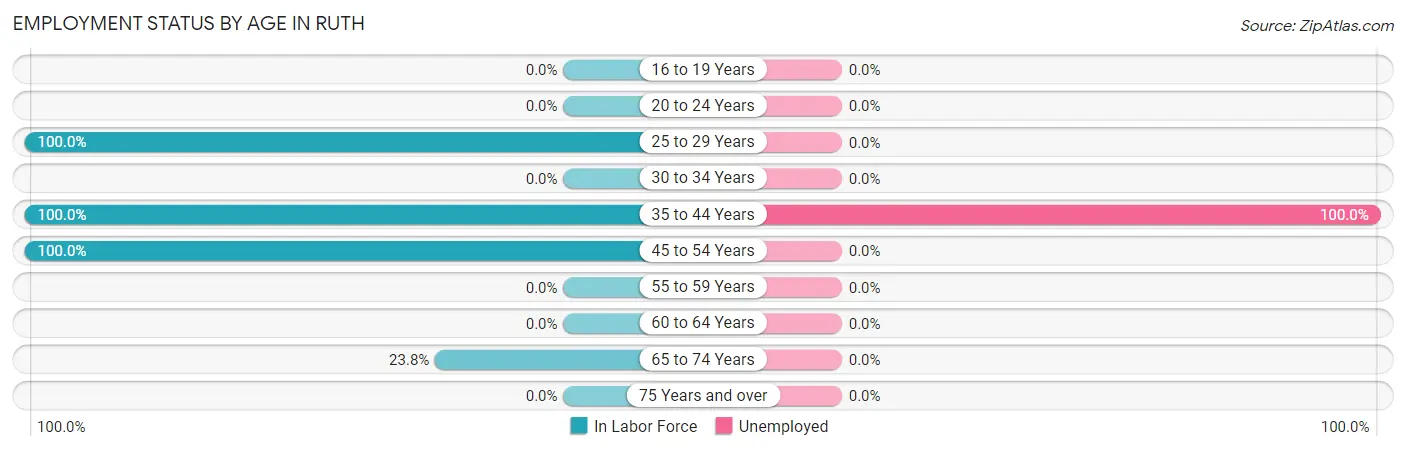
| Age Bracket | In Labor Force | Unemployed |
| 16 to 19 Years | 0 (0.0%) | 0 (0.0%) |
| 20 to 24 Years | 0 (0.0%) | 0 (0.0%) |
| 25 to 29 Years | 24 (100.0%) | 0 (0.0%) |
| 30 to 34 Years | 0 (0.0%) | 0 (0.0%) |
| 35 to 44 Years | 23 (100.0%) | 23 (100.0%) |
| 45 to 54 Years | 26 (100.0%) | 0 (0.0%) |
| 55 to 59 Years | 0 (0.0%) | 0 (0.0%) |
| 60 to 64 Years | 0 (0.0%) | 0 (0.0%) |
| 65 to 74 Years | 10 (23.8%) | 0 (0.0%) |
| 75 Years and over | 0 (0.0%) | 0 (0.0%) |
| Total | 83 (43.9%) | 23 (27.7%) |
Employment Status by Educational Attainment in Ruth
According to labor force statistics for Ruth, 100.0% of individuals (73) out of the total population between 25 and 64 years of age (73) are in the labor force, with 31.5% or 23 of them being unemployed. The group with the highest labor force participation rate are those with the educational attainment of less than high school, with 100.0% or 10 individuals in the labor force. Within the labor force, individuals with high school diploma education have the highest percentage of unemployment, with 36.5% or 23 of them being unemployed.
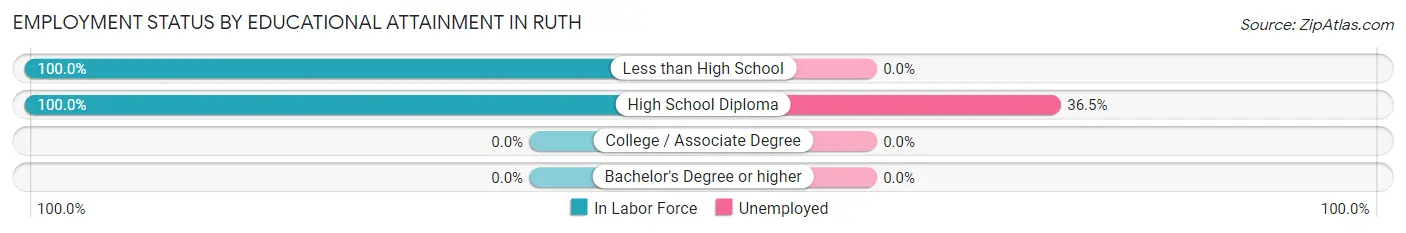
| Educational Attainment | In Labor Force | Unemployed |
| Less than High School | 10 (100.0%) | 0 (0.0%) |
| High School Diploma | 63 (100.0%) | 23 (36.5%) |
| College / Associate Degree | 0 (0.0%) | 0 (0.0%) |
| Bachelor's Degree or higher | 0 (0.0%) | 0 (0.0%) |
| Total | 73 (100.0%) | 23 (31.5%) |
Employment Occupations by Sex in Ruth
Management, Business, Science and Arts Occupations
The most common Management, Business, Science and Arts occupations in Ruth are , and Management (10 | 16.7%).
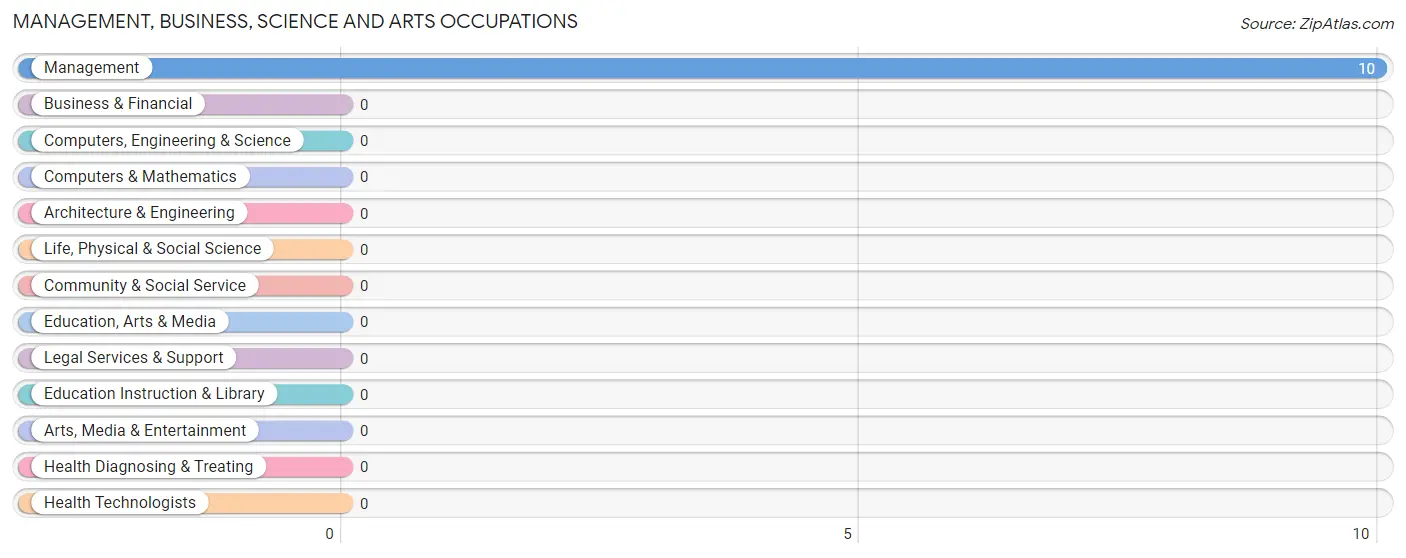
Management, Business, Science and Arts Occupations by Sex
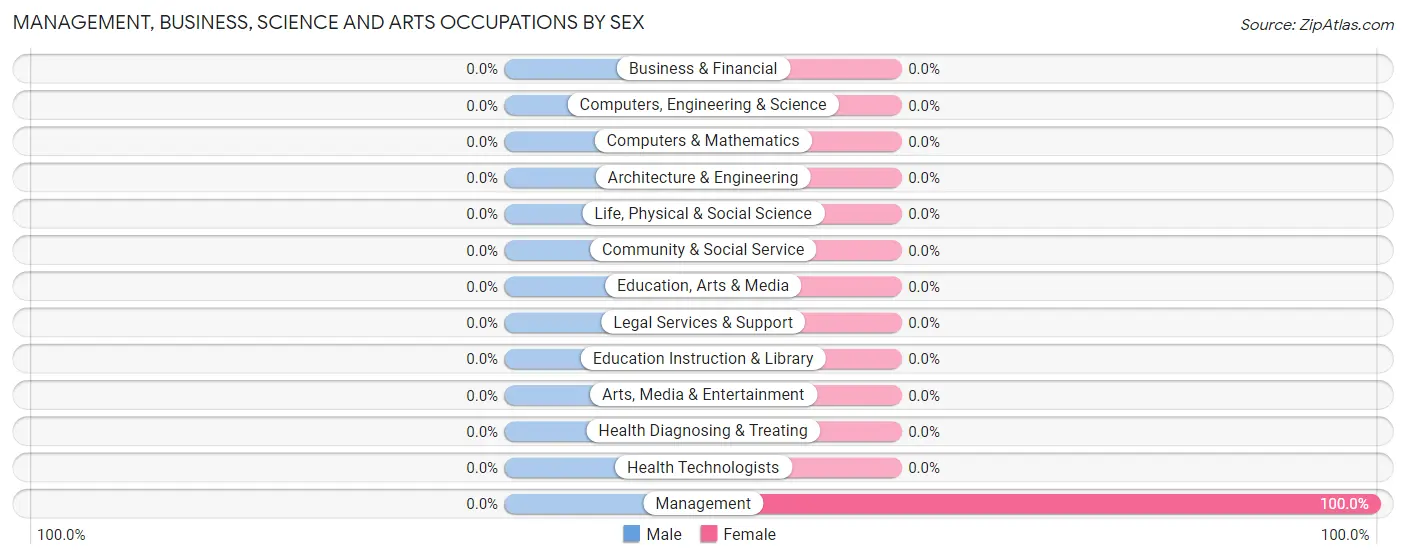
| Occupation | Male | Female |
| Management | 0 (0.0%) | 10 (100.0%) |
| Business & Financial | 0 (0.0%) | 0 (0.0%) |
| Computers, Engineering & Science | 0 (0.0%) | 0 (0.0%) |
| Computers & Mathematics | 0 (0.0%) | 0 (0.0%) |
| Architecture & Engineering | 0 (0.0%) | 0 (0.0%) |
| Life, Physical & Social Science | 0 (0.0%) | 0 (0.0%) |
| Community & Social Service | 0 (0.0%) | 0 (0.0%) |
| Education, Arts & Media | 0 (0.0%) | 0 (0.0%) |
| Legal Services & Support | 0 (0.0%) | 0 (0.0%) |
| Education Instruction & Library | 0 (0.0%) | 0 (0.0%) |
| Arts, Media & Entertainment | 0 (0.0%) | 0 (0.0%) |
| Health Diagnosing & Treating | 0 (0.0%) | 0 (0.0%) |
| Health Technologists | 0 (0.0%) | 0 (0.0%) |
| Total (Category) | 0 (0.0%) | 10 (100.0%) |
| Total (Overall) | 44 (73.3%) | 16 (26.7%) |
Services Occupations
The most common Services occupations in Ruth are , and Cleaning & Maintenance (7 | 11.7%).
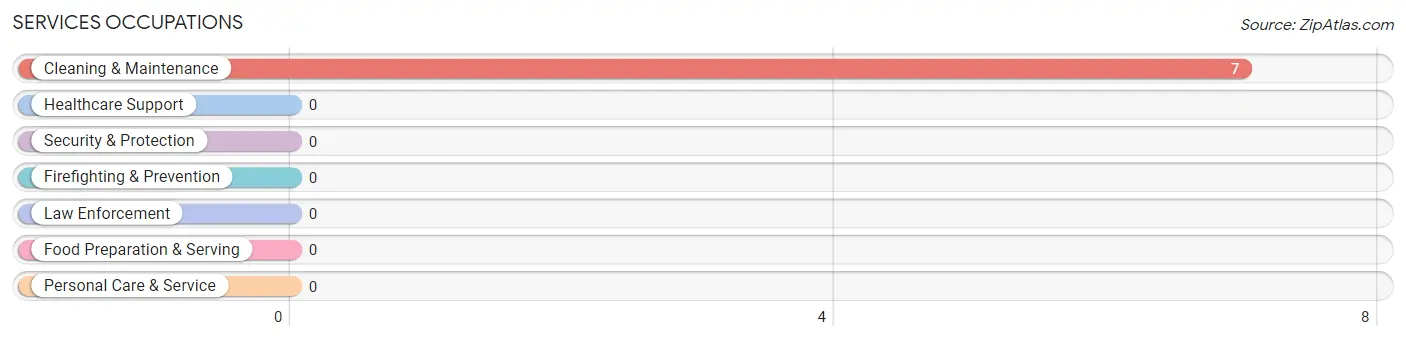
Services Occupations by Sex
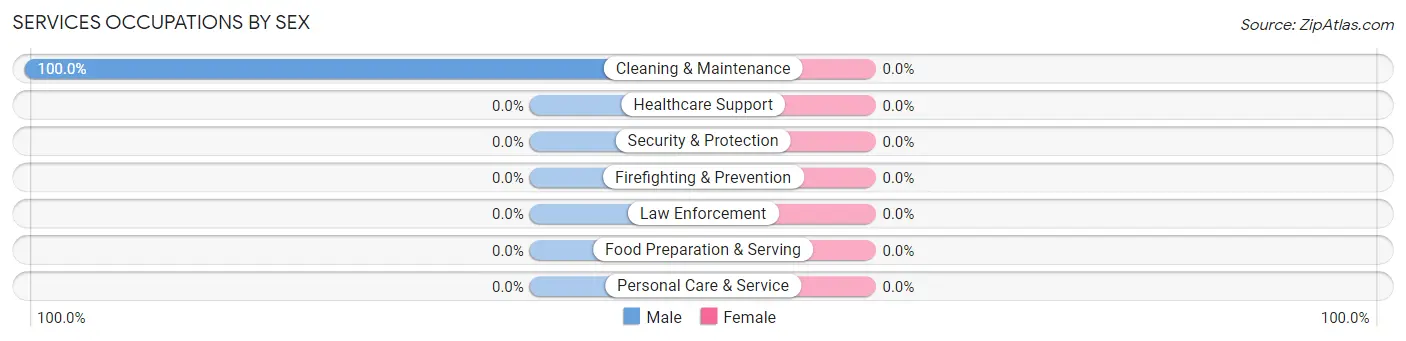
| Occupation | Male | Female |
| Healthcare Support | 0 (0.0%) | 0 (0.0%) |
| Security & Protection | 0 (0.0%) | 0 (0.0%) |
| Firefighting & Prevention | 0 (0.0%) | 0 (0.0%) |
| Law Enforcement | 0 (0.0%) | 0 (0.0%) |
| Food Preparation & Serving | 0 (0.0%) | 0 (0.0%) |
| Cleaning & Maintenance | 7 (100.0%) | 0 (0.0%) |
| Personal Care & Service | 0 (0.0%) | 0 (0.0%) |
| Total (Category) | 7 (100.0%) | 0 (0.0%) |
| Total (Overall) | 44 (73.3%) | 16 (26.7%) |
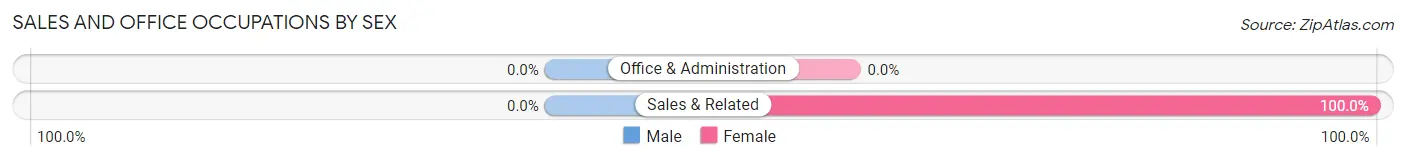
Sales and Office Occupations
The most common Sales and Office occupations in Ruth are , and Sales & Related (6 | 10.0%).
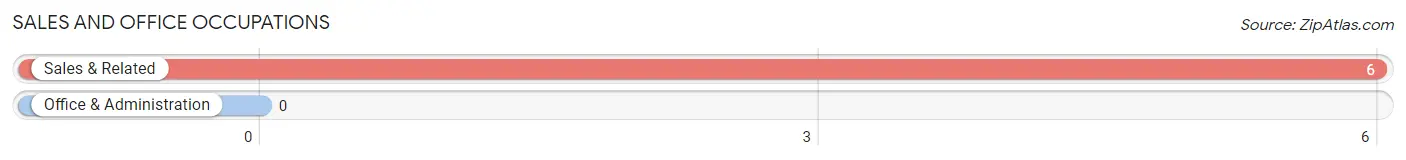
Sales and Office Occupations by Sex
| Occupation | Male | Female |
| Sales & Related | 0 (0.0%) | 6 (100.0%) |
| Office & Administration | 0 (0.0%) | 0 (0.0%) |
| Total (Category) | 0 (0.0%) | 6 (100.0%) |
| Total (Overall) | 44 (73.3%) | 16 (26.7%) |
Natural Resources, Construction and Maintenance Occupations
The most common Natural Resources, Construction and Maintenance occupations in Ruth are , and Construction & Extraction (16 | 26.7%).
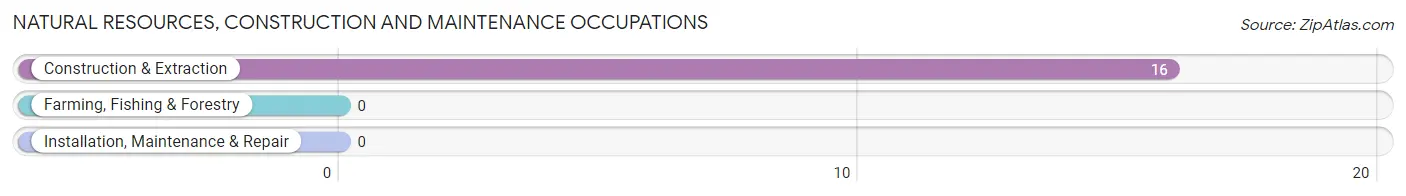
Natural Resources, Construction and Maintenance Occupations by Sex
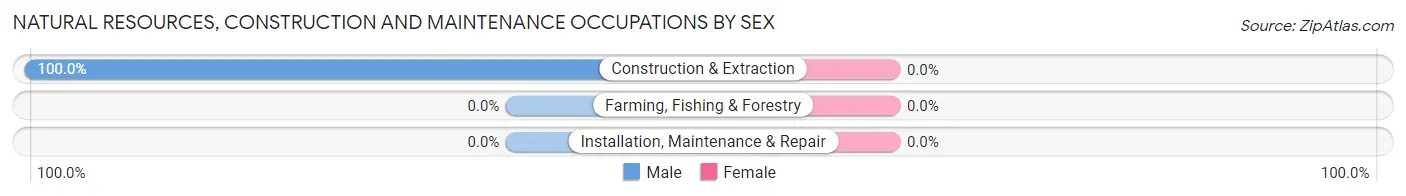
| Occupation | Male | Female |
| Farming, Fishing & Forestry | 0 (0.0%) | 0 (0.0%) |
| Construction & Extraction | 16 (100.0%) | 0 (0.0%) |
| Installation, Maintenance & Repair | 0 (0.0%) | 0 (0.0%) |
| Total (Category) | 16 (100.0%) | 0 (0.0%) |
| Total (Overall) | 44 (73.3%) | 16 (26.7%) |
Production, Transportation and Moving Occupations
The most common Production, Transportation and Moving occupations in Ruth are , and Production (21 | 35.0%).
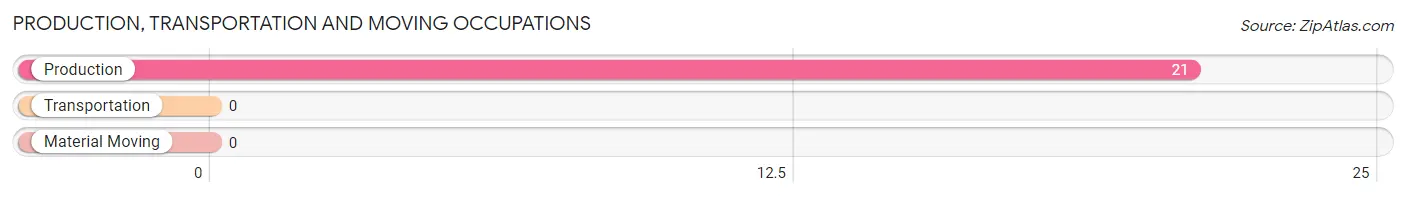
Production, Transportation and Moving Occupations by Sex
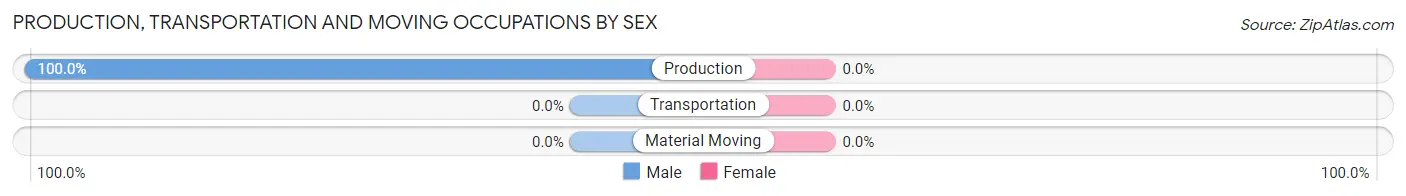
| Occupation | Male | Female |
| Production | 21 (100.0%) | 0 (0.0%) |
| Transportation | 0 (0.0%) | 0 (0.0%) |
| Material Moving | 0 (0.0%) | 0 (0.0%) |
| Total (Category) | 21 (100.0%) | 0 (0.0%) |
| Total (Overall) | 44 (73.3%) | 16 (26.7%) |
Employment Industries by Sex in Ruth
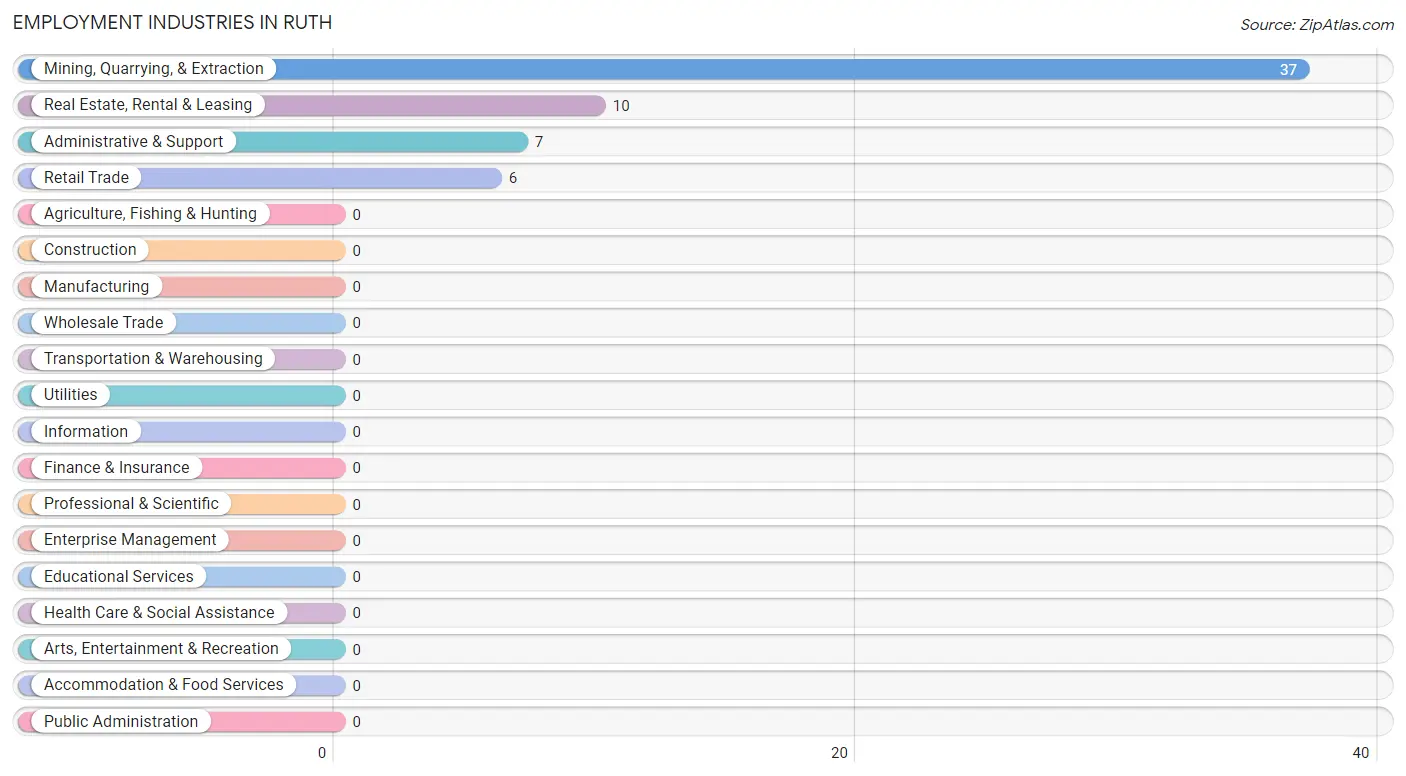
Employment Industries in Ruth
The major employment industries in Ruth include Mining, Quarrying, & Extraction (37 | 61.7%), Real Estate, Rental & Leasing (10 | 16.7%), Administrative & Support (7 | 11.7%), and Retail Trade (6 | 10.0%).
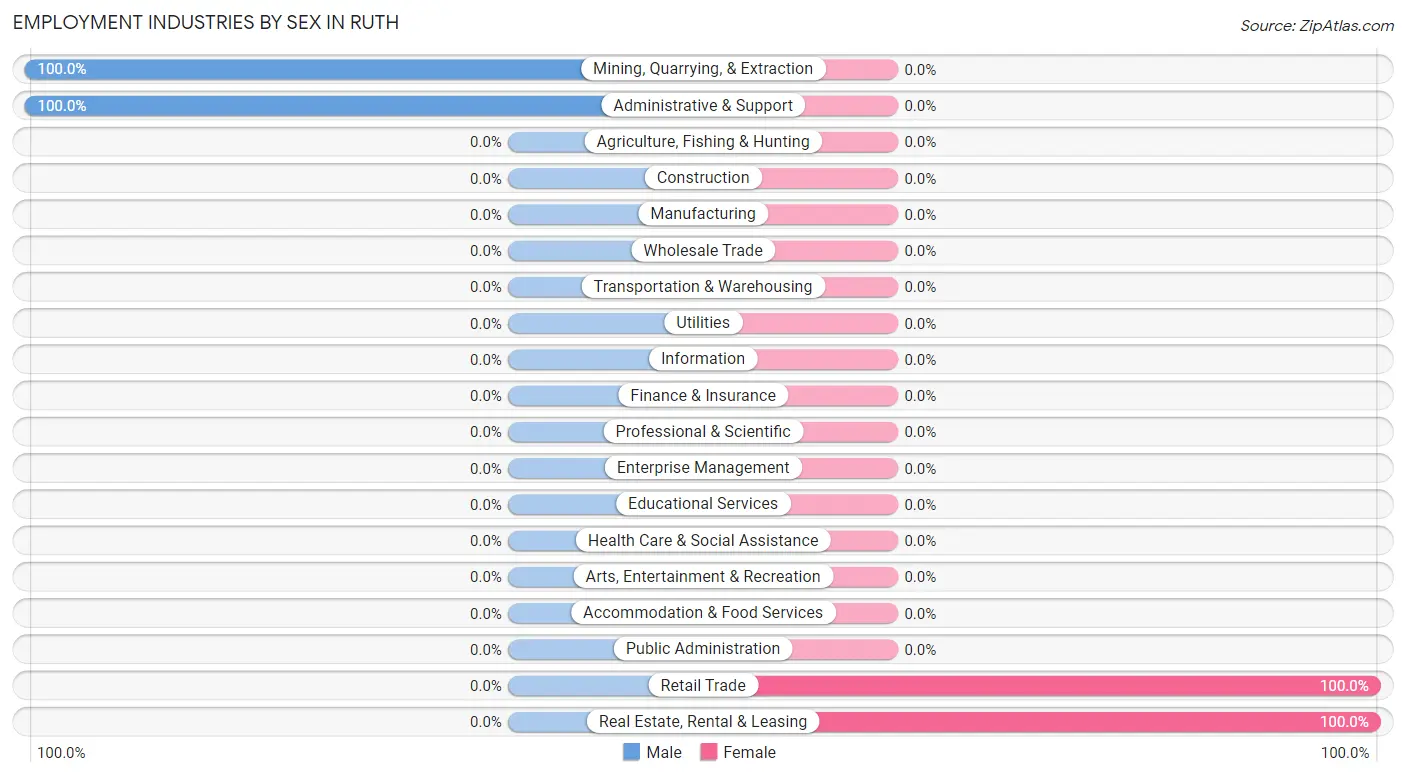
Employment Industries by Sex in Ruth
The Ruth industries that see more men than women are Mining, Quarrying, & Extraction (100.0%), and Administrative & Support (100.0%), whereas the industries that tend to have a higher number of women are Retail Trade (100.0%), and Real Estate, Rental & Leasing (100.0%).
| Industry | Male | Female |
| Agriculture, Fishing & Hunting | 0 (0.0%) | 0 (0.0%) |
| Mining, Quarrying, & Extraction | 37 (100.0%) | 0 (0.0%) |
| Construction | 0 (0.0%) | 0 (0.0%) |
| Manufacturing | 0 (0.0%) | 0 (0.0%) |
| Wholesale Trade | 0 (0.0%) | 0 (0.0%) |
| Retail Trade | 0 (0.0%) | 6 (100.0%) |
| Transportation & Warehousing | 0 (0.0%) | 0 (0.0%) |
| Utilities | 0 (0.0%) | 0 (0.0%) |
| Information | 0 (0.0%) | 0 (0.0%) |
| Finance & Insurance | 0 (0.0%) | 0 (0.0%) |
| Real Estate, Rental & Leasing | 0 (0.0%) | 10 (100.0%) |
| Professional & Scientific | 0 (0.0%) | 0 (0.0%) |
| Enterprise Management | 0 (0.0%) | 0 (0.0%) |
| Administrative & Support | 7 (100.0%) | 0 (0.0%) |
| Educational Services | 0 (0.0%) | 0 (0.0%) |
| Health Care & Social Assistance | 0 (0.0%) | 0 (0.0%) |
| Arts, Entertainment & Recreation | 0 (0.0%) | 0 (0.0%) |
| Accommodation & Food Services | 0 (0.0%) | 0 (0.0%) |
| Public Administration | 0 (0.0%) | 0 (0.0%) |
| Total | 44 (73.3%) | 16 (26.7%) |
Education in Ruth
School Enrollment in Ruth
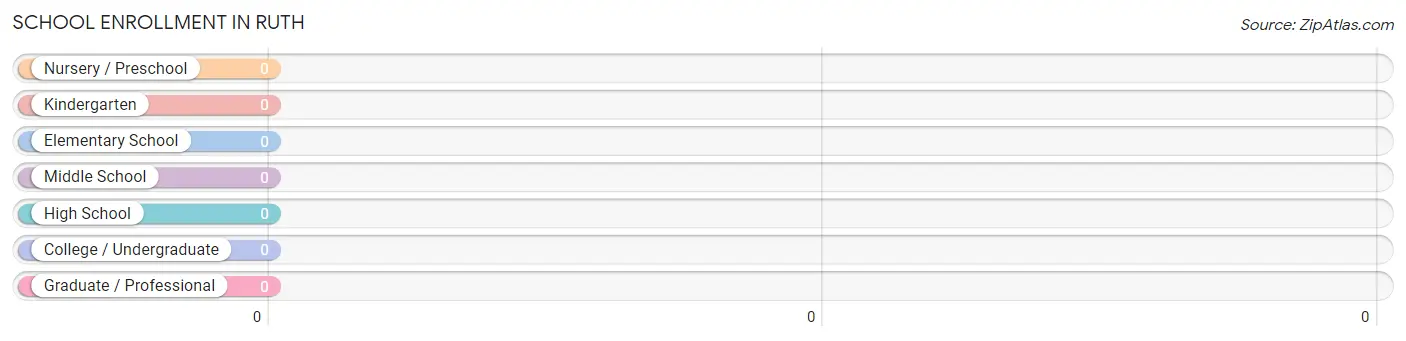
| School Level | # Students | % Students |
| Nursery / Preschool | 0 | 0.0% |
| Kindergarten | 0 | 0.0% |
| Elementary School | 0 | 0.0% |
| Middle School | 0 | 0.0% |
| High School | 0 | 0.0% |
| College / Undergraduate | 0 | 0.0% |
| Graduate / Professional | 0 | 0.0% |
| Total | 0 | 0.0% |
School Enrollment by Age by Funding Source in Ruth
| Age Bracket | Public School | Private School |
| 3 to 4 Year Olds | 0 (0.0%) | 0 (0.0%) |
| 5 to 9 Year Old | 0 (0.0%) | 0 (0.0%) |
| 10 to 14 Year Olds | 0 (0.0%) | 0 (0.0%) |
| 15 to 17 Year Olds | 0 (0.0%) | 0 (0.0%) |
| 18 to 19 Year Olds | 0 (0.0%) | 0 (0.0%) |
| 20 to 24 Year Olds | 0 (0.0%) | 0 (0.0%) |
| 25 to 34 Year Olds | 0 (0.0%) | 0 (0.0%) |
| 35 Years and over | 0 (0.0%) | 0 (0.0%) |
| Total | 0 (0.0%) | 0 (0.0%) |
Educational Attainment by Field of Study in Ruth
| Field of Study | # Graduates | % Graduates |
| Computers & Mathematics | 0 | 0.0% |
| Bio, Nature & Agricultural | 0 | 0.0% |
| Physical & Health Sciences | 0 | 0.0% |
| Psychology | 0 | 0.0% |
| Social Sciences | 0 | 0.0% |
| Engineering | 0 | 0.0% |
| Multidisciplinary Studies | 0 | 0.0% |
| Science & Technology | 0 | 0.0% |
| Business | 0 | 0.0% |
| Education | 0 | 0.0% |
| Literature & Languages | 0 | 0.0% |
| Liberal Arts & History | 0 | 0.0% |
| Visual & Performing Arts | 0 | 0.0% |
| Communications | 0 | 0.0% |
| Arts & Humanities | 0 | 0.0% |
| Total | 0 | 0.0% |
Transportation & Commute in Ruth
Vehicle Availability by Sex in Ruth
The most prevalent vehicle ownership categories in Ruth are males with 2 vehicles (17, accounting for 38.6%) and females with 2 vehicles (10, making up 106.2%).
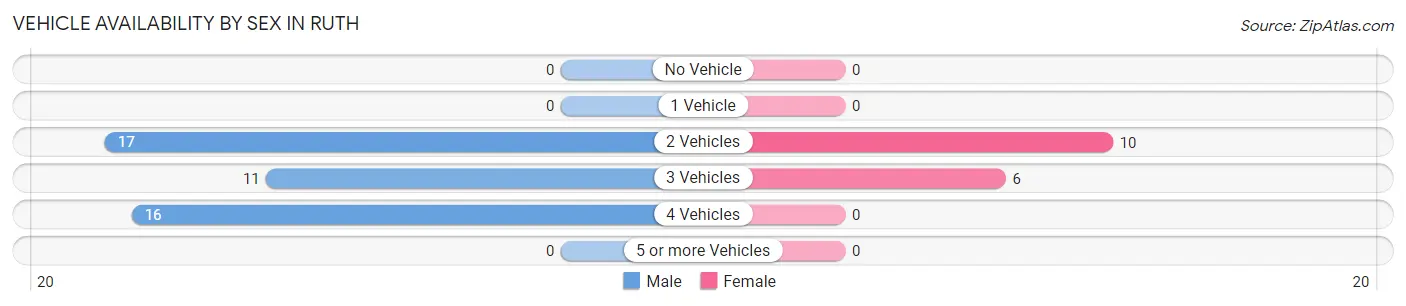
| Vehicles Available | Male | Female |
| No Vehicle | 0 (0.0%) | 0 (0.0%) |
| 1 Vehicle | 0 (0.0%) | 0 (0.0%) |
| 2 Vehicles | 17 (38.6%) | 10 (62.5%) |
| 3 Vehicles | 11 (25.0%) | 6 (37.5%) |
| 4 Vehicles | 16 (36.4%) | 0 (0.0%) |
| 5 or more Vehicles | 0 (0.0%) | 0 (0.0%) |
| Total | 44 (100.0%) | 16 (100.0%) |
Commute Time in Ruth
The most frequently occuring commute durations in Ruth are 20 to 24 minutes (33 commuters, 55.0%), 15 to 19 minutes (23 commuters, 38.3%), and 5 to 9 minutes (4 commuters, 6.7%).
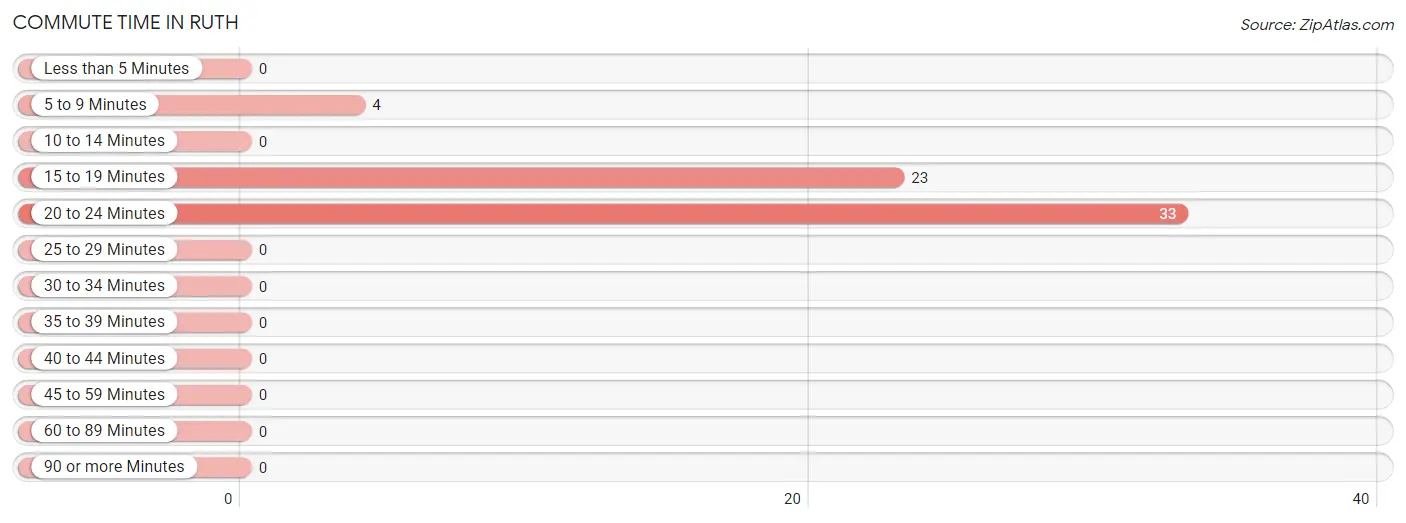
| Commute Time | # Commuters | % Commuters |
| Less than 5 Minutes | 0 | 0.0% |
| 5 to 9 Minutes | 4 | 6.7% |
| 10 to 14 Minutes | 0 | 0.0% |
| 15 to 19 Minutes | 23 | 38.3% |
| 20 to 24 Minutes | 33 | 55.0% |
| 25 to 29 Minutes | 0 | 0.0% |
| 30 to 34 Minutes | 0 | 0.0% |
| 35 to 39 Minutes | 0 | 0.0% |
| 40 to 44 Minutes | 0 | 0.0% |
| 45 to 59 Minutes | 0 | 0.0% |
| 60 to 89 Minutes | 0 | 0.0% |
| 90 or more Minutes | 0 | 0.0% |
Commute Time by Sex in Ruth
The most common commute times in Ruth are 20 to 24 minutes (33 commuters, 75.0%) for males and 15 to 19 minutes (16 commuters, 100.0%) for females.
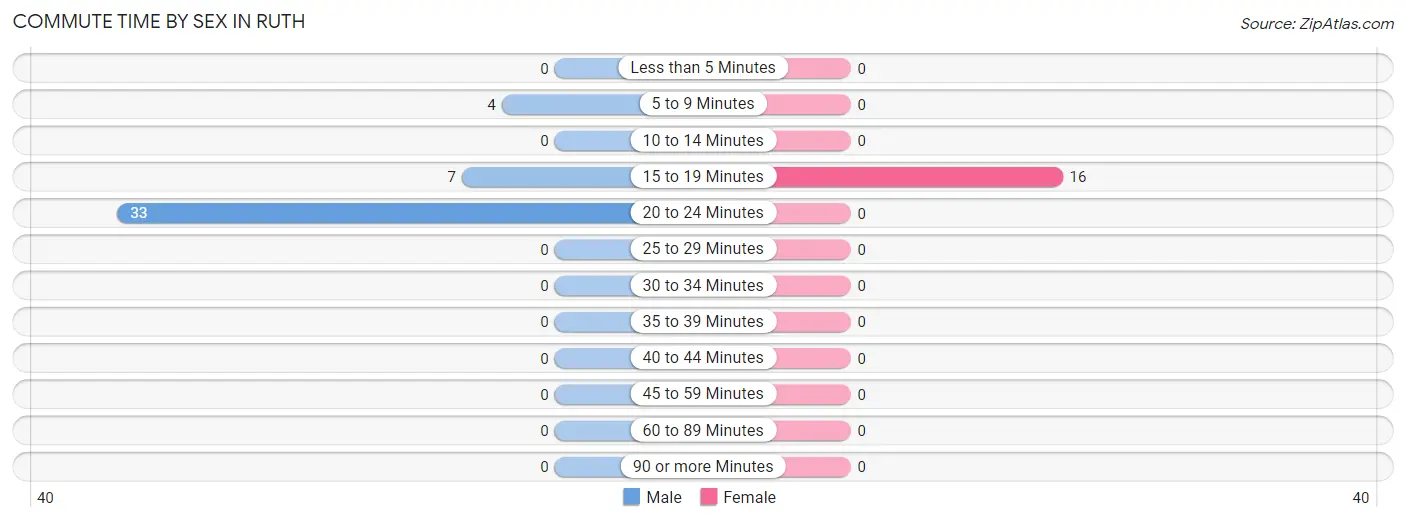
| Commute Time | Male | Female |
| Less than 5 Minutes | 0 (0.0%) | 0 (0.0%) |
| 5 to 9 Minutes | 4 (9.1%) | 0 (0.0%) |
| 10 to 14 Minutes | 0 (0.0%) | 0 (0.0%) |
| 15 to 19 Minutes | 7 (15.9%) | 16 (100.0%) |
| 20 to 24 Minutes | 33 (75.0%) | 0 (0.0%) |
| 25 to 29 Minutes | 0 (0.0%) | 0 (0.0%) |
| 30 to 34 Minutes | 0 (0.0%) | 0 (0.0%) |
| 35 to 39 Minutes | 0 (0.0%) | 0 (0.0%) |
| 40 to 44 Minutes | 0 (0.0%) | 0 (0.0%) |
| 45 to 59 Minutes | 0 (0.0%) | 0 (0.0%) |
| 60 to 89 Minutes | 0 (0.0%) | 0 (0.0%) |
| 90 or more Minutes | 0 (0.0%) | 0 (0.0%) |
Time of Departure to Work by Sex in Ruth
The most frequent times of departure to work in Ruth are 5:00 AM to 5:29 AM (17, 38.6%) for males and 10:00 AM to 10:59 AM (10, 62.5%) for females.
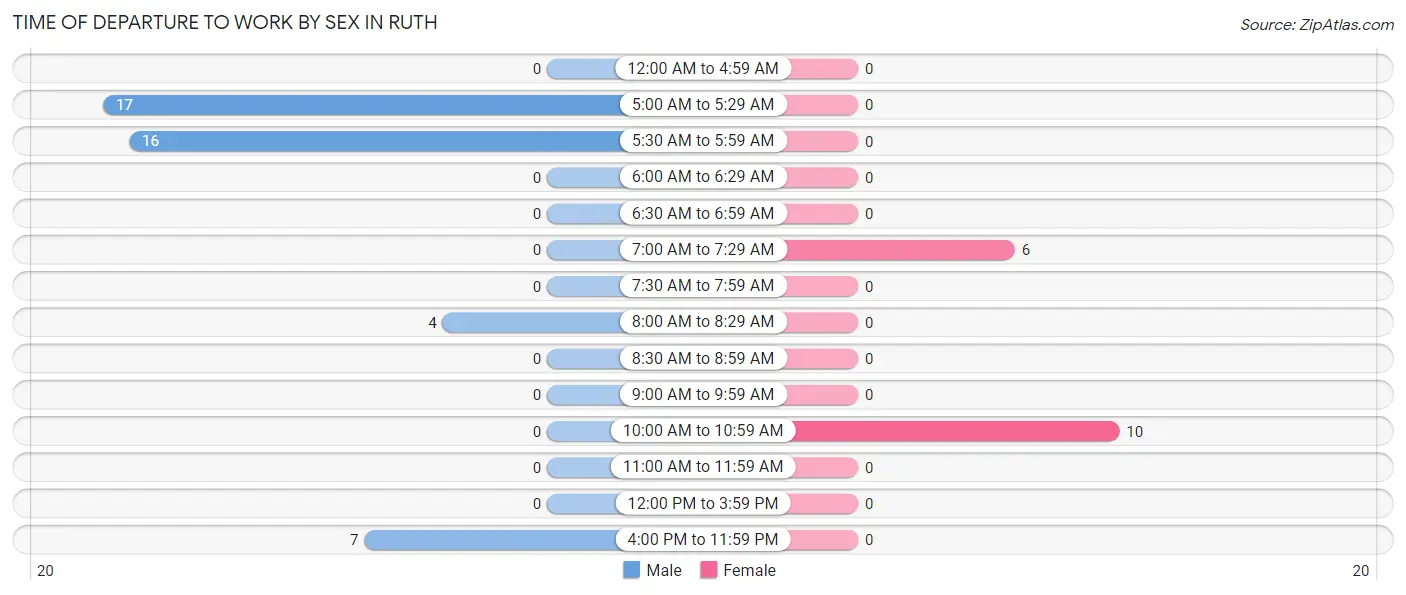
| Time of Departure | Male | Female |
| 12:00 AM to 4:59 AM | 0 (0.0%) | 0 (0.0%) |
| 5:00 AM to 5:29 AM | 17 (38.6%) | 0 (0.0%) |
| 5:30 AM to 5:59 AM | 16 (36.4%) | 0 (0.0%) |
| 6:00 AM to 6:29 AM | 0 (0.0%) | 0 (0.0%) |
| 6:30 AM to 6:59 AM | 0 (0.0%) | 0 (0.0%) |
| 7:00 AM to 7:29 AM | 0 (0.0%) | 6 (37.5%) |
| 7:30 AM to 7:59 AM | 0 (0.0%) | 0 (0.0%) |
| 8:00 AM to 8:29 AM | 4 (9.1%) | 0 (0.0%) |
| 8:30 AM to 8:59 AM | 0 (0.0%) | 0 (0.0%) |
| 9:00 AM to 9:59 AM | 0 (0.0%) | 0 (0.0%) |
| 10:00 AM to 10:59 AM | 0 (0.0%) | 10 (62.5%) |
| 11:00 AM to 11:59 AM | 0 (0.0%) | 0 (0.0%) |
| 12:00 PM to 3:59 PM | 0 (0.0%) | 0 (0.0%) |
| 4:00 PM to 11:59 PM | 7 (15.9%) | 0 (0.0%) |
| Total | 44 (100.0%) | 16 (100.0%) |
Housing Occupancy in Ruth
Occupancy by Ownership in Ruth
Of the total 117 dwellings in Ruth, owner-occupied units account for 117 (100.0%), while renter-occupied units make up 0 (0.0%).
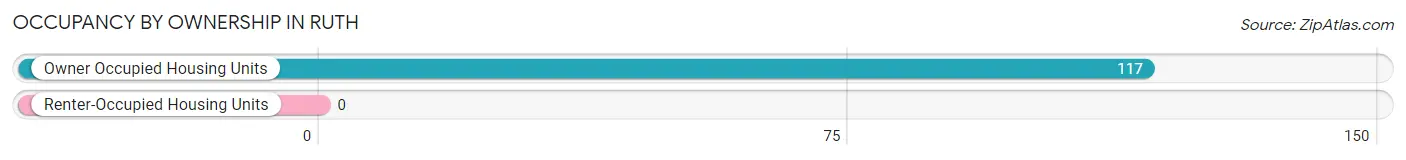
| Occupancy | # Housing Units | % Housing Units |
| Owner Occupied Housing Units | 117 | 100.0% |
| Renter-Occupied Housing Units | 0 | 0.0% |
| Total Occupied Housing Units | 117 | 100.0% |
Occupancy by Household Size in Ruth
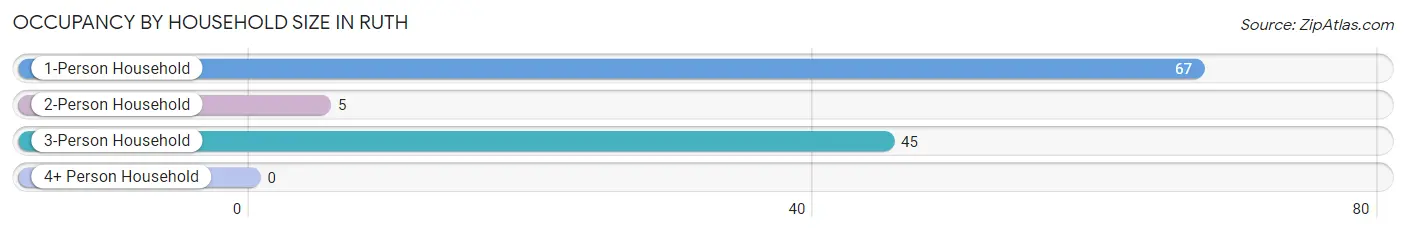
| Household Size | # Housing Units | % Housing Units |
| 1-Person Household | 67 | 57.3% |
| 2-Person Household | 5 | 4.3% |
| 3-Person Household | 45 | 38.5% |
| 4+ Person Household | 0 | 0.0% |
| Total Housing Units | 117 | 100.0% |
Occupancy by Ownership by Household Size in Ruth
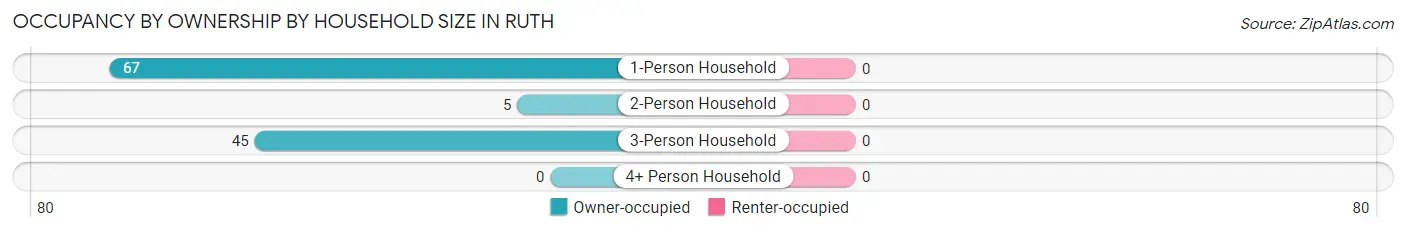
| Household Size | Owner-occupied | Renter-occupied |
| 1-Person Household | 67 (100.0%) | 0 (0.0%) |
| 2-Person Household | 5 (100.0%) | 0 (0.0%) |
| 3-Person Household | 45 (100.0%) | 0 (0.0%) |
| 4+ Person Household | 0 (0.0%) | 0 (0.0%) |
| Total Housing Units | 117 (100.0%) | 0 (0.0%) |
Occupancy by Educational Attainment in Ruth
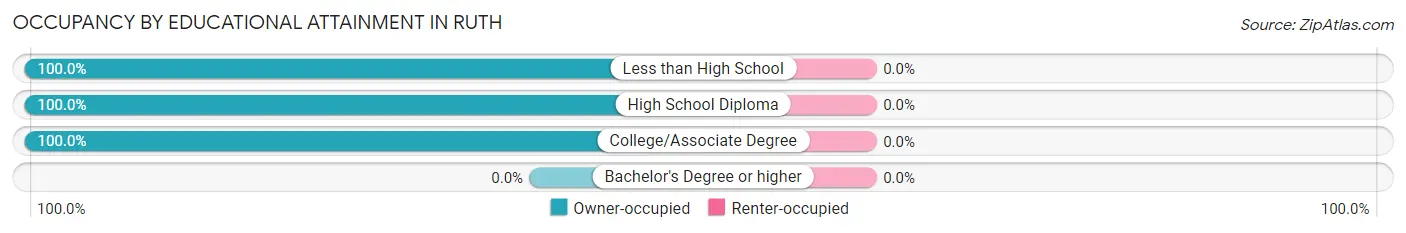
| Household Size | Owner-occupied | Renter-occupied |
| Less than High School | 16 (100.0%) | 0 (0.0%) |
| High School Diploma | 81 (100.0%) | 0 (0.0%) |
| College/Associate Degree | 20 (100.0%) | 0 (0.0%) |
| Bachelor's Degree or higher | 0 (0.0%) | 0 (0.0%) |
Occupancy by Age of Householder in Ruth
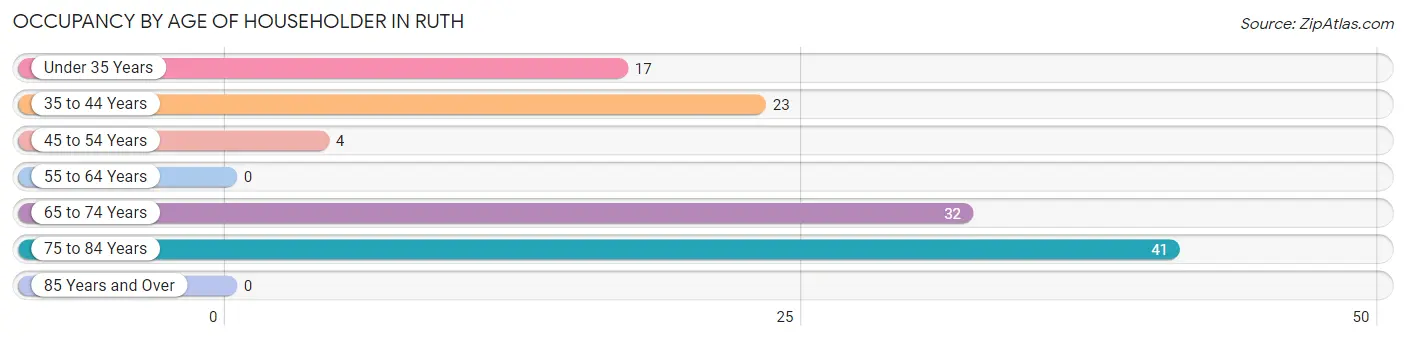
| Age Bracket | # Households | % Households |
| Under 35 Years | 17 | 14.5% |
| 35 to 44 Years | 23 | 19.7% |
| 45 to 54 Years | 4 | 3.4% |
| 55 to 64 Years | 0 | 0.0% |
| 65 to 74 Years | 32 | 27.4% |
| 75 to 84 Years | 41 | 35.0% |
| 85 Years and Over | 0 | 0.0% |
| Total | 117 | 100.0% |
Housing Finances in Ruth
Median Income by Occupancy in Ruth
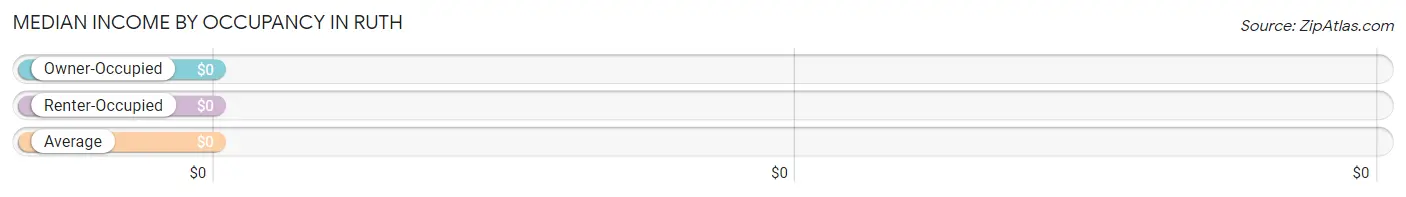
| Occupancy Type | # Households | Median Income |
| Owner-Occupied | 117 (100.0%) | $0 |
| Renter-Occupied | 0 (0.0%) | $0 |
| Average | 117 (100.0%) | $0 |
Occupancy by Householder Income Bracket in Ruth
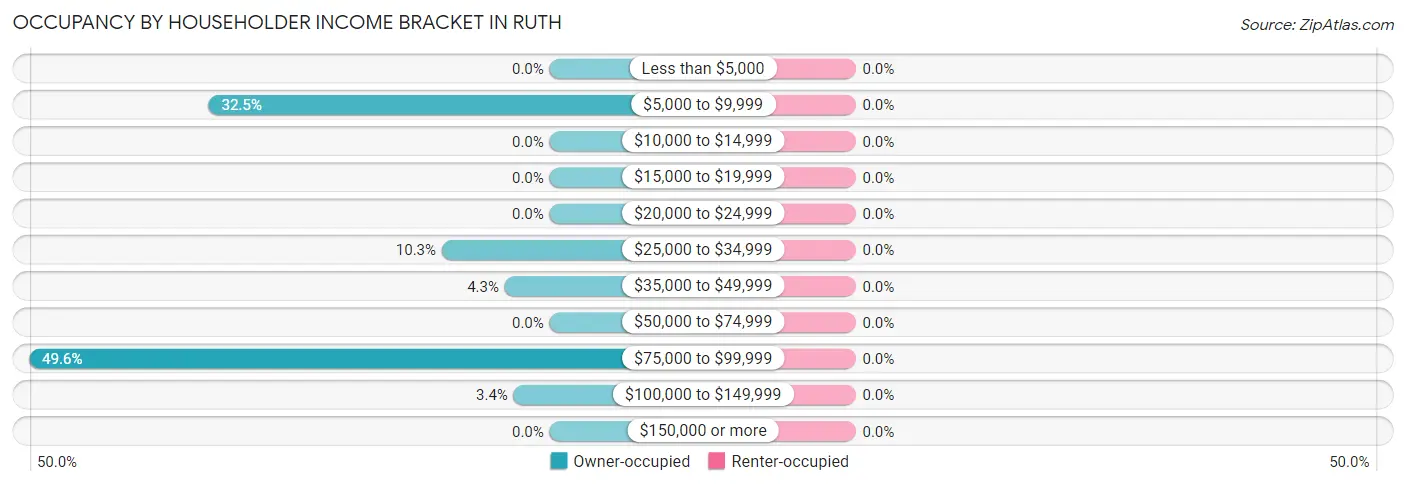
| Income Bracket | Owner-occupied | Renter-occupied |
| Less than $5,000 | 0 (0.0%) | 0 (0.0%) |
| $5,000 to $9,999 | 38 (32.5%) | 0 (0.0%) |
| $10,000 to $14,999 | 0 (0.0%) | 0 (0.0%) |
| $15,000 to $19,999 | 0 (0.0%) | 0 (0.0%) |
| $20,000 to $24,999 | 0 (0.0%) | 0 (0.0%) |
| $25,000 to $34,999 | 12 (10.3%) | 0 (0.0%) |
| $35,000 to $49,999 | 5 (4.3%) | 0 (0.0%) |
| $50,000 to $74,999 | 0 (0.0%) | 0 (0.0%) |
| $75,000 to $99,999 | 58 (49.6%) | 0 (0.0%) |
| $100,000 to $149,999 | 4 (3.4%) | 0 (0.0%) |
| $150,000 or more | 0 (0.0%) | 0 (0.0%) |
| Total | 117 (100.0%) | 0 (0.0%) |
Monthly Housing Cost Tiers in Ruth
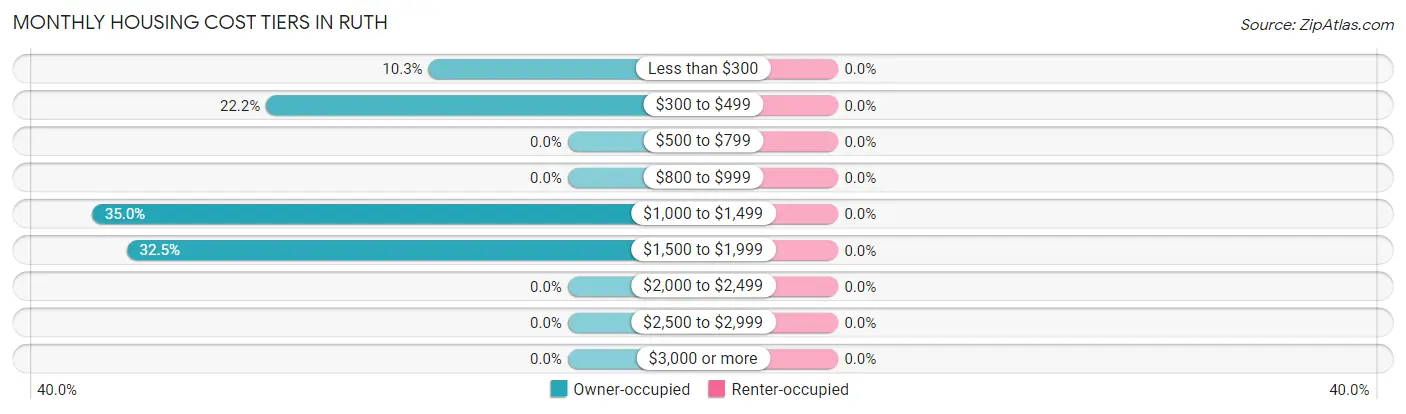
| Monthly Cost | Owner-occupied | Renter-occupied |
| Less than $300 | 12 (10.3%) | 0 (0.0%) |
| $300 to $499 | 26 (22.2%) | 0 (0.0%) |
| $500 to $799 | 0 (0.0%) | 0 (0.0%) |
| $800 to $999 | 0 (0.0%) | 0 (0.0%) |
| $1,000 to $1,499 | 41 (35.0%) | 0 (0.0%) |
| $1,500 to $1,999 | 38 (32.5%) | 0 (0.0%) |
| $2,000 to $2,499 | 0 (0.0%) | 0 (0.0%) |
| $2,500 to $2,999 | 0 (0.0%) | 0 (0.0%) |
| $3,000 or more | 0 (0.0%) | 0 (0.0%) |
| Total | 117 (100.0%) | 0 (0.0%) |
Physical Housing Characteristics in Ruth
Housing Structures in Ruth
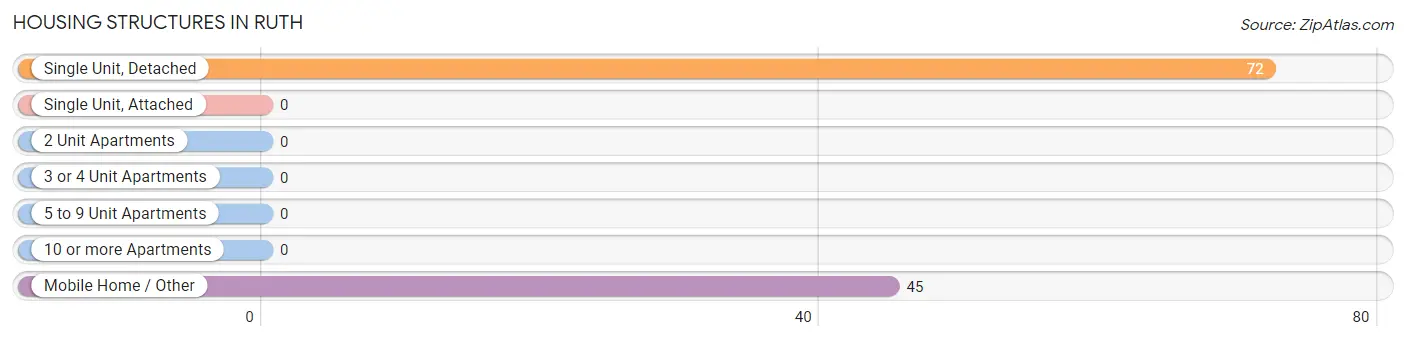
| Structure Type | # Housing Units | % Housing Units |
| Single Unit, Detached | 72 | 61.5% |
| Single Unit, Attached | 0 | 0.0% |
| 2 Unit Apartments | 0 | 0.0% |
| 3 or 4 Unit Apartments | 0 | 0.0% |
| 5 to 9 Unit Apartments | 0 | 0.0% |
| 10 or more Apartments | 0 | 0.0% |
| Mobile Home / Other | 45 | 38.5% |
| Total | 117 | 100.0% |
Housing Structures by Occupancy in Ruth
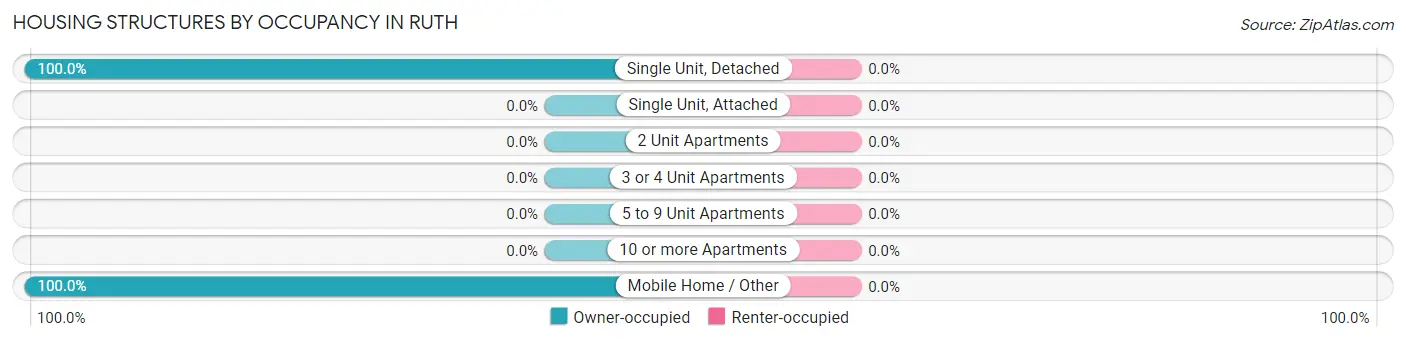
| Structure Type | Owner-occupied | Renter-occupied |
| Single Unit, Detached | 72 (100.0%) | 0 (0.0%) |
| Single Unit, Attached | 0 (0.0%) | 0 (0.0%) |
| 2 Unit Apartments | 0 (0.0%) | 0 (0.0%) |
| 3 or 4 Unit Apartments | 0 (0.0%) | 0 (0.0%) |
| 5 to 9 Unit Apartments | 0 (0.0%) | 0 (0.0%) |
| 10 or more Apartments | 0 (0.0%) | 0 (0.0%) |
| Mobile Home / Other | 45 (100.0%) | 0 (0.0%) |
| Total | 117 (100.0%) | 0 (0.0%) |
Housing Structures by Number of Rooms in Ruth
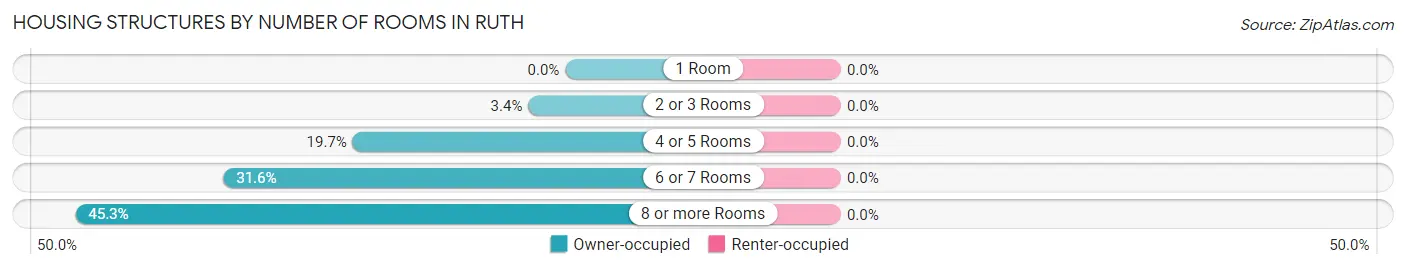
| Number of Rooms | Owner-occupied | Renter-occupied |
| 1 Room | 0 (0.0%) | 0 (0.0%) |
| 2 or 3 Rooms | 4 (3.4%) | 0 (0.0%) |
| 4 or 5 Rooms | 23 (19.7%) | 0 (0.0%) |
| 6 or 7 Rooms | 37 (31.6%) | 0 (0.0%) |
| 8 or more Rooms | 53 (45.3%) | 0 (0.0%) |
| Total | 117 (100.0%) | 0 (0.0%) |
Housing Structure by Heating Type in Ruth
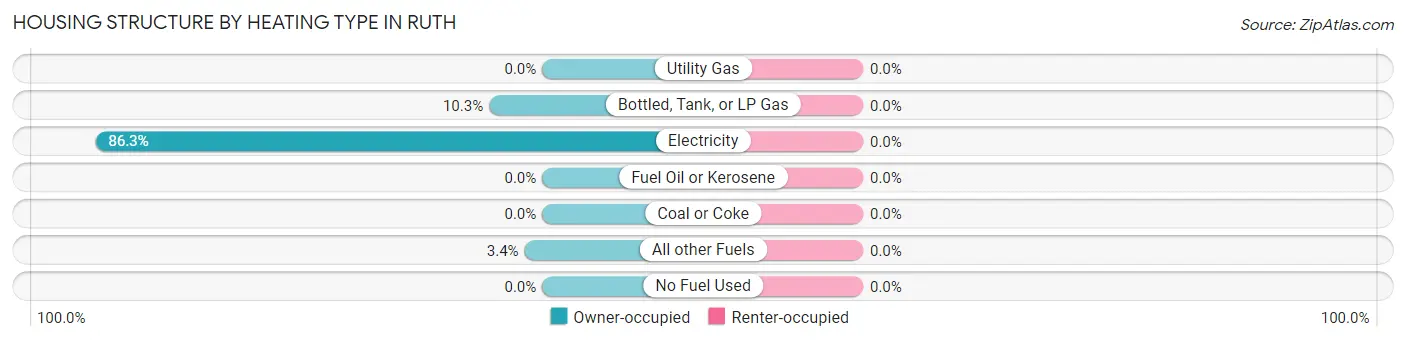
| Heating Type | Owner-occupied | Renter-occupied |
| Utility Gas | 0 (0.0%) | 0 (0.0%) |
| Bottled, Tank, or LP Gas | 12 (10.3%) | 0 (0.0%) |
| Electricity | 101 (86.3%) | 0 (0.0%) |
| Fuel Oil or Kerosene | 0 (0.0%) | 0 (0.0%) |
| Coal or Coke | 0 (0.0%) | 0 (0.0%) |
| All other Fuels | 4 (3.4%) | 0 (0.0%) |
| No Fuel Used | 0 (0.0%) | 0 (0.0%) |
| Total | 117 (100.0%) | 0 (0.0%) |
Household Vehicle Usage in Ruth
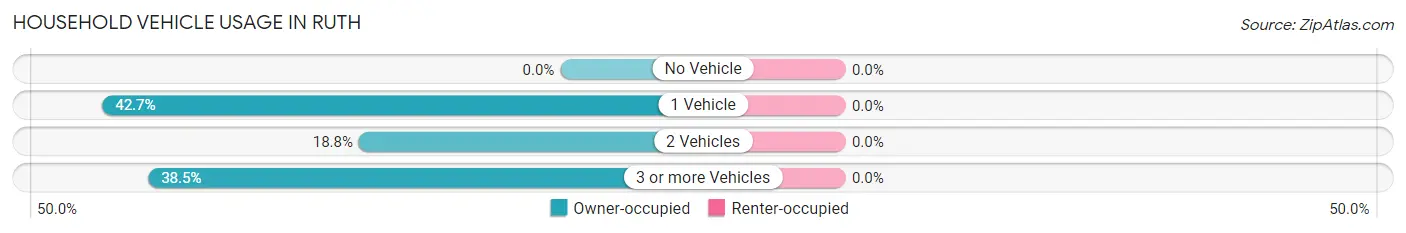
| Vehicles per Household | Owner-occupied | Renter-occupied |
| No Vehicle | 0 (0.0%) | 0 (0.0%) |
| 1 Vehicle | 50 (42.7%) | 0 (0.0%) |
| 2 Vehicles | 22 (18.8%) | 0 (0.0%) |
| 3 or more Vehicles | 45 (38.5%) | 0 (0.0%) |
| Total | 117 (100.0%) | 0 (0.0%) |
Real Estate & Mortgages in Ruth
Real Estate and Mortgage Overview in Ruth
| Characteristic | Without Mortgage | With Mortgage |
| Housing Units | 79 | 38 |
| Median Property Value | $65,300 | $0 |
| Median Household Income | $90,970 | $0 |
| Monthly Housing Costs | - | - |
| Real Estate Taxes | $481 | $0 |
Property Value by Mortgage Status in Ruth
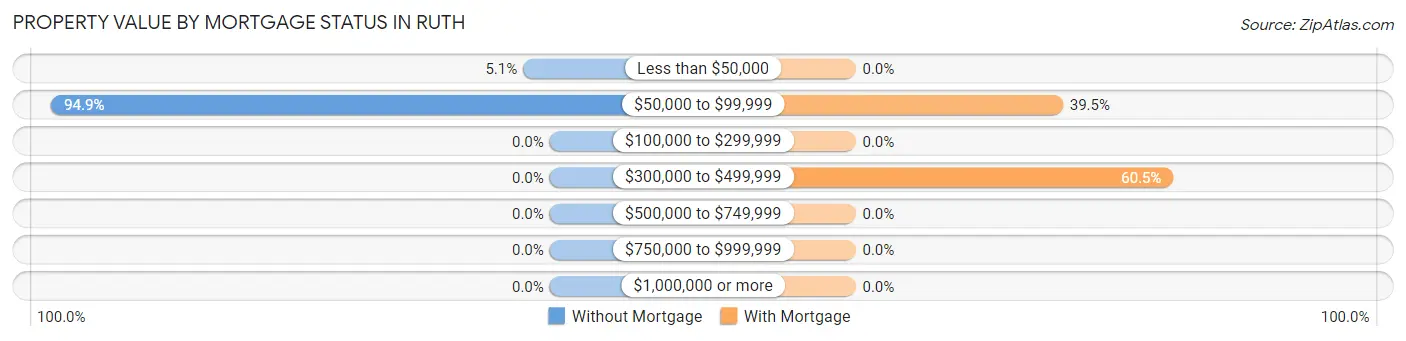
| Property Value | Without Mortgage | With Mortgage |
| Less than $50,000 | 4 (5.1%) | 0 (0.0%) |
| $50,000 to $99,999 | 75 (94.9%) | 15 (39.5%) |
| $100,000 to $299,999 | 0 (0.0%) | 0 (0.0%) |
| $300,000 to $499,999 | 0 (0.0%) | 23 (60.5%) |
| $500,000 to $749,999 | 0 (0.0%) | 0 (0.0%) |
| $750,000 to $999,999 | 0 (0.0%) | 0 (0.0%) |
| $1,000,000 or more | 0 (0.0%) | 0 (0.0%) |
| Total | 79 (100.0%) | 38 (100.0%) |
Household Income by Mortgage Status in Ruth
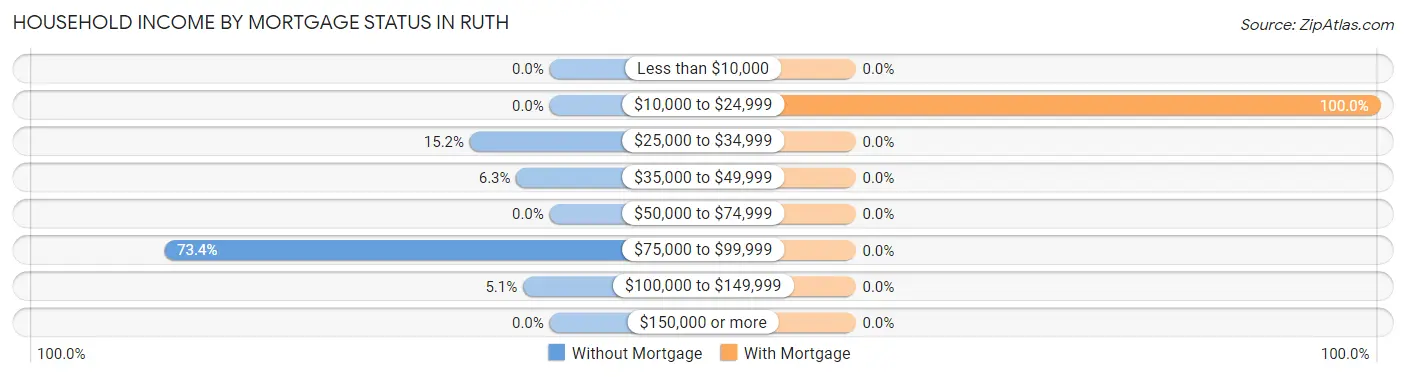
| Household Income | Without Mortgage | With Mortgage |
| Less than $10,000 | 0 (0.0%) | 0 (0.0%) |
| $10,000 to $24,999 | 0 (0.0%) | 38 (100.0%) |
| $25,000 to $34,999 | 12 (15.2%) | 0 (0.0%) |
| $35,000 to $49,999 | 5 (6.3%) | 0 (0.0%) |
| $50,000 to $74,999 | 0 (0.0%) | 0 (0.0%) |
| $75,000 to $99,999 | 58 (73.4%) | 0 (0.0%) |
| $100,000 to $149,999 | 4 (5.1%) | 0 (0.0%) |
| $150,000 or more | 0 (0.0%) | 0 (0.0%) |
| Total | 79 (100.0%) | 38 (100.0%) |
Property Value to Household Income Ratio in Ruth
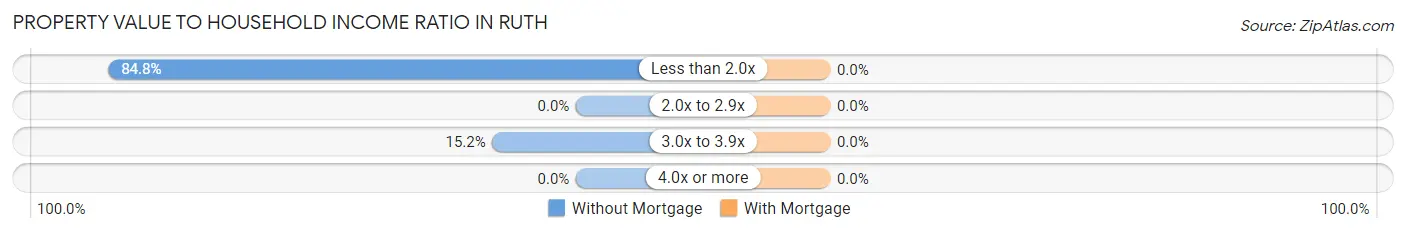
| Value-to-Income Ratio | Without Mortgage | With Mortgage |
| Less than 2.0x | 67 (84.8%) | 0 (0.0%) |
| 2.0x to 2.9x | 0 (0.0%) | 0 (0.0%) |
| 3.0x to 3.9x | 12 (15.2%) | 0 (0.0%) |
| 4.0x or more | 0 (0.0%) | 0 (0.0%) |
| Total | 79 (100.0%) | 38 (100.0%) |
Real Estate Taxes by Mortgage Status in Ruth
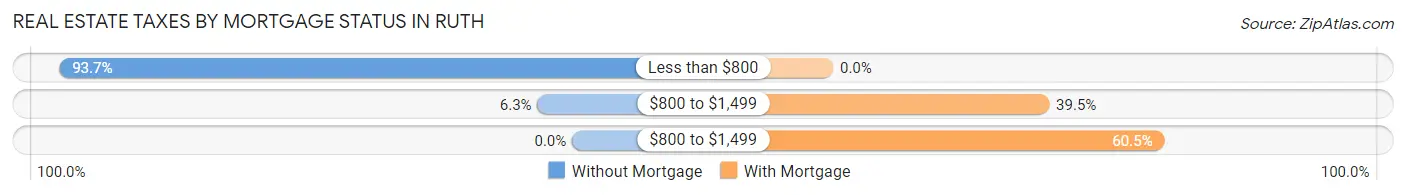
| Property Taxes | Without Mortgage | With Mortgage |
| Less than $800 | 74 (93.7%) | 0 (0.0%) |
| $800 to $1,499 | 5 (6.3%) | 15 (39.5%) |
| $800 to $1,499 | 0 (0.0%) | 23 (60.5%) |
| Total | 79 (100.0%) | 38 (100.0%) |
Health & Disability in Ruth
Health Insurance Coverage by Age in Ruth
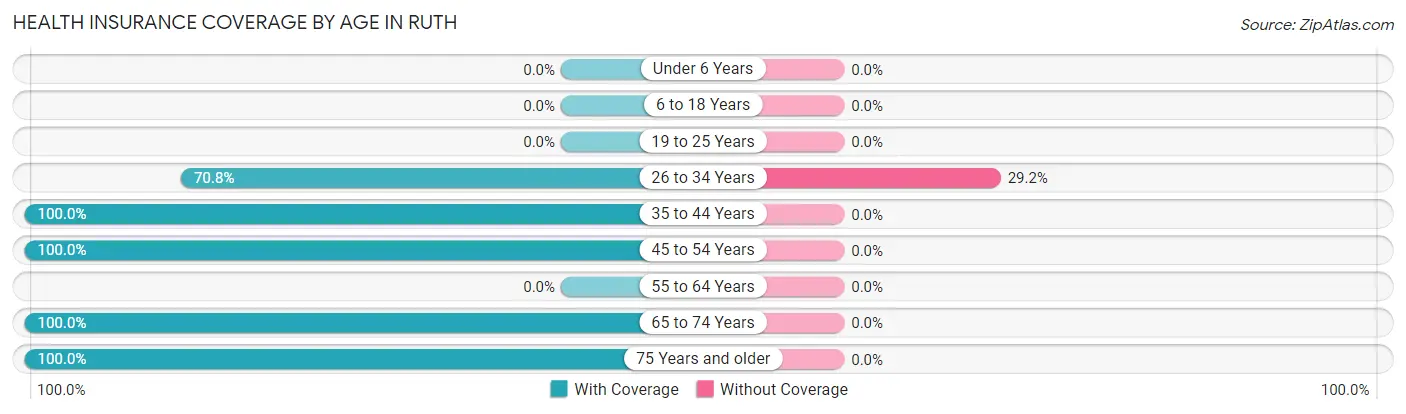
| Age Bracket | With Coverage | Without Coverage |
| Under 6 Years | 0 (0.0%) | 0 (0.0%) |
| 6 to 18 Years | 0 (0.0%) | 0 (0.0%) |
| 19 to 25 Years | 0 (0.0%) | 0 (0.0%) |
| 26 to 34 Years | 17 (70.8%) | 7 (29.2%) |
| 35 to 44 Years | 23 (100.0%) | 0 (0.0%) |
| 45 to 54 Years | 26 (100.0%) | 0 (0.0%) |
| 55 to 64 Years | 0 (0.0%) | 0 (0.0%) |
| 65 to 74 Years | 42 (100.0%) | 0 (0.0%) |
| 75 Years and older | 74 (100.0%) | 0 (0.0%) |
| Total | 182 (96.3%) | 7 (3.7%) |
Health Insurance Coverage by Citizenship Status in Ruth
| Citizenship Status | With Coverage | Without Coverage |
| Native Born | 0 (0.0%) | 0 (0.0%) |
| Foreign Born, Citizen | 0 (0.0%) | 0 (0.0%) |
| Foreign Born, not a Citizen | 0 (0.0%) | 0 (0.0%) |
Health Insurance Coverage by Household Income in Ruth
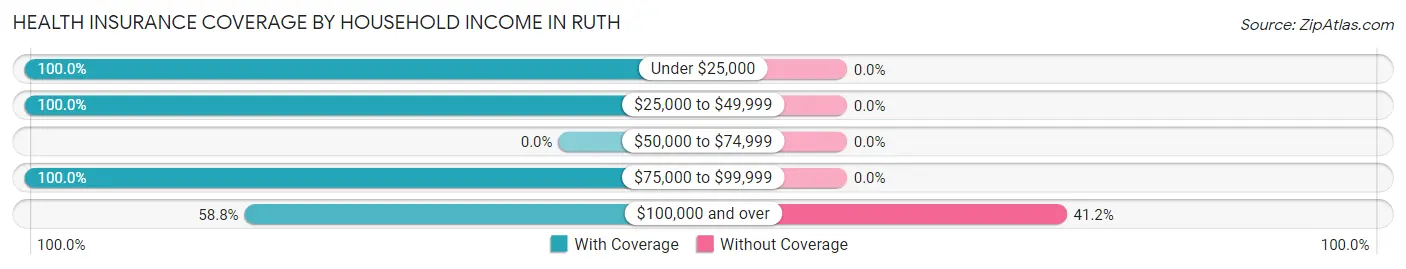
| Household Income | With Coverage | Without Coverage |
| Under $25,000 | 38 (100.0%) | 0 (0.0%) |
| $25,000 to $49,999 | 27 (100.0%) | 0 (0.0%) |
| $50,000 to $74,999 | 0 (0.0%) | 0 (0.0%) |
| $75,000 to $99,999 | 107 (100.0%) | 0 (0.0%) |
| $100,000 and over | 10 (58.8%) | 7 (41.2%) |
Public vs Private Health Insurance Coverage by Age in Ruth
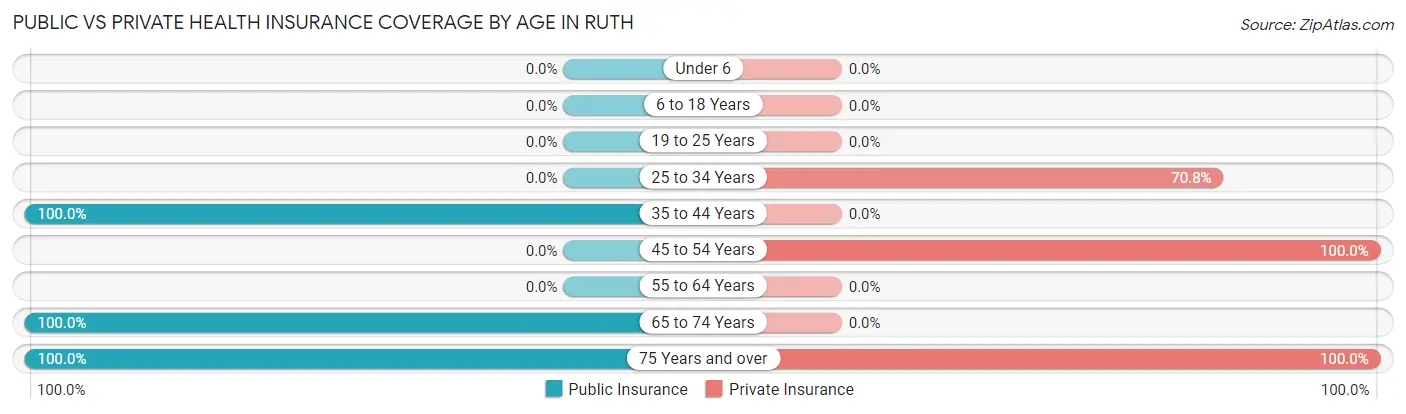
| Age Bracket | Public Insurance | Private Insurance |
| Under 6 | 0 (0.0%) | 0 (0.0%) |
| 6 to 18 Years | 0 (0.0%) | 0 (0.0%) |
| 19 to 25 Years | 0 (0.0%) | 0 (0.0%) |
| 25 to 34 Years | 0 (0.0%) | 17 (70.8%) |
| 35 to 44 Years | 23 (100.0%) | 0 (0.0%) |
| 45 to 54 Years | 0 (0.0%) | 26 (100.0%) |
| 55 to 64 Years | 0 (0.0%) | 0 (0.0%) |
| 65 to 74 Years | 42 (100.0%) | 0 (0.0%) |
| 75 Years and over | 74 (100.0%) | 74 (100.0%) |
| Total | 139 (73.5%) | 117 (61.9%) |
Disability Status by Sex by Age in Ruth
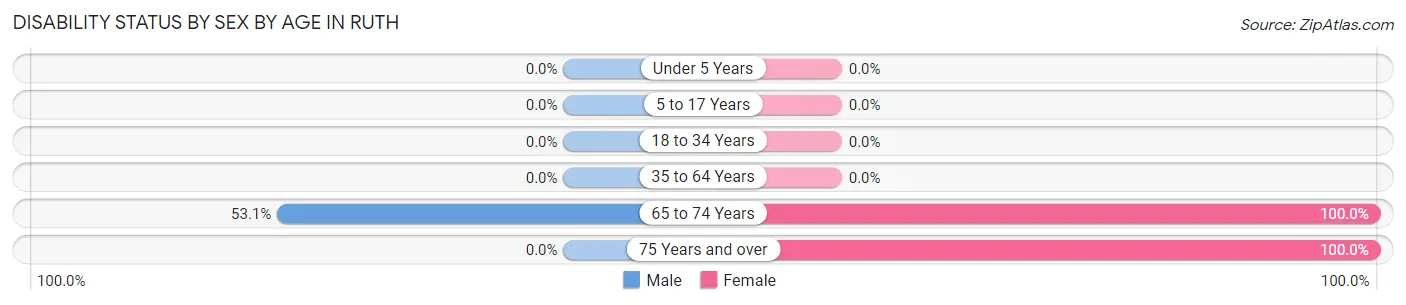
| Age Bracket | Male | Female |
| Under 5 Years | 0 (0.0%) | 0 (0.0%) |
| 5 to 17 Years | 0 (0.0%) | 0 (0.0%) |
| 18 to 34 Years | 0 (0.0%) | 0 (0.0%) |
| 35 to 64 Years | 0 (0.0%) | 0 (0.0%) |
| 65 to 74 Years | 17 (53.1%) | 10 (100.0%) |
| 75 Years and over | 0 (0.0%) | 33 (100.0%) |
Disability Class by Sex by Age in Ruth
Disability Class: Hearing Difficulty
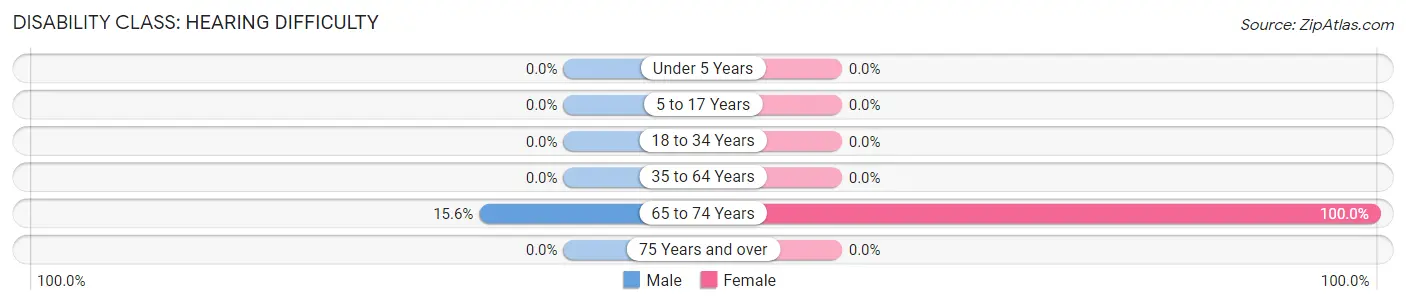
| Age Bracket | Male | Female |
| Under 5 Years | 0 (0.0%) | 0 (0.0%) |
| 5 to 17 Years | 0 (0.0%) | 0 (0.0%) |
| 18 to 34 Years | 0 (0.0%) | 0 (0.0%) |
| 35 to 64 Years | 0 (0.0%) | 0 (0.0%) |
| 65 to 74 Years | 5 (15.6%) | 10 (100.0%) |
| 75 Years and over | 0 (0.0%) | 0 (0.0%) |
Disability Class: Vision Difficulty
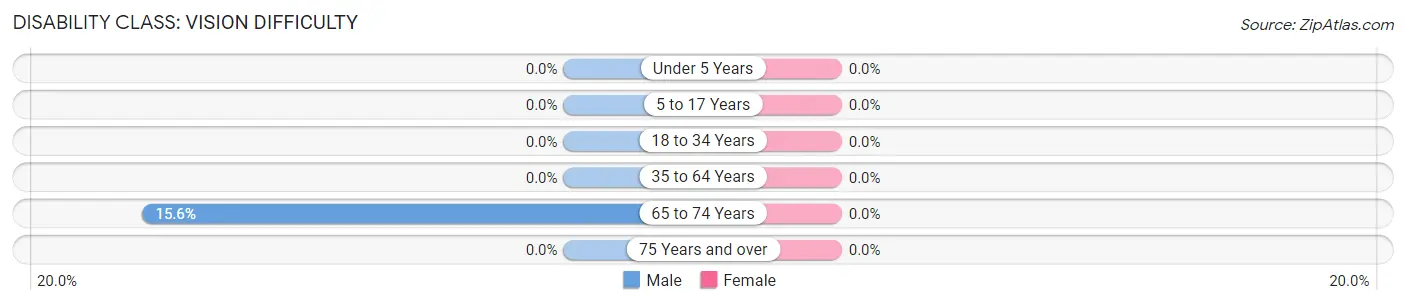
| Age Bracket | Male | Female |
| Under 5 Years | 0 (0.0%) | 0 (0.0%) |
| 5 to 17 Years | 0 (0.0%) | 0 (0.0%) |
| 18 to 34 Years | 0 (0.0%) | 0 (0.0%) |
| 35 to 64 Years | 0 (0.0%) | 0 (0.0%) |
| 65 to 74 Years | 5 (15.6%) | 0 (0.0%) |
| 75 Years and over | 0 (0.0%) | 0 (0.0%) |
Disability Class: Cognitive Difficulty
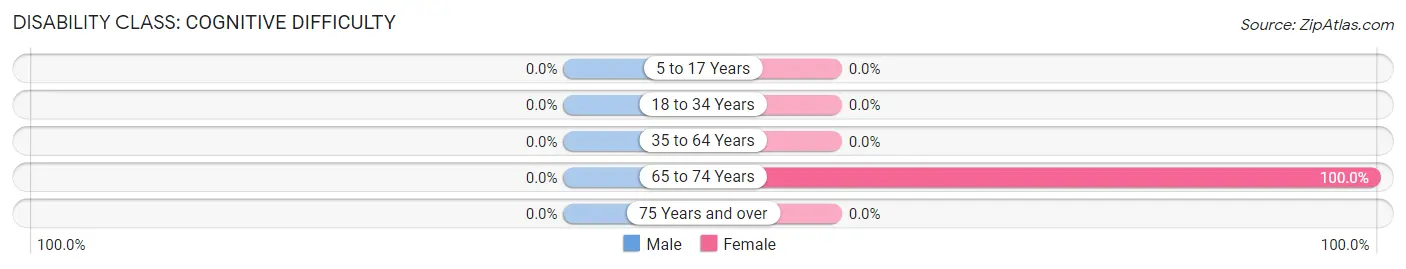
| Age Bracket | Male | Female |
| 5 to 17 Years | 0 (0.0%) | 0 (0.0%) |
| 18 to 34 Years | 0 (0.0%) | 0 (0.0%) |
| 35 to 64 Years | 0 (0.0%) | 0 (0.0%) |
| 65 to 74 Years | 0 (0.0%) | 10 (100.0%) |
| 75 Years and over | 0 (0.0%) | 0 (0.0%) |
Disability Class: Ambulatory Difficulty
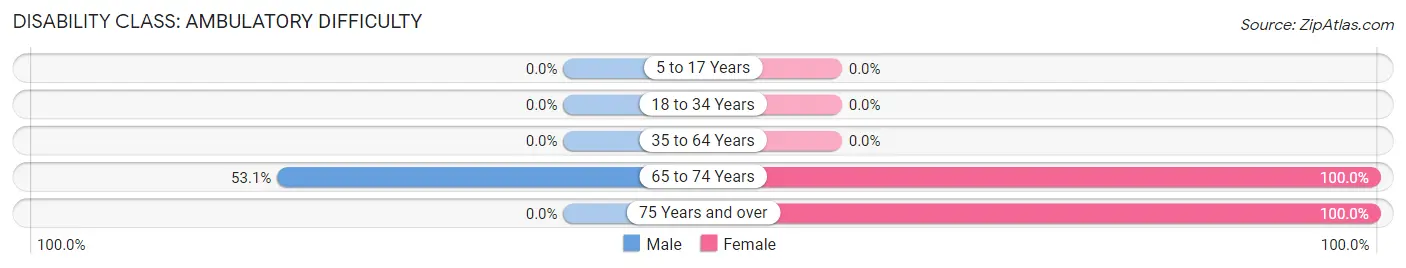
| Age Bracket | Male | Female |
| 5 to 17 Years | 0 (0.0%) | 0 (0.0%) |
| 18 to 34 Years | 0 (0.0%) | 0 (0.0%) |
| 35 to 64 Years | 0 (0.0%) | 0 (0.0%) |
| 65 to 74 Years | 17 (53.1%) | 10 (100.0%) |
| 75 Years and over | 0 (0.0%) | 33 (100.0%) |
Disability Class: Self-Care Difficulty
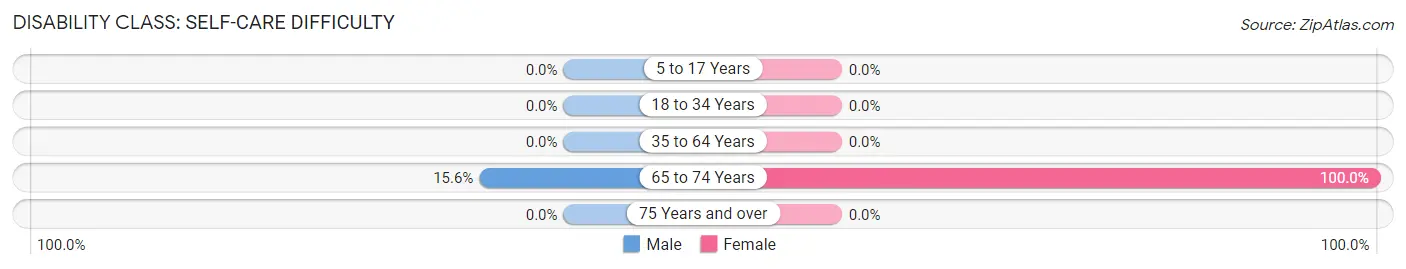
| Age Bracket | Male | Female |
| 5 to 17 Years | 0 (0.0%) | 0 (0.0%) |
| 18 to 34 Years | 0 (0.0%) | 0 (0.0%) |
| 35 to 64 Years | 0 (0.0%) | 0 (0.0%) |
| 65 to 74 Years | 5 (15.6%) | 10 (100.0%) |
| 75 Years and over | 0 (0.0%) | 0 (0.0%) |
Technology Access in Ruth
Computing Device Access in Ruth
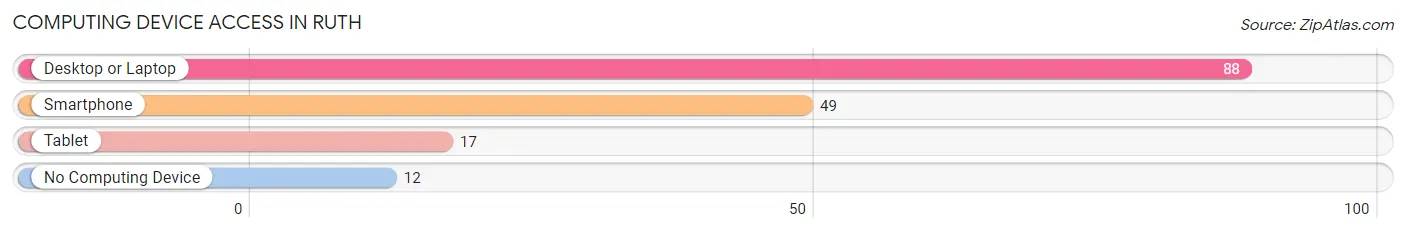
| Device Type | # Households | % Households |
| Desktop or Laptop | 88 | 75.2% |
| Smartphone | 49 | 41.9% |
| Tablet | 17 | 14.5% |
| No Computing Device | 12 | 10.3% |
| Total | 117 | 100.0% |
Internet Access in Ruth
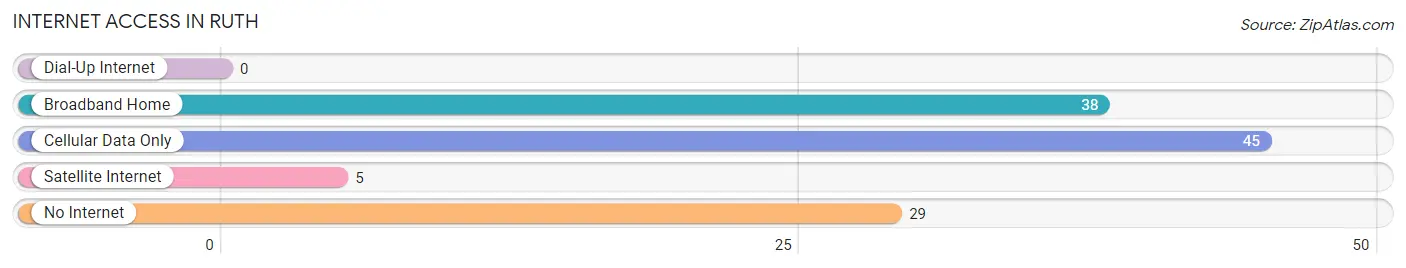
| Internet Type | # Households | % Households |
| Dial-Up Internet | 0 | 0.0% |
| Broadband Home | 38 | 32.5% |
| Cellular Data Only | 45 | 38.5% |
| Satellite Internet | 5 | 4.3% |
| No Internet | 29 | 24.8% |
| Total | 117 | 100.0% |
Ruth Summary
Ruth is an unincorporated town located in White Pine County, Nevada. It is situated in the eastern part of the state, approximately 20 miles south of Ely. The town was founded in 1906 and named after the daughter of the first postmaster, Ruth Smith. The population of Ruth was estimated to be around 200 people in 2000.
Geography
Ruth is located in the Great Basin region of Nevada, which is characterized by its arid climate and sparse vegetation. The town is situated in a valley surrounded by mountains, including the White Pine Range to the west and the Schell Creek Range to the east. The elevation of Ruth is 6,000 feet above sea level. The town is located on the western edge of the Great Basin Desert, which is a large area of desert and semi-arid shrubland.
The climate of Ruth is generally dry and hot in the summer months, with temperatures reaching up to 100 degrees Fahrenheit. Winters are cold and dry, with temperatures dropping to below freezing. The average annual precipitation is around 8 inches.
Economy
Ruth’s economy is largely based on mining and tourism. The town is home to several gold and silver mines, which have been in operation since the early 1900s. The mines are still active today and provide employment for many of the town’s residents.
Tourism is also an important part of the local economy. Ruth is a popular destination for outdoor enthusiasts, who come to enjoy the area’s scenic beauty and recreational activities. The town is also home to several historic sites, including the Ruth Mine, which is listed on the National Register of Historic Places.
Demographics
The population of Ruth was estimated to be around 200 people in 2000. The town is predominantly white, with a small Hispanic population. The median household income is around $30,000, and the median age is 44 years.
Ruth is a small, rural town with a close-knit community. The town is home to several churches, a post office, a library, and a few small businesses. The town is served by a volunteer fire department and a volunteer ambulance service.
Ruth is a unique and charming town with a rich history and a vibrant economy. The town’s residents are proud of their heritage and work hard to preserve the town’s unique character. Ruth is a great place to live, work, and visit.
Common Questions
What is Per Capita Income in Ruth?
Per Capita income in Ruth is $30,227.
What is the Median Family Income in Ruth?
Median Family Income in Ruth is $91,220.
What is Inequality or Gini Index in Ruth?
Inequality or Gini Index in Ruth is 0.38.
What is the Total Population of Ruth?
Total Population of Ruth is 189.
What is the Total Male Population of Ruth?
Total Male Population of Ruth is 140.
What is the Total Female Population of Ruth?
Total Female Population of Ruth is 49.
What is the Ratio of Males per 100 Females in Ruth?
There are 285.71 Males per 100 Females in Ruth.
What is the Ratio of Females per 100 Males in Ruth?
There are 35.00 Females per 100 Males in Ruth.
What is the Median Population Age in Ruth?
Median Population Age in Ruth is 67.4 Years.
What is the Average Family Size in Ruth
Average Family Size in Ruth is 2.4 People.
What is the Average Household Size in Ruth
Average Household Size in Ruth is 1.6 People.
How Large is the Labor Force in Ruth?
There are 83 People in the Labor Forcein in Ruth.
What is the Percentage of People in the Labor Force in Ruth?
43.9% of People are in the Labor Force in Ruth.
What is the Unemployment Rate in Ruth?
Unemployment Rate in Ruth is 27.7%.