Zip Codes with the Highest Percentage of Population with a Degree in Psychology in Louisiana
RELATED REPORTS & OPTIONS
Psychology
Louisiana
Compare Zip Codes
Map of Zip Codes with the Highest Percentage of Population with a Degree in Psychology in Louisiana
0.0%
100.0%
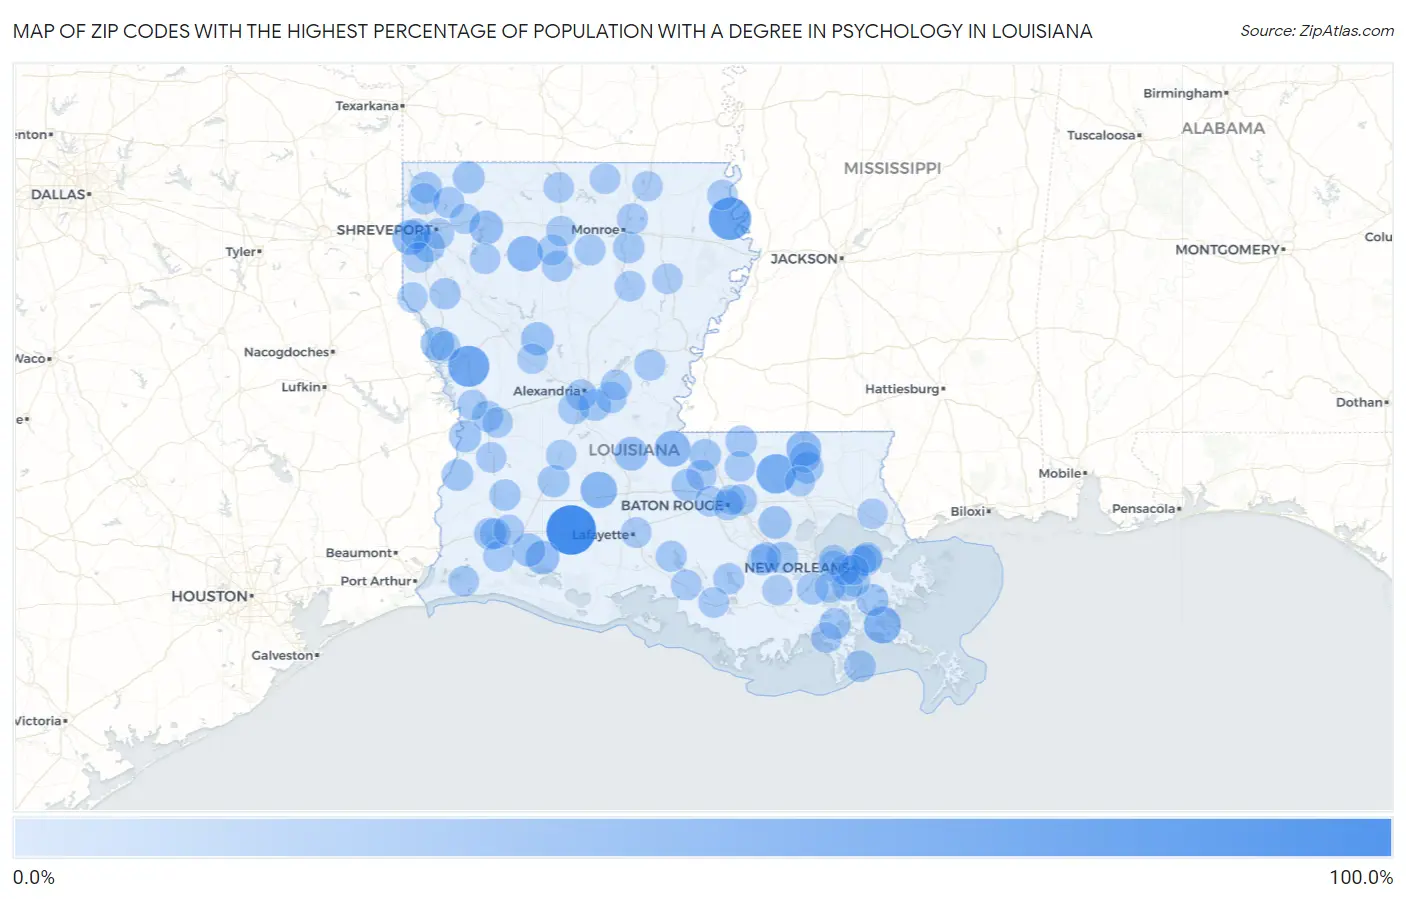
Zip Codes with the Highest Percentage of Population with a Degree in Psychology in Louisiana
| Zip Code | % Graduates | vs State | vs National | |
| 1. | 70537 | 100.0% | 4.6% (+95.4)#1 | 5.1% (+94.9)#15 |
| 2. | 71276 | 64.1% | 4.6% (+59.5)#2 | 5.1% (+59.1)#59 |
| 3. | 71426 | 58.3% | 4.6% (+53.7)#3 | 5.1% (+53.3)#72 |
| 4. | 70453 | 50.0% | 4.6% (+45.4)#4 | 5.1% (+44.9)#98 |
| 5. | 70083 | 38.0% | 4.6% (+33.3)#5 | 5.1% (+32.9)#187 |
| 6. | 70524 | 35.7% | 4.6% (+31.1)#6 | 5.1% (+30.7)#210 |
| 7. | 70747 | 33.3% | 4.6% (+28.7)#7 | 5.1% (+28.3)#246 |
| 8. | 71008 | 31.2% | 4.6% (+26.6)#8 | 5.1% (+26.2)#279 |
| 9. | 70465 | 28.6% | 4.6% (+23.9)#9 | 5.1% (+23.5)#324 |
| 10. | 71033 | 28.5% | 4.6% (+23.9)#10 | 5.1% (+23.5)#330 |
| 11. | 71073 | 22.9% | 4.6% (+18.2)#11 | 5.1% (+17.8)#499 |
| 12. | 71356 | 22.6% | 4.6% (+18.0)#12 | 5.1% (+17.6)#508 |
| 13. | 70549 | 22.5% | 4.6% (+17.8)#13 | 5.1% (+17.4)#523 |
| 14. | 71462 | 21.8% | 4.6% (+17.2)#14 | 5.1% (+16.8)#556 |
| 15. | 71454 | 20.0% | 4.6% (+15.4)#15 | 5.1% (+14.9)#650 |
| 16. | 70646 | 20.0% | 4.6% (+15.4)#16 | 5.1% (+14.9)#657 |
| 17. | 70733 | 17.7% | 4.6% (+13.1)#17 | 5.1% (+12.7)#825 |
| 18. | 70639 | 15.6% | 4.6% (+11.0)#18 | 5.1% (+10.6)#1,053 |
| 19. | 71071 | 14.4% | 4.6% (+9.72)#19 | 5.1% (+9.32)#1,215 |
| 20. | 70755 | 14.1% | 4.6% (+9.50)#20 | 5.1% (+9.10)#1,261 |
| 21. | 70655 | 14.0% | 4.6% (+9.40)#21 | 5.1% (+8.99)#1,277 |
| 22. | 71118 | 14.0% | 4.6% (+9.33)#22 | 5.1% (+8.92)#1,283 |
| 23. | 70422 | 13.8% | 4.6% (+9.17)#23 | 5.1% (+8.77)#1,311 |
| 24. | 70775 | 13.8% | 4.6% (+9.16)#24 | 5.1% (+8.75)#1,313 |
| 25. | 70669 | 13.5% | 4.6% (+8.87)#25 | 5.1% (+8.47)#1,373 |
| 26. | 70040 | 13.5% | 4.6% (+8.87)#26 | 5.1% (+8.46)#1,375 |
| 27. | 71302 | 13.5% | 4.6% (+8.86)#27 | 5.1% (+8.46)#1,380 |
| 28. | 70653 | 13.2% | 4.6% (+8.56)#28 | 5.1% (+8.16)#1,436 |
| 29. | 70030 | 12.8% | 4.6% (+8.10)#29 | 5.1% (+7.70)#1,532 |
| 30. | 70789 | 12.5% | 4.6% (+7.85)#30 | 5.1% (+7.45)#1,587 |
| 31. | 71029 | 12.5% | 4.6% (+7.85)#31 | 5.1% (+7.45)#1,601 |
| 32. | 70358 | 12.2% | 4.6% (+7.57)#32 | 5.1% (+7.16)#1,668 |
| 33. | 71202 | 11.8% | 4.6% (+7.15)#33 | 5.1% (+6.74)#1,790 |
| 34. | 70071 | 11.5% | 4.6% (+6.86)#34 | 5.1% (+6.46)#1,873 |
| 35. | 70657 | 11.4% | 4.6% (+6.80)#35 | 5.1% (+6.40)#1,896 |
| 36. | 70814 | 11.4% | 4.6% (+6.72)#36 | 5.1% (+6.32)#1,919 |
| 37. | 71004 | 11.3% | 4.6% (+6.60)#37 | 5.1% (+6.20)#1,958 |
| 38. | 71052 | 11.2% | 4.6% (+6.54)#38 | 5.1% (+6.14)#1,982 |
| 39. | 70345 | 11.1% | 4.6% (+6.50)#39 | 5.1% (+6.09)#1,998 |
| 40. | 71323 | 11.0% | 4.6% (+6.38)#40 | 5.1% (+5.98)#2,052 |
| 41. | 71006 | 10.7% | 4.6% (+6.09)#41 | 5.1% (+5.69)#2,163 |
| 42. | 71485 | 10.6% | 4.6% (+5.97)#42 | 5.1% (+5.57)#2,208 |
| 43. | 70339 | 10.4% | 4.6% (+5.74)#43 | 5.1% (+5.34)#2,295 |
| 44. | 71343 | 10.3% | 4.6% (+5.65)#44 | 5.1% (+5.25)#2,340 |
| 45. | 71301 | 10.2% | 4.6% (+5.56)#45 | 5.1% (+5.16)#2,385 |
| 46. | 71461 | 10.2% | 4.6% (+5.52)#46 | 5.1% (+5.11)#2,411 |
| 47. | 70062 | 10.0% | 4.6% (+5.34)#47 | 5.1% (+4.93)#2,511 |
| 48. | 71251 | 9.8% | 4.6% (+5.19)#48 | 5.1% (+4.79)#2,582 |
| 49. | 70552 | 9.8% | 4.6% (+5.14)#49 | 5.1% (+4.73)#2,616 |
| 50. | 70607 | 9.6% | 4.6% (+4.91)#50 | 5.1% (+4.51)#2,745 |
| 51. | 70601 | 9.4% | 4.6% (+4.75)#51 | 5.1% (+4.35)#2,845 |
| 52. | 71238 | 9.1% | 4.6% (+4.44)#52 | 5.1% (+4.04)#3,052 |
| 53. | 70127 | 9.1% | 4.6% (+4.42)#53 | 5.1% (+4.01)#3,094 |
| 54. | 71203 | 8.9% | 4.6% (+4.23)#54 | 5.1% (+3.83)#3,243 |
| 55. | 71268 | 8.9% | 4.6% (+4.22)#55 | 5.1% (+3.82)#3,252 |
| 56. | 71104 | 8.7% | 4.6% (+4.03)#56 | 5.1% (+3.63)#3,433 |
| 57. | 71328 | 8.6% | 4.6% (+3.99)#57 | 5.1% (+3.59)#3,473 |
| 58. | 70514 | 8.5% | 4.6% (+3.83)#58 | 5.1% (+3.42)#3,633 |
| 59. | 70086 | 8.5% | 4.6% (+3.81)#59 | 5.1% (+3.41)#3,651 |
| 60. | 70456 | 8.5% | 4.6% (+3.80)#60 | 5.1% (+3.40)#3,656 |
| 61. | 70615 | 8.4% | 4.6% (+3.77)#61 | 5.1% (+3.37)#3,694 |
| 62. | 71119 | 8.4% | 4.6% (+3.74)#62 | 5.1% (+3.34)#3,723 |
| 63. | 70354 | 8.3% | 4.6% (+3.69)#63 | 5.1% (+3.28)#3,761 |
| 64. | 70631 | 8.1% | 4.6% (+3.49)#64 | 5.1% (+3.09)#3,977 |
| 65. | 70723 | 8.0% | 4.6% (+3.35)#65 | 5.1% (+2.95)#4,128 |
| 66. | 70501 | 8.0% | 4.6% (+3.35)#66 | 5.1% (+2.95)#4,138 |
| 67. | 70392 | 8.0% | 4.6% (+3.33)#67 | 5.1% (+2.92)#4,165 |
| 68. | 70783 | 7.9% | 4.6% (+3.26)#68 | 5.1% (+2.86)#4,249 |
| 69. | 70767 | 7.8% | 4.6% (+3.18)#69 | 5.1% (+2.78)#4,337 |
| 70. | 71068 | 7.8% | 4.6% (+3.17)#70 | 5.1% (+2.76)#4,359 |
| 71. | 70777 | 7.6% | 4.6% (+2.99)#71 | 5.1% (+2.59)#4,590 |
| 72. | 71260 | 7.6% | 4.6% (+2.98)#72 | 5.1% (+2.58)#4,604 |
| 73. | 71459 | 7.6% | 4.6% (+2.97)#73 | 5.1% (+2.57)#4,630 |
| 74. | 70126 | 7.5% | 4.6% (+2.86)#74 | 5.1% (+2.46)#4,800 |
| 75. | 71254 | 7.4% | 4.6% (+2.75)#75 | 5.1% (+2.35)#4,980 |
| 76. | 71418 | 7.4% | 4.6% (+2.73)#76 | 5.1% (+2.33)#5,015 |
| 77. | 71416 | 7.3% | 4.6% (+2.67)#77 | 5.1% (+2.27)#5,100 |
| 78. | 70634 | 7.3% | 4.6% (+2.61)#78 | 5.1% (+2.21)#5,200 |
| 79. | 71270 | 7.3% | 4.6% (+2.61)#79 | 5.1% (+2.20)#5,209 |
| 80. | 71463 | 7.2% | 4.6% (+2.58)#80 | 5.1% (+2.17)#5,246 |
| 81. | 71222 | 7.2% | 4.6% (+2.57)#81 | 5.1% (+2.17)#5,256 |
| 82. | 71047 | 7.2% | 4.6% (+2.53)#82 | 5.1% (+2.12)#5,326 |
| 83. | 70058 | 7.1% | 4.6% (+2.43)#83 | 5.1% (+2.03)#5,497 |
| 84. | 71486 | 6.9% | 4.6% (+2.28)#84 | 5.1% (+1.87)#5,774 |
| 85. | 71295 | 6.8% | 4.6% (+2.18)#85 | 5.1% (+1.78)#5,952 |
| 86. | 71220 | 6.8% | 4.6% (+2.13)#86 | 5.1% (+1.73)#6,050 |
| 87. | 70128 | 6.8% | 4.6% (+2.10)#87 | 5.1% (+1.70)#6,103 |
| 88. | 70072 | 6.7% | 4.6% (+2.08)#88 | 5.1% (+1.68)#6,155 |
| 89. | 71067 | 6.7% | 4.6% (+2.06)#89 | 5.1% (+1.66)#6,199 |
| 90. | 70070 | 6.7% | 4.6% (+2.03)#90 | 5.1% (+1.63)#6,265 |
| 91. | 71049 | 6.6% | 4.6% (+1.97)#91 | 5.1% (+1.57)#6,396 |
| 92. | 70121 | 6.6% | 4.6% (+1.92)#92 | 5.1% (+1.51)#6,525 |
| 93. | 70065 | 6.5% | 4.6% (+1.85)#93 | 5.1% (+1.44)#6,665 |
| 94. | 70301 | 6.5% | 4.6% (+1.83)#94 | 5.1% (+1.42)#6,706 |
| 95. | 71403 | 6.4% | 4.6% (+1.77)#95 | 5.1% (+1.37)#6,842 |
| 96. | 70445 | 6.4% | 4.6% (+1.74)#96 | 5.1% (+1.34)#6,905 |
| 97. | 70801 | 6.4% | 4.6% (+1.74)#97 | 5.1% (+1.33)#6,932 |
| 98. | 70112 | 6.3% | 4.6% (+1.65)#98 | 5.1% (+1.24)#7,149 |
| 99. | 70805 | 6.3% | 4.6% (+1.61)#99 | 5.1% (+1.21)#7,223 |
| 100. | 70443 | 6.3% | 4.6% (+1.61)#100 | 5.1% (+1.21)#7,232 |
Common Questions
What are the Top 10 Zip Codes with the Highest Percentage of Population with a Degree in Psychology in Louisiana?
Top 10 Zip Codes with the Highest Percentage of Population with a Degree in Psychology in Louisiana are:
What zip code has the Highest Percentage of Population with a Degree in Psychology in Louisiana?
70537 has the Highest Percentage of Population with a Degree in Psychology in Louisiana with 100.0%.
What is the Percentage of Population with a Degree in Psychology in the State of Louisiana?
Percentage of Population with a Degree in Psychology in Louisiana is 4.6%.
What is the Percentage of Population with a Degree in Psychology in the United States?
Percentage of Population with a Degree in Psychology in the United States is 5.1%.