Zip Codes with the Highest Percentage of Population Employed in Firefighting & Prevention in Wichita, KS
RELATED REPORTS & OPTIONS
Firefighting & Prevention
Wichita
Compare Zip Codes
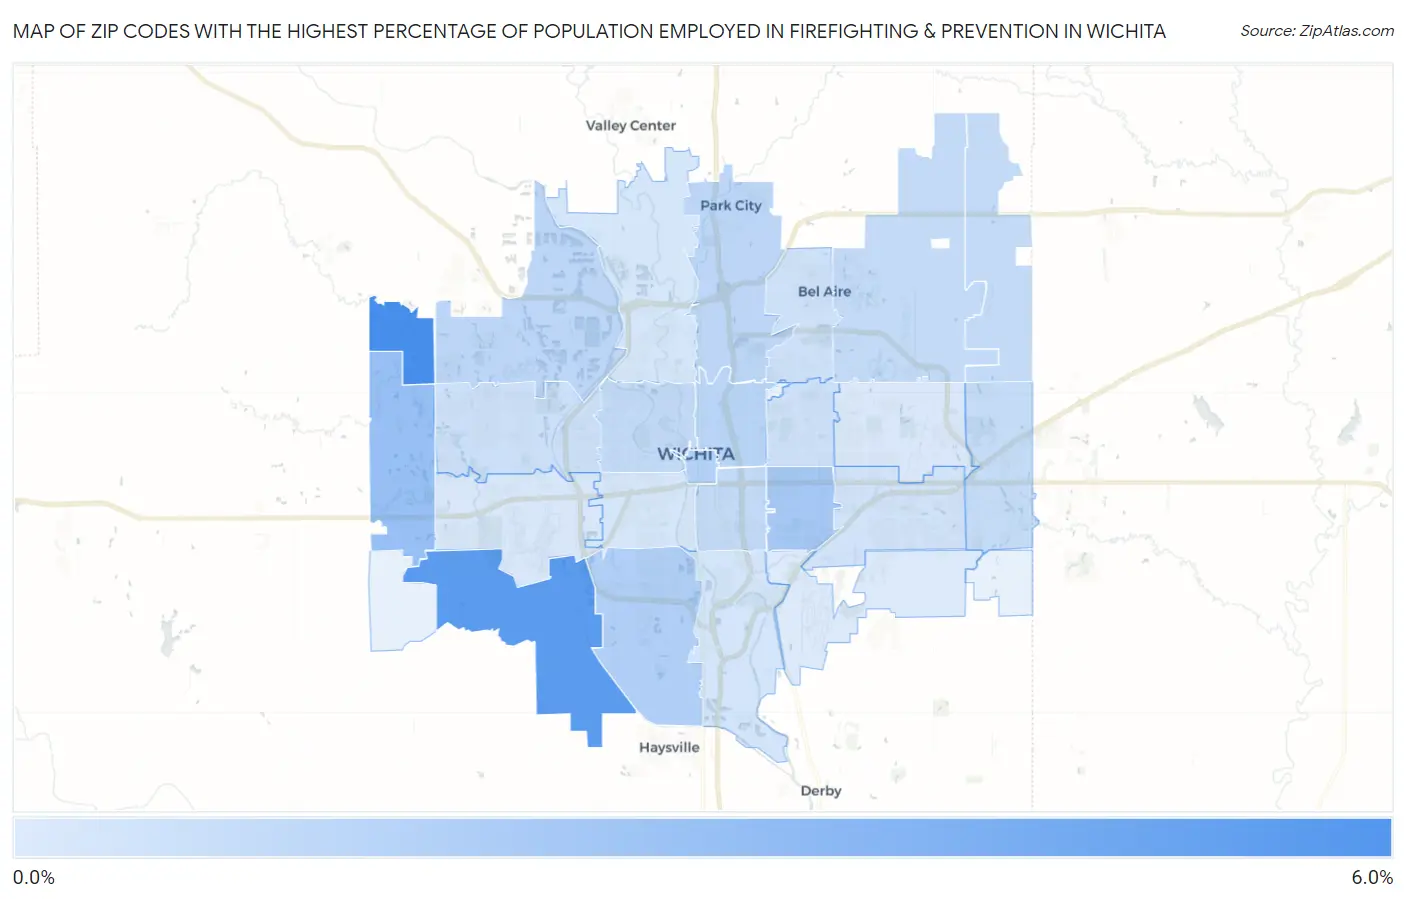
Map of Zip Codes with the Highest Percentage of Population Employed in Firefighting & Prevention in Wichita
0.11%
5.4%
Zip Codes with the Highest Percentage of Population Employed in Firefighting & Prevention in Wichita, KS
| Zip Code | % Employed | vs State | vs National | |
| 1. | 67223 | 5.4% | 0.87%(+4.58)#9 | 1.2%(+4.26)#779 |
| 2. | 67215 | 4.7% | 0.87%(+3.84)#14 | 1.2%(+3.52)#1,022 |
| 3. | 67235 | 2.5% | 0.87%(+1.67)#45 | 1.2%(+1.35)#3,024 |
| 4. | 67218 | 2.0% | 0.87%(+1.17)#69 | 1.2%(+0.855)#4,364 |
| 5. | 67217 | 1.6% | 0.87%(+0.756)#87 | 1.2%(+0.436)#6,261 |
| 6. | 67202 | 1.6% | 0.87%(+0.688)#93 | 1.2%(+0.369)#6,627 |
| 7. | 67214 | 1.3% | 0.87%(+0.455)#114 | 1.2%(+0.135)#8,195 |
| 8. | 67205 | 1.3% | 0.87%(+0.408)#117 | 1.2%(+0.089)#8,554 |
| 9. | 67219 | 1.2% | 0.87%(+0.377)#121 | 1.2%(+0.057)#8,795 |
| 10. | 67228 | 1.0% | 0.87%(+0.161)#151 | 1.2%(-0.159)#10,811 |
| 11. | 67226 | 1.0% | 0.87%(+0.147)#153 | 1.2%(-0.172)#10,943 |
| 12. | 67203 | 1.0% | 0.87%(+0.144)#154 | 1.2%(-0.176)#10,998 |
| 13. | 67211 | 0.98% | 0.87%(+0.115)#160 | 1.2%(-0.205)#11,283 |
| 14. | 67230 | 0.88% | 0.87%(+0.017)#174 | 1.2%(-0.303)#12,341 |
| 15. | 67212 | 0.67% | 0.87%(-0.198)#203 | 1.2%(-0.518)#14,691 |
| 16. | 67208 | 0.58% | 0.87%(-0.288)#222 | 1.2%(-0.608)#15,657 |
| 17. | 67220 | 0.55% | 0.87%(-0.312)#226 | 1.2%(-0.631)#15,910 |
| 18. | 67207 | 0.54% | 0.87%(-0.323)#229 | 1.2%(-0.643)#16,031 |
| 19. | 67216 | 0.43% | 0.87%(-0.434)#259 | 1.2%(-0.754)#17,306 |
| 20. | 67213 | 0.39% | 0.87%(-0.475)#266 | 1.2%(-0.795)#17,755 |
| 21. | 67204 | 0.37% | 0.87%(-0.491)#269 | 1.2%(-0.811)#17,942 |
| 22. | 67209 | 0.30% | 0.87%(-0.567)#291 | 1.2%(-0.886)#18,772 |
| 23. | 67206 | 0.20% | 0.87%(-0.662)#304 | 1.2%(-0.982)#19,648 |
| 24. | 67210 | 0.11% | 0.87%(-0.754)#315 | 1.2%(-1.07)#20,254 |
1
Common Questions
What are the Top 10 Zip Codes with the Highest Percentage of Population Employed in Firefighting & Prevention in Wichita, KS?
Top 10 Zip Codes with the Highest Percentage of Population Employed in Firefighting & Prevention in Wichita, KS are:
What zip code has the Highest Percentage of Population Employed in Firefighting & Prevention in Wichita, KS?
67223 has the Highest Percentage of Population Employed in Firefighting & Prevention in Wichita, KS with 5.4%.
What is the Percentage of Population Employed in Firefighting & Prevention in Wichita, KS?
Percentage of Population Employed in Firefighting & Prevention in Wichita is 1.1%.
What is the Percentage of Population Employed in Firefighting & Prevention in Kansas?
Percentage of Population Employed in Firefighting & Prevention in Kansas is 0.87%.
What is the Percentage of Population Employed in Firefighting & Prevention in the United States?
Percentage of Population Employed in Firefighting & Prevention in the United States is 1.2%.