Moroccan vs African Disability Age 5 to 17
COMPARE
Moroccan
African
Disability Age 5 to 17
Disability Age 5 to 17 Comparison
Moroccans
Africans
5.7%
DISABILITY AGE 5 TO 17
10.4/ 100
METRIC RATING
207th/ 347
METRIC RANK
6.5%
DISABILITY AGE 5 TO 17
0.0/ 100
METRIC RATING
320th/ 347
METRIC RANK
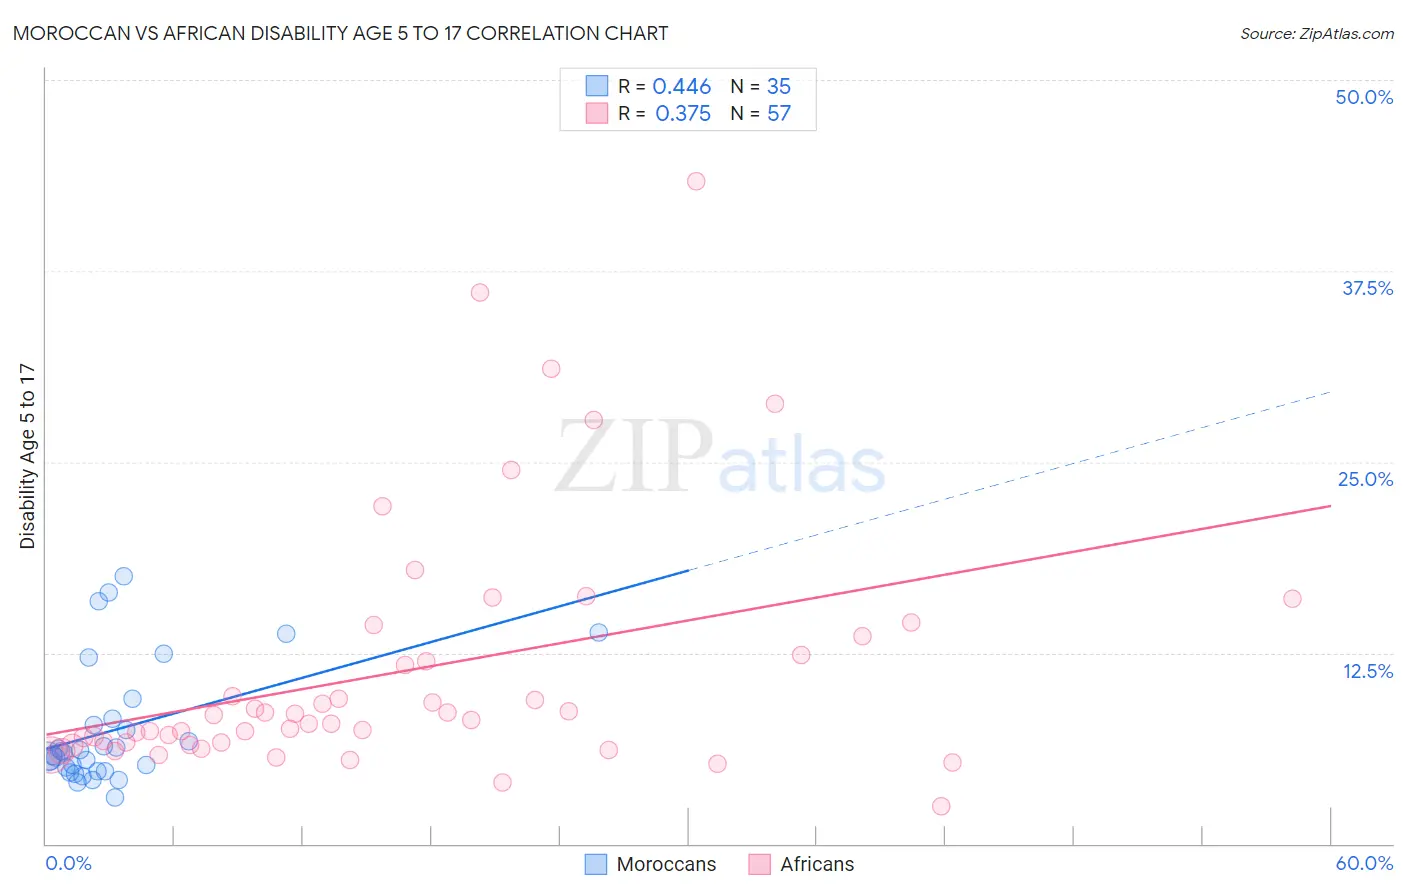
Moroccan vs African Disability Age 5 to 17 Correlation Chart
The statistical analysis conducted on geographies consisting of 201,086,973 people shows a moderate positive correlation between the proportion of Moroccans and percentage of population with a disability between the ages 5 and 17 in the United States with a correlation coefficient (R) of 0.446 and weighted average of 5.7%. Similarly, the statistical analysis conducted on geographies consisting of 465,699,763 people shows a mild positive correlation between the proportion of Africans and percentage of population with a disability between the ages 5 and 17 in the United States with a correlation coefficient (R) of 0.375 and weighted average of 6.5%, a difference of 13.0%.
Disability Age 5 to 17 Correlation Summary
| Measurement | Moroccan | African |
| Minimum | 3.0% | 2.5% |
| Maximum | 17.5% | 43.3% |
| Range | 14.5% | 40.9% |
| Mean | 7.5% | 11.3% |
| Median | 6.0% | 8.1% |
| Interquartile 25% (IQ1) | 4.8% | 6.5% |
| Interquartile 75% (IQ3) | 8.2% | 13.0% |
| Interquartile Range (IQR) | 3.4% | 6.5% |
| Standard Deviation (Sample) | 3.9% | 8.3% |
| Standard Deviation (Population) | 3.9% | 8.2% |
Similar Demographics by Disability Age 5 to 17
Demographics Similar to Moroccans by Disability Age 5 to 17
In terms of disability age 5 to 17, the demographic groups most similar to Moroccans are Trinidadian and Tobagonian (5.7%, a difference of 0.050%), Immigrants from Africa (5.7%, a difference of 0.050%), Kenyan (5.8%, a difference of 0.050%), Immigrants from Uganda (5.8%, a difference of 0.090%), and Paiute (5.7%, a difference of 0.10%).
| Demographics | Rating | Rank | Disability Age 5 to 17 |
| Icelanders | 14.6 /100 | #200 | Poor 5.7% |
| Basques | 13.7 /100 | #201 | Poor 5.7% |
| Austrians | 13.2 /100 | #202 | Poor 5.7% |
| Spanish American Indians | 12.8 /100 | #203 | Poor 5.7% |
| Paiute | 11.2 /100 | #204 | Poor 5.7% |
| Trinidadians and Tobagonians | 10.8 /100 | #205 | Poor 5.7% |
| Immigrants | Africa | 10.8 /100 | #206 | Poor 5.7% |
| Moroccans | 10.4 /100 | #207 | Poor 5.7% |
| Kenyans | 10.0 /100 | #208 | Poor 5.8% |
| Immigrants | Uganda | 9.7 /100 | #209 | Tragic 5.8% |
| Immigrants | Haiti | 9.5 /100 | #210 | Tragic 5.8% |
| Yugoslavians | 9.1 /100 | #211 | Tragic 5.8% |
| Immigrants | Panama | 8.7 /100 | #212 | Tragic 5.8% |
| Immigrants | Cameroon | 8.3 /100 | #213 | Tragic 5.8% |
| Immigrants | Morocco | 8.3 /100 | #214 | Tragic 5.8% |
Demographics Similar to Africans by Disability Age 5 to 17
In terms of disability age 5 to 17, the demographic groups most similar to Africans are Delaware (6.5%, a difference of 0.19%), Tohono O'odham (6.5%, a difference of 0.35%), Slovak (6.5%, a difference of 0.36%), Osage (6.5%, a difference of 0.40%), and Dominican (6.5%, a difference of 0.48%).
| Demographics | Rating | Rank | Disability Age 5 to 17 |
| Apache | 0.0 /100 | #313 | Tragic 6.4% |
| French | 0.0 /100 | #314 | Tragic 6.4% |
| Immigrants | Portugal | 0.0 /100 | #315 | Tragic 6.4% |
| Immigrants | Dominican Republic | 0.0 /100 | #316 | Tragic 6.4% |
| Kiowa | 0.0 /100 | #317 | Tragic 6.4% |
| Comanche | 0.0 /100 | #318 | Tragic 6.4% |
| Delaware | 0.0 /100 | #319 | Tragic 6.5% |
| Africans | 0.0 /100 | #320 | Tragic 6.5% |
| Tohono O'odham | 0.0 /100 | #321 | Tragic 6.5% |
| Slovaks | 0.0 /100 | #322 | Tragic 6.5% |
| Osage | 0.0 /100 | #323 | Tragic 6.5% |
| Dominicans | 0.0 /100 | #324 | Tragic 6.5% |
| Americans | 0.0 /100 | #325 | Tragic 6.5% |
| Potawatomi | 0.0 /100 | #326 | Tragic 6.5% |
| French American Indians | 0.0 /100 | #327 | Tragic 6.6% |