Immigrants from Western Africa vs Bermudan Disability Age 5 to 17
COMPARE
Immigrants from Western Africa
Bermudan
Disability Age 5 to 17
Disability Age 5 to 17 Comparison
Immigrants from Western Africa
Bermudans
5.9%
DISABILITY AGE 5 TO 17
0.7/ 100
METRIC RATING
262nd/ 347
METRIC RANK
6.4%
DISABILITY AGE 5 TO 17
0.0/ 100
METRIC RATING
312th/ 347
METRIC RANK
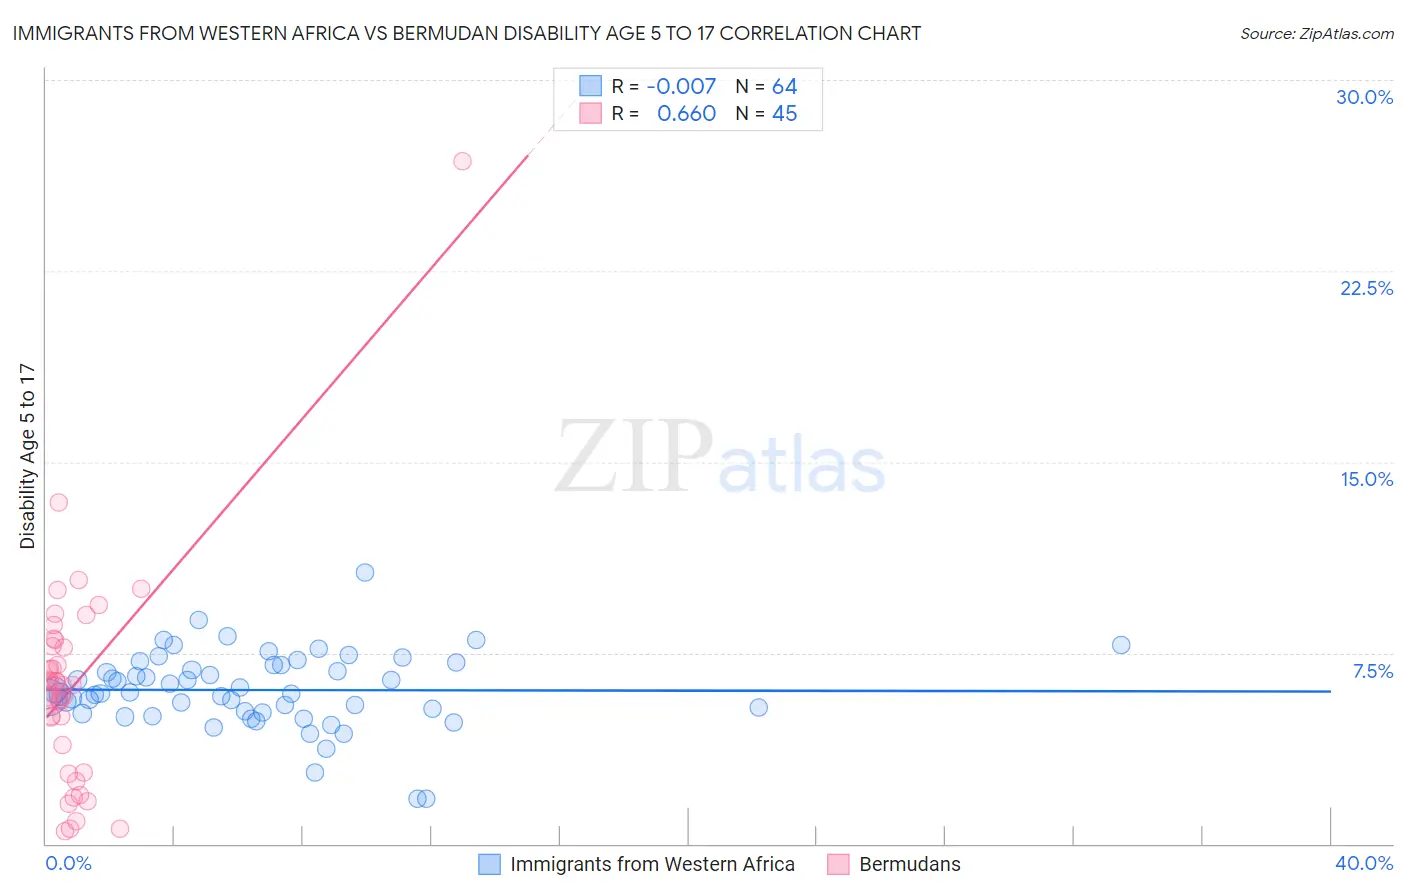
Immigrants from Western Africa vs Bermudan Disability Age 5 to 17 Correlation Chart
The statistical analysis conducted on geographies consisting of 355,657,853 people shows no correlation between the proportion of Immigrants from Western Africa and percentage of population with a disability between the ages 5 and 17 in the United States with a correlation coefficient (R) of -0.007 and weighted average of 5.9%. Similarly, the statistical analysis conducted on geographies consisting of 55,645,998 people shows a significant positive correlation between the proportion of Bermudans and percentage of population with a disability between the ages 5 and 17 in the United States with a correlation coefficient (R) of 0.660 and weighted average of 6.4%, a difference of 7.0%.
Disability Age 5 to 17 Correlation Summary
| Measurement | Immigrants from Western Africa | Bermudan |
| Minimum | 1.7% | 0.50% |
| Maximum | 10.7% | 26.8% |
| Range | 8.9% | 26.3% |
| Mean | 6.0% | 6.2% |
| Median | 5.9% | 6.2% |
| Interquartile 25% (IQ1) | 5.2% | 3.3% |
| Interquartile 75% (IQ3) | 7.0% | 7.9% |
| Interquartile Range (IQR) | 1.8% | 4.5% |
| Standard Deviation (Sample) | 1.5% | 4.3% |
| Standard Deviation (Population) | 1.5% | 4.3% |
Similar Demographics by Disability Age 5 to 17
Demographics Similar to Immigrants from Western Africa by Disability Age 5 to 17
In terms of disability age 5 to 17, the demographic groups most similar to Immigrants from Western Africa are Immigrants from Middle Africa (5.9%, a difference of 0.030%), Czechoslovakian (5.9%, a difference of 0.080%), Somali (5.9%, a difference of 0.10%), Canadian (6.0%, a difference of 0.20%), and Slavic (5.9%, a difference of 0.23%).
| Demographics | Rating | Rank | Disability Age 5 to 17 |
| Italians | 1.2 /100 | #255 | Tragic 5.9% |
| Hopi | 1.0 /100 | #256 | Tragic 5.9% |
| Hispanics or Latinos | 1.0 /100 | #257 | Tragic 5.9% |
| Brazilians | 0.9 /100 | #258 | Tragic 5.9% |
| Slavs | 0.9 /100 | #259 | Tragic 5.9% |
| Somalis | 0.8 /100 | #260 | Tragic 5.9% |
| Immigrants | Middle Africa | 0.7 /100 | #261 | Tragic 5.9% |
| Immigrants | Western Africa | 0.7 /100 | #262 | Tragic 5.9% |
| Czechoslovakians | 0.7 /100 | #263 | Tragic 5.9% |
| Canadians | 0.6 /100 | #264 | Tragic 6.0% |
| Panamanians | 0.6 /100 | #265 | Tragic 6.0% |
| Slovenes | 0.6 /100 | #266 | Tragic 6.0% |
| Spanish | 0.5 /100 | #267 | Tragic 6.0% |
| Sioux | 0.4 /100 | #268 | Tragic 6.0% |
| Liberians | 0.4 /100 | #269 | Tragic 6.0% |
Demographics Similar to Bermudans by Disability Age 5 to 17
In terms of disability age 5 to 17, the demographic groups most similar to Bermudans are Immigrants from Dominica (6.3%, a difference of 0.12%), Alaskan Athabascan (6.3%, a difference of 0.16%), Hmong (6.3%, a difference of 0.29%), Scotch-Irish (6.3%, a difference of 0.32%), and Apache (6.4%, a difference of 0.38%).
| Demographics | Rating | Rank | Disability Age 5 to 17 |
| Natives/Alaskans | 0.0 /100 | #305 | Tragic 6.3% |
| Immigrants | Nonimmigrants | 0.0 /100 | #306 | Tragic 6.3% |
| Bahamians | 0.0 /100 | #307 | Tragic 6.3% |
| Scotch-Irish | 0.0 /100 | #308 | Tragic 6.3% |
| Hmong | 0.0 /100 | #309 | Tragic 6.3% |
| Alaskan Athabascans | 0.0 /100 | #310 | Tragic 6.3% |
| Immigrants | Dominica | 0.0 /100 | #311 | Tragic 6.3% |
| Bermudans | 0.0 /100 | #312 | Tragic 6.4% |
| Apache | 0.0 /100 | #313 | Tragic 6.4% |
| French | 0.0 /100 | #314 | Tragic 6.4% |
| Immigrants | Portugal | 0.0 /100 | #315 | Tragic 6.4% |
| Immigrants | Dominican Republic | 0.0 /100 | #316 | Tragic 6.4% |
| Kiowa | 0.0 /100 | #317 | Tragic 6.4% |
| Comanche | 0.0 /100 | #318 | Tragic 6.4% |
| Delaware | 0.0 /100 | #319 | Tragic 6.5% |