Immigrants from Ireland 1 or more Vehicles in Household
COMPARE
Immigrants from Ireland
Select to Compare
1 or more Vehicles in Household
Immigrants from Ireland 1 or more Vehicles in Household
86.4%
1+ VEHICLES AVAILABLE
0.0/ 100
METRIC RATING
289th/ 347
METRIC RANK
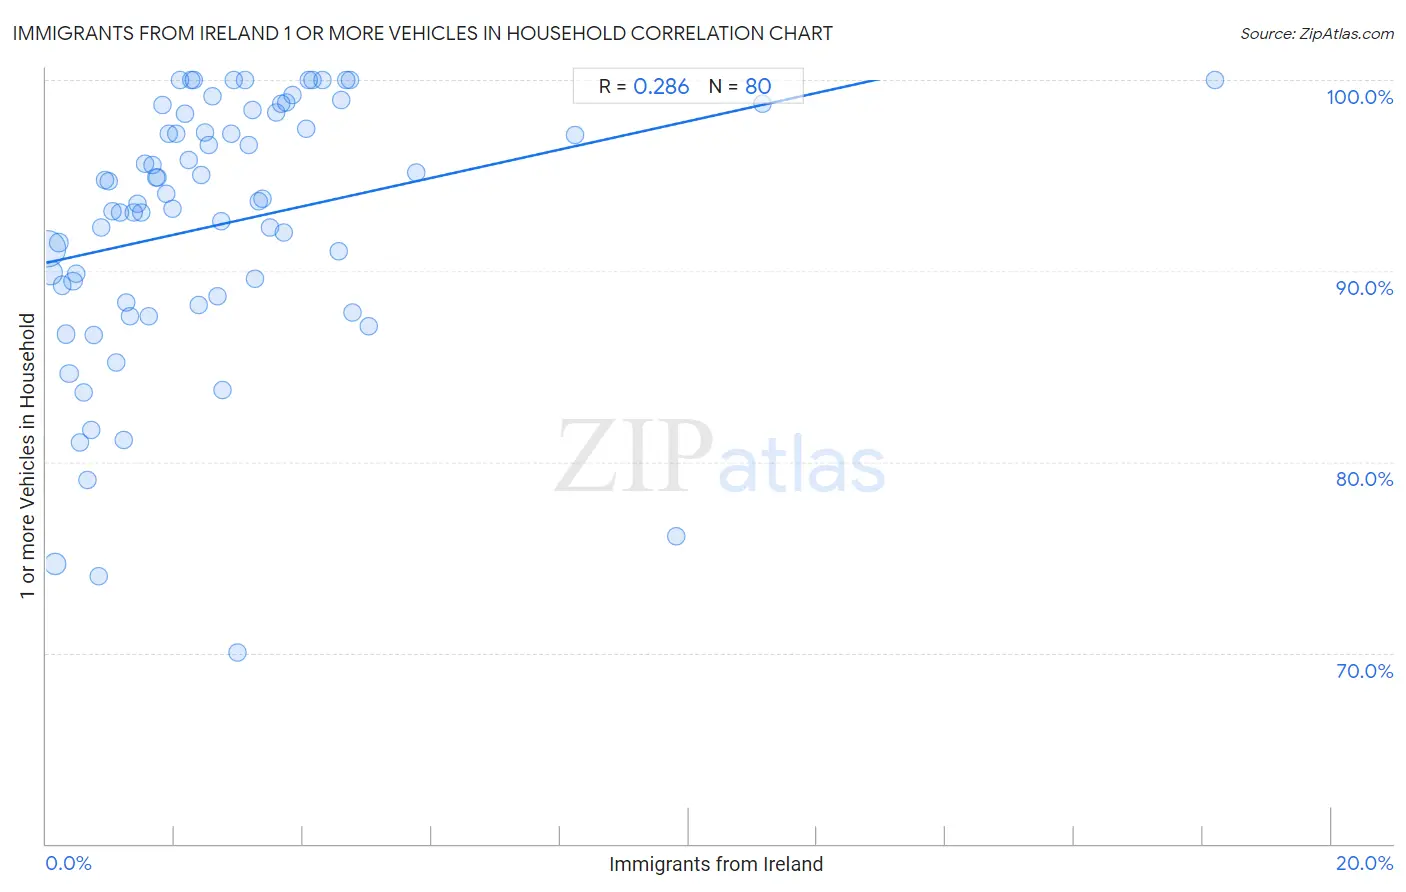
Immigrants from Ireland 1 or more Vehicles in Household Correlation Chart
The statistical analysis conducted on geographies consisting of 240,751,818 people shows a weak positive correlation between the proportion of Immigrants from Ireland and percentage of households with 1 or more vehicles available in the United States with a correlation coefficient (R) of 0.286 and weighted average of 86.4%. On average, for every 1% (one percent) increase in Immigrants from Ireland within a typical geography, there is an increase of 0.74% in percentage of households with 1 or more vehicles available.
It is essential to understand that the correlation between the percentage of Immigrants from Ireland and percentage of households with 1 or more vehicles available does not imply a direct cause-and-effect relationship. It remains uncertain whether the presence of Immigrants from Ireland influences an upward or downward trend in the level of percentage of households with 1 or more vehicles available within an area, or if Immigrants from Ireland simply ended up residing in those areas with higher or lower levels of percentage of households with 1 or more vehicles available due to other factors.
Demographics Similar to Immigrants from Ireland by 1 or more Vehicles in Household
In terms of 1 or more vehicles in household, the demographic groups most similar to Immigrants from Ireland are Hopi (86.4%, a difference of 0.020%), Immigrants from Australia (86.4%, a difference of 0.040%), Immigrants from Malaysia (86.5%, a difference of 0.090%), Pima (86.3%, a difference of 0.12%), and Immigrants from Eastern Asia (86.5%, a difference of 0.16%).
| Demographics | Rating | Rank | 1 or more Vehicles in Household |
| Colville | 0.0 /100 | #282 | Tragic 86.8% |
| Immigrants from Eastern Europe | 0.0 /100 | #283 | Tragic 86.7% |
| Central American Indians | 0.0 /100 | #284 | Tragic 86.7% |
| Immigrants from Kazakhstan | 0.0 /100 | #285 | Tragic 86.6% |
| Immigrants from Eastern Asia | 0.0 /100 | #286 | Tragic 86.5% |
| Immigrants from Malaysia | 0.0 /100 | #287 | Tragic 86.5% |
| Hopi | 0.0 /100 | #288 | Tragic 86.4% |
| Immigrants from Ireland | 0.0 /100 | #289 | Tragic 86.4% |
| Immigrants from Australia | 0.0 /100 | #290 | Tragic 86.4% |
| Pima | 0.0 /100 | #291 | Tragic 86.3% |
| Okinawans | 0.0 /100 | #292 | Tragic 86.1% |
| Indians (Asian) | 0.0 /100 | #293 | Tragic 86.0% |
| Alaskan Athabascans | 0.0 /100 | #294 | Tragic 86.0% |
| Immigrants from Jamaica | 0.0 /100 | #295 | Tragic 85.8% |
| Immigrants from Spain | 0.0 /100 | #296 | Tragic 85.8% |
Immigrants from Ireland 1 or more Vehicles in Household Correlation Summary
| Measurement | Immigrants from Ireland Data | 1 or more Vehicles in Household Data |
| Minimum | 0.024% | 70.0% |
| Maximum | 18.2% | 100.0% |
| Range | 18.2% | 30.0% |
| Mean | 2.7% | 92.4% |
| Median | 2.2% | 93.7% |
| Interquartile 25% (IQ1) | 1.1% | 88.5% |
| Interquartile 75% (IQ3) | 3.5% | 98.3% |
| Interquartile Range (IQR) | 2.4% | 9.8% |
| Standard Deviation (Sample) | 2.7% | 6.9% |
| Standard Deviation (Population) | 2.6% | 6.9% |
Correlation Details
| Immigrants from Ireland Percentile | Sample Size | 1 or more Vehicles in Household |
[ 0.0% - 0.5% ] 0.024% | 144,623,470 | 91.1% |
[ 0.0% - 0.5% ] 0.080% | 41,675,095 | 89.9% |
[ 0.0% - 0.5% ] 0.14% | 25,967,044 | 74.7% |
[ 0.0% - 0.5% ] 0.19% | 8,531,222 | 91.5% |
[ 0.0% - 0.5% ] 0.25% | 5,248,992 | 89.2% |
[ 0.0% - 0.5% ] 0.31% | 3,738,958 | 86.7% |
[ 0.0% - 0.5% ] 0.36% | 2,729,924 | 84.6% |
[ 0.0% - 0.5% ] 0.42% | 1,432,812 | 89.5% |
[ 0.0% - 0.5% ] 0.47% | 1,137,813 | 89.8% |
[ 0.5% - 1.0% ] 0.52% | 841,655 | 81.0% |
[ 0.5% - 1.0% ] 0.58% | 896,187 | 83.7% |
[ 0.5% - 1.0% ] 0.63% | 627,539 | 79.1% |
[ 0.5% - 1.0% ] 0.70% | 379,126 | 81.7% |
[ 0.5% - 1.0% ] 0.75% | 442,740 | 86.6% |
[ 0.5% - 1.0% ] 0.81% | 389,912 | 74.0% |
[ 0.5% - 1.0% ] 0.86% | 351,625 | 92.3% |
[ 0.5% - 1.0% ] 0.92% | 83,281 | 94.7% |
[ 0.5% - 1.0% ] 0.97% | 118,500 | 94.7% |
[ 1.0% - 1.5% ] 1.04% | 143,553 | 93.1% |
[ 1.0% - 1.5% ] 1.08% | 265,114 | 85.2% |
[ 1.0% - 1.5% ] 1.16% | 75,662 | 93.0% |
[ 1.0% - 1.5% ] 1.21% | 288,396 | 81.2% |
[ 1.0% - 1.5% ] 1.24% | 99,410 | 88.3% |
[ 1.0% - 1.5% ] 1.30% | 86,599 | 87.6% |
[ 1.0% - 1.5% ] 1.37% | 58,038 | 93.1% |
[ 1.0% - 1.5% ] 1.42% | 28,596 | 93.5% |
[ 1.0% - 1.5% ] 1.47% | 47,192 | 93.0% |
[ 1.5% - 2.0% ] 1.54% | 57,181 | 95.6% |
[ 1.5% - 2.0% ] 1.59% | 19,334 | 87.6% |
[ 1.5% - 2.0% ] 1.65% | 13,221 | 95.6% |
[ 1.5% - 2.0% ] 1.71% | 16,804 | 94.9% |
[ 1.5% - 2.0% ] 1.74% | 39,141 | 94.9% |
[ 1.5% - 2.0% ] 1.81% | 5,808 | 98.7% |
[ 1.5% - 2.0% ] 1.86% | 30,627 | 94.1% |
[ 1.5% - 2.0% ] 1.91% | 29,672 | 97.2% |
[ 1.5% - 2.0% ] 1.96% | 9,062 | 93.3% |
[ 2.0% - 2.5% ] 2.03% | 1,528 | 97.2% |
[ 2.0% - 2.5% ] 2.08% | 6,503 | 100.0% |
[ 2.0% - 2.5% ] 2.15% | 1,811 | 98.3% |
[ 2.0% - 2.5% ] 2.22% | 3,247 | 95.8% |
[ 2.0% - 2.5% ] 2.25% | 754 | 100.0% |
[ 2.0% - 2.5% ] 2.30% | 304 | 100.0% |
[ 2.0% - 2.5% ] 2.37% | 10,780 | 88.2% |
[ 2.0% - 2.5% ] 2.42% | 4,466 | 95.0% |
[ 2.0% - 2.5% ] 2.48% | 1,493 | 97.2% |
[ 2.5% - 3.0% ] 2.53% | 5,013 | 96.6% |
[ 2.5% - 3.0% ] 2.60% | 6,011 | 99.1% |
[ 2.5% - 3.0% ] 2.66% | 31,720 | 88.7% |
[ 2.5% - 3.0% ] 2.72% | 2,799 | 92.6% |
[ 2.5% - 3.0% ] 2.74% | 7,599 | 83.8% |
[ 2.5% - 3.0% ] 2.89% | 3,809 | 97.2% |
[ 2.5% - 3.0% ] 2.92% | 857 | 100.0% |
[ 2.5% - 3.0% ] 2.97% | 20,439 | 70.0% |
[ 3.0% - 3.5% ] 3.09% | 356 | 100.0% |
[ 3.0% - 3.5% ] 3.16% | 7,729 | 96.6% |
[ 3.0% - 3.5% ] 3.20% | 2,812 | 98.5% |
[ 3.0% - 3.5% ] 3.26% | 768 | 89.6% |
[ 3.0% - 3.5% ] 3.31% | 8,872 | 93.6% |
[ 3.0% - 3.5% ] 3.37% | 297 | 93.8% |
[ 3.0% - 3.5% ] 3.49% | 15,666 | 92.3% |
[ 3.5% - 4.0% ] 3.58% | 2,041 | 98.3% |
[ 3.5% - 4.0% ] 3.65% | 2,987 | 98.7% |
[ 3.5% - 4.0% ] 3.70% | 16,426 | 92.0% |
[ 3.5% - 4.0% ] 3.74% | 3,828 | 98.8% |
[ 3.5% - 4.0% ] 3.83% | 575 | 99.2% |
[ 4.0% - 4.5% ] 4.05% | 8,250 | 97.5% |
[ 4.0% - 4.5% ] 4.09% | 514 | 100.0% |
[ 4.0% - 4.5% ] 4.14% | 893 | 100.0% |
[ 4.0% - 4.5% ] 4.30% | 186 | 100.0% |
[ 4.5% - 5.0% ] 4.55% | 550 | 91.1% |
[ 4.5% - 5.0% ] 4.59% | 2,047 | 98.9% |
[ 4.5% - 5.0% ] 4.67% | 793 | 100.0% |
[ 4.5% - 5.0% ] 4.72% | 254 | 100.0% |
[ 4.5% - 5.0% ] 4.77% | 943 | 87.8% |
[ 5.0% - 5.5% ] 5.01% | 33,059 | 87.1% |
[ 5.5% - 6.0% ] 5.76% | 191 | 95.2% |
[ 8.0% - 8.5% ] 8.24% | 595 | 97.1% |
[ 9.5% - 10.0% ] 9.80% | 153 | 76.1% |
[ 11.0% - 11.5% ] 11.14% | 2,540 | 98.8% |
[ 18.0% - 18.5% ] 18.18% | 55 | 100.0% |