Immigrants from Ireland 4 or more Vehicles in Household
COMPARE
Immigrants from Ireland
Select to Compare
4 or more Vehicles in Household
Immigrants from Ireland 4 or more Vehicles in Household
5.4%
4+ VEHICLES AVAILABLE
0.3/ 100
METRIC RATING
283rd/ 347
METRIC RANK
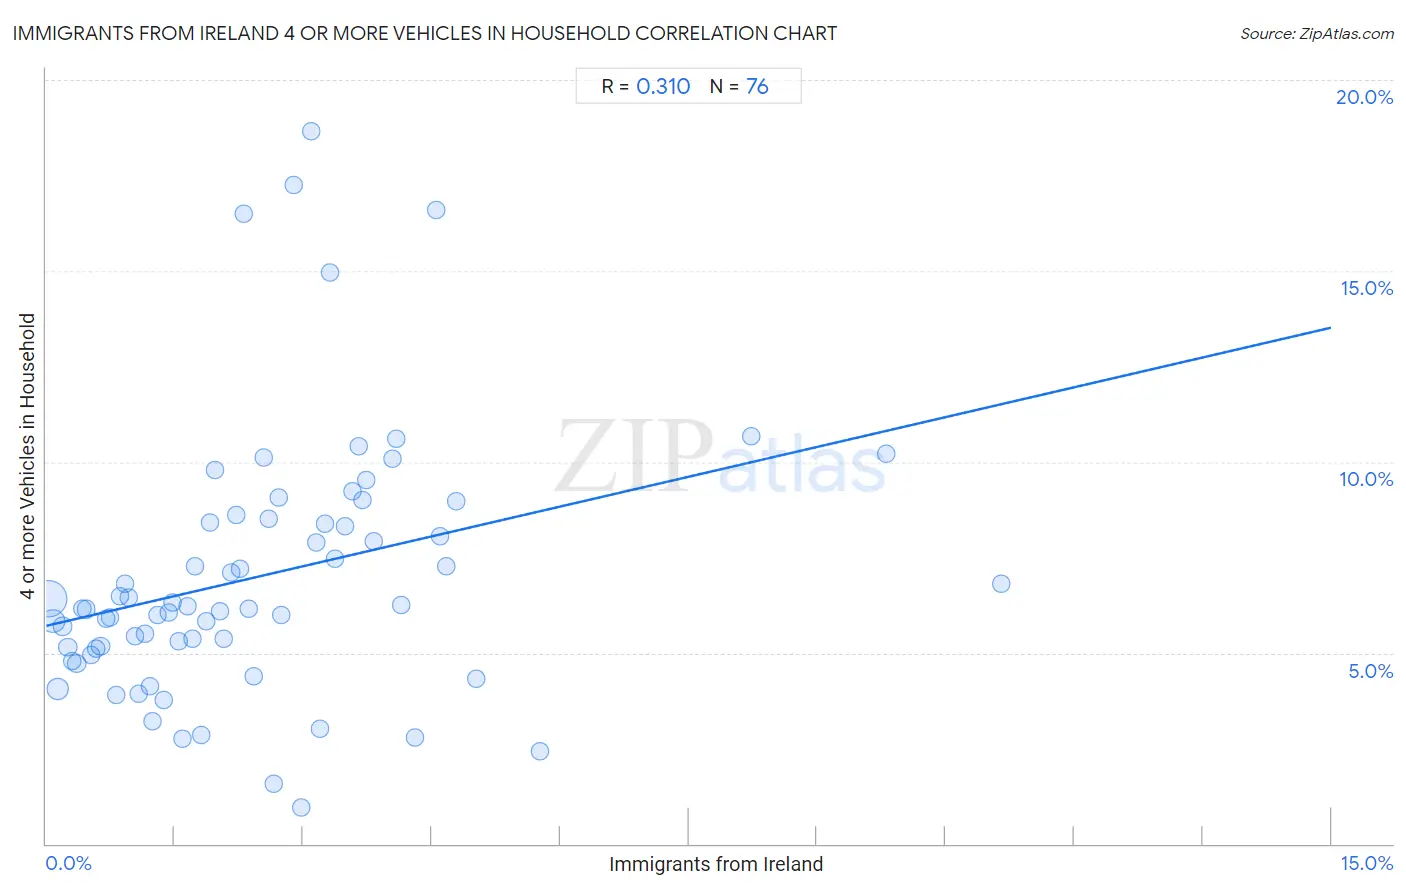
Immigrants from Ireland 4 or more Vehicles in Household Correlation Chart
The statistical analysis conducted on geographies consisting of 239,720,529 people shows a mild positive correlation between the proportion of Immigrants from Ireland and percentage of households with 4 or more vehicles available in the United States with a correlation coefficient (R) of 0.310 and weighted average of 5.4%. On average, for every 1% (one percent) increase in Immigrants from Ireland within a typical geography, there is an increase of 0.52% in percentage of households with 4 or more vehicles available.
It is essential to understand that the correlation between the percentage of Immigrants from Ireland and percentage of households with 4 or more vehicles available does not imply a direct cause-and-effect relationship. It remains uncertain whether the presence of Immigrants from Ireland influences an upward or downward trend in the level of percentage of households with 4 or more vehicles available within an area, or if Immigrants from Ireland simply ended up residing in those areas with higher or lower levels of percentage of households with 4 or more vehicles available due to other factors.
Demographics Similar to Immigrants from Ireland by 4 or more Vehicles in Household
In terms of 4 or more vehicles in household, the demographic groups most similar to Immigrants from Ireland are Immigrants from Spain (5.4%, a difference of 0.080%), Immigrants from Western Africa (5.4%, a difference of 0.25%), Brazilian (5.4%, a difference of 0.29%), Alsatian (5.4%, a difference of 0.32%), and Immigrants from Uruguay (5.4%, a difference of 0.33%).
| Demographics | Rating | Rank | 4 or more Vehicles in Household |
| Immigrants from Latvia | 0.5 /100 | #276 | Tragic 5.5% |
| Immigrants from Bulgaria | 0.5 /100 | #277 | Tragic 5.5% |
| Immigrants from Eastern Europe | 0.4 /100 | #278 | Tragic 5.4% |
| Immigrants from Uruguay | 0.3 /100 | #279 | Tragic 5.4% |
| Alsatians | 0.3 /100 | #280 | Tragic 5.4% |
| Immigrants from Western Africa | 0.3 /100 | #281 | Tragic 5.4% |
| Immigrants from Spain | 0.3 /100 | #282 | Tragic 5.4% |
| Immigrants from Ireland | 0.3 /100 | #283 | Tragic 5.4% |
| Brazilians | 0.3 /100 | #284 | Tragic 5.4% |
| Immigrants from Liberia | 0.2 /100 | #285 | Tragic 5.4% |
| Immigrants from Colombia | 0.2 /100 | #286 | Tragic 5.4% |
| Immigrants from Croatia | 0.2 /100 | #287 | Tragic 5.4% |
| Venezuelans | 0.2 /100 | #288 | Tragic 5.3% |
| Immigrants from Bosnia and Herzegovina | 0.2 /100 | #289 | Tragic 5.3% |
| Immigrants from Russia | 0.2 /100 | #290 | Tragic 5.3% |
Immigrants from Ireland 4 or more Vehicles in Household Correlation Summary
| Measurement | Immigrants from Ireland Data | 4 or more Vehicles in Household Data |
| Minimum | 0.024% | 0.96% |
| Maximum | 11.1% | 18.7% |
| Range | 11.1% | 17.7% |
| Mean | 2.5% | 7.0% |
| Median | 2.1% | 6.2% |
| Interquartile 25% (IQ1) | 1.1% | 5.1% |
| Interquartile 75% (IQ3) | 3.4% | 8.5% |
| Interquartile Range (IQR) | 2.4% | 3.3% |
| Standard Deviation (Sample) | 2.0% | 3.4% |
| Standard Deviation (Population) | 2.0% | 3.4% |
Correlation Details
| Immigrants from Ireland Percentile | Sample Size | 4 or more Vehicles in Household |
[ 0.0% - 0.5% ] 0.024% | 144,398,345 | 6.4% |
[ 0.0% - 0.5% ] 0.080% | 41,375,878 | 5.8% |
[ 0.0% - 0.5% ] 0.14% | 25,754,263 | 4.0% |
[ 0.0% - 0.5% ] 0.19% | 8,491,727 | 5.7% |
[ 0.0% - 0.5% ] 0.25% | 5,217,243 | 5.1% |
[ 0.0% - 0.5% ] 0.31% | 3,709,823 | 4.8% |
[ 0.0% - 0.5% ] 0.36% | 2,729,924 | 4.7% |
[ 0.0% - 0.5% ] 0.42% | 1,428,159 | 6.2% |
[ 0.0% - 0.5% ] 0.47% | 1,089,597 | 6.1% |
[ 0.5% - 1.0% ] 0.52% | 822,465 | 4.9% |
[ 0.5% - 1.0% ] 0.58% | 891,262 | 5.1% |
[ 0.5% - 1.0% ] 0.63% | 622,477 | 5.2% |
[ 0.5% - 1.0% ] 0.70% | 376,504 | 5.9% |
[ 0.5% - 1.0% ] 0.75% | 442,740 | 5.9% |
[ 0.5% - 1.0% ] 0.81% | 313,505 | 3.9% |
[ 0.5% - 1.0% ] 0.86% | 351,625 | 6.5% |
[ 0.5% - 1.0% ] 0.92% | 82,725 | 6.8% |
[ 0.5% - 1.0% ] 0.97% | 114,573 | 6.4% |
[ 1.0% - 1.5% ] 1.04% | 143,553 | 5.4% |
[ 1.0% - 1.5% ] 1.08% | 256,825 | 3.9% |
[ 1.0% - 1.5% ] 1.16% | 75,662 | 5.5% |
[ 1.0% - 1.5% ] 1.21% | 285,170 | 4.1% |
[ 1.0% - 1.5% ] 1.24% | 98,221 | 3.2% |
[ 1.0% - 1.5% ] 1.30% | 86,599 | 6.0% |
[ 1.0% - 1.5% ] 1.37% | 52,769 | 3.8% |
[ 1.0% - 1.5% ] 1.42% | 28,596 | 6.1% |
[ 1.0% - 1.5% ] 1.47% | 45,848 | 6.3% |
[ 1.5% - 2.0% ] 1.54% | 57,181 | 5.3% |
[ 1.5% - 2.0% ] 1.59% | 16,086 | 2.7% |
[ 1.5% - 2.0% ] 1.65% | 13,221 | 6.2% |
[ 1.5% - 2.0% ] 1.71% | 16,804 | 5.4% |
[ 1.5% - 2.0% ] 1.74% | 39,141 | 7.3% |
[ 1.5% - 2.0% ] 1.81% | 5,808 | 2.8% |
[ 1.5% - 2.0% ] 1.86% | 30,627 | 5.8% |
[ 1.5% - 2.0% ] 1.91% | 29,672 | 8.4% |
[ 1.5% - 2.0% ] 1.96% | 9,062 | 9.8% |
[ 2.0% - 2.5% ] 2.03% | 1,528 | 6.1% |
[ 2.0% - 2.5% ] 2.08% | 6,312 | 5.4% |
[ 2.0% - 2.5% ] 2.15% | 1,625 | 7.1% |
[ 2.0% - 2.5% ] 2.22% | 3,247 | 8.6% |
[ 2.0% - 2.5% ] 2.25% | 754 | 7.2% |
[ 2.0% - 2.5% ] 2.30% | 304 | 16.5% |
[ 2.0% - 2.5% ] 2.37% | 10,780 | 6.2% |
[ 2.0% - 2.5% ] 2.42% | 4,466 | 4.4% |
[ 2.5% - 3.0% ] 2.53% | 5,013 | 10.1% |
[ 2.5% - 3.0% ] 2.60% | 6,011 | 8.5% |
[ 2.5% - 3.0% ] 2.66% | 31,720 | 1.6% |
[ 2.5% - 3.0% ] 2.72% | 2,799 | 9.1% |
[ 2.5% - 3.0% ] 2.74% | 7,307 | 6.0% |
[ 2.5% - 3.0% ] 2.89% | 3,809 | 17.3% |
[ 2.5% - 3.0% ] 2.97% | 20,306 | 0.96% |
[ 3.0% - 3.5% ] 3.09% | 356 | 18.7% |
[ 3.0% - 3.5% ] 3.16% | 7,508 | 7.9% |
[ 3.0% - 3.5% ] 3.20% | 2,812 | 3.0% |
[ 3.0% - 3.5% ] 3.26% | 768 | 8.4% |
[ 3.0% - 3.5% ] 3.31% | 8,872 | 14.9% |
[ 3.0% - 3.5% ] 3.37% | 297 | 7.5% |
[ 3.0% - 3.5% ] 3.49% | 15,666 | 8.3% |
[ 3.5% - 4.0% ] 3.58% | 2,041 | 9.2% |
[ 3.5% - 4.0% ] 3.64% | 2,305 | 10.4% |
[ 3.5% - 4.0% ] 3.70% | 16,426 | 9.0% |
[ 3.5% - 4.0% ] 3.74% | 3,828 | 9.5% |
[ 3.5% - 4.0% ] 3.83% | 575 | 7.9% |
[ 4.0% - 4.5% ] 4.05% | 8,250 | 10.1% |
[ 4.0% - 4.5% ] 4.09% | 318 | 10.6% |
[ 4.0% - 4.5% ] 4.14% | 893 | 6.2% |
[ 4.0% - 4.5% ] 4.30% | 186 | 2.8% |
[ 4.5% - 5.0% ] 4.55% | 550 | 16.6% |
[ 4.5% - 5.0% ] 4.59% | 2,047 | 8.0% |
[ 4.5% - 5.0% ] 4.67% | 793 | 7.3% |
[ 4.5% - 5.0% ] 4.78% | 460 | 9.0% |
[ 5.0% - 5.5% ] 5.01% | 32,438 | 4.3% |
[ 5.5% - 6.0% ] 5.76% | 191 | 2.4% |
[ 8.0% - 8.5% ] 8.24% | 595 | 10.7% |
[ 9.5% - 10.0% ] 9.80% | 153 | 10.2% |
[ 11.0% - 11.5% ] 11.14% | 2,540 | 6.8% |