Immigrants from Ireland GED/Equivalency
COMPARE
Immigrants from Ireland
Select to Compare
GED/Equivalency
Immigrants from Ireland GED/Equivalency
88.6%
GED/EQUIVALENCY
99.8/ 100
METRIC RATING
22nd/ 347
METRIC RANK
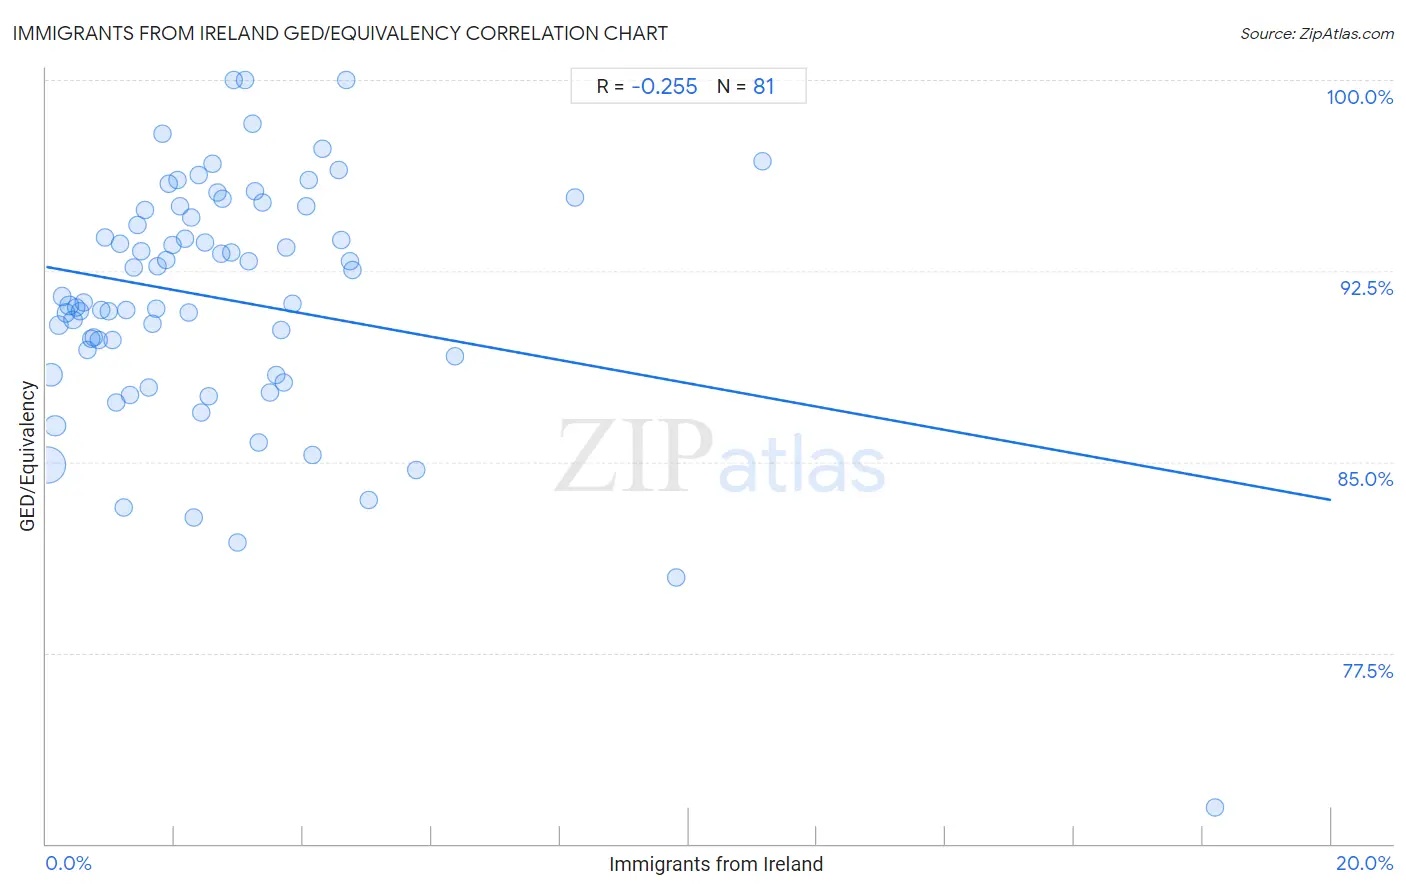
Immigrants from Ireland GED/Equivalency Correlation Chart
The statistical analysis conducted on geographies consisting of 240,784,498 people shows a weak negative correlation between the proportion of Immigrants from Ireland and percentage of population with at least ged/equivalency education in the United States with a correlation coefficient (R) of -0.255 and weighted average of 88.6%. On average, for every 1% (one percent) increase in Immigrants from Ireland within a typical geography, there is a decrease of 0.46% in percentage of population with at least ged/equivalency education.
It is essential to understand that the correlation between the percentage of Immigrants from Ireland and percentage of population with at least ged/equivalency education does not imply a direct cause-and-effect relationship. It remains uncertain whether the presence of Immigrants from Ireland influences an upward or downward trend in the level of percentage of population with at least ged/equivalency education within an area, or if Immigrants from Ireland simply ended up residing in those areas with higher or lower levels of percentage of population with at least ged/equivalency education due to other factors.
Demographics Similar to Immigrants from Ireland by GED/Equivalency
In terms of ged/equivalency, the demographic groups most similar to Immigrants from Ireland are Luxembourger (88.6%, a difference of 0.010%), Maltese (88.6%, a difference of 0.020%), Russian (88.6%, a difference of 0.020%), Slovak (88.6%, a difference of 0.020%), and Estonian (88.6%, a difference of 0.020%).
| Demographics | Rating | Rank | GED/Equivalency |
| Okinawans | 99.9 /100 | #15 | Exceptional 88.9% |
| Immigrants from Taiwan | 99.9 /100 | #16 | Exceptional 88.8% |
| Croatians | 99.9 /100 | #17 | Exceptional 88.8% |
| Slovenes | 99.9 /100 | #18 | Exceptional 88.8% |
| Swedes | 99.9 /100 | #19 | Exceptional 88.8% |
| Maltese | 99.9 /100 | #20 | Exceptional 88.6% |
| Luxembourgers | 99.8 /100 | #21 | Exceptional 88.6% |
| Immigrants from Ireland | 99.8 /100 | #22 | Exceptional 88.6% |
| Russians | 99.8 /100 | #23 | Exceptional 88.6% |
| Slovaks | 99.8 /100 | #24 | Exceptional 88.6% |
| Estonians | 99.8 /100 | #25 | Exceptional 88.6% |
| Immigrants from Australia | 99.8 /100 | #26 | Exceptional 88.6% |
| Immigrants from Lithuania | 99.8 /100 | #27 | Exceptional 88.6% |
| Immigrants from Northern Europe | 99.8 /100 | #28 | Exceptional 88.5% |
| Poles | 99.8 /100 | #29 | Exceptional 88.5% |
Immigrants from Ireland GED/Equivalency Correlation Summary
| Measurement | Immigrants from Ireland Data | GED/Equivalency Data |
| Minimum | 0.024% | 71.4% |
| Maximum | 18.2% | 100.0% |
| Range | 18.2% | 28.6% |
| Mean | 2.8% | 91.4% |
| Median | 2.3% | 91.3% |
| Interquartile 25% (IQ1) | 1.1% | 88.8% |
| Interquartile 75% (IQ3) | 3.6% | 95.0% |
| Interquartile Range (IQR) | 2.5% | 6.2% |
| Standard Deviation (Sample) | 2.7% | 4.8% |
| Standard Deviation (Population) | 2.7% | 4.8% |
Correlation Details
| Immigrants from Ireland Percentile | Sample Size | GED/Equivalency |
[ 0.0% - 0.5% ] 0.024% | 144,623,470 | 84.9% |
[ 0.0% - 0.5% ] 0.080% | 41,692,720 | 88.4% |
[ 0.0% - 0.5% ] 0.14% | 25,967,044 | 86.4% |
[ 0.0% - 0.5% ] 0.19% | 8,531,222 | 90.4% |
[ 0.0% - 0.5% ] 0.25% | 5,248,992 | 91.5% |
[ 0.0% - 0.5% ] 0.31% | 3,738,958 | 90.9% |
[ 0.0% - 0.5% ] 0.36% | 2,731,839 | 91.1% |
[ 0.0% - 0.5% ] 0.42% | 1,440,409 | 90.6% |
[ 0.0% - 0.5% ] 0.47% | 1,137,813 | 91.1% |
[ 0.5% - 1.0% ] 0.52% | 841,655 | 90.9% |
[ 0.5% - 1.0% ] 0.58% | 896,187 | 91.3% |
[ 0.5% - 1.0% ] 0.63% | 627,539 | 89.4% |
[ 0.5% - 1.0% ] 0.70% | 380,884 | 89.8% |
[ 0.5% - 1.0% ] 0.75% | 442,740 | 89.9% |
[ 0.5% - 1.0% ] 0.81% | 389,912 | 89.8% |
[ 0.5% - 1.0% ] 0.86% | 351,625 | 91.0% |
[ 0.5% - 1.0% ] 0.92% | 83,281 | 93.8% |
[ 0.5% - 1.0% ] 0.97% | 118,500 | 90.9% |
[ 1.0% - 1.5% ] 1.04% | 143,553 | 89.8% |
[ 1.0% - 1.5% ] 1.08% | 265,114 | 87.3% |
[ 1.0% - 1.5% ] 1.16% | 75,662 | 93.5% |
[ 1.0% - 1.5% ] 1.21% | 288,396 | 83.2% |
[ 1.0% - 1.5% ] 1.24% | 99,410 | 91.0% |
[ 1.0% - 1.5% ] 1.30% | 86,599 | 87.6% |
[ 1.0% - 1.5% ] 1.37% | 59,139 | 92.7% |
[ 1.0% - 1.5% ] 1.42% | 28,596 | 94.3% |
[ 1.0% - 1.5% ] 1.47% | 47,192 | 93.3% |
[ 1.5% - 2.0% ] 1.54% | 57,181 | 94.9% |
[ 1.5% - 2.0% ] 1.59% | 19,334 | 87.9% |
[ 1.5% - 2.0% ] 1.65% | 13,221 | 90.4% |
[ 1.5% - 2.0% ] 1.71% | 16,804 | 91.0% |
[ 1.5% - 2.0% ] 1.74% | 39,141 | 92.7% |
[ 1.5% - 2.0% ] 1.81% | 5,808 | 97.9% |
[ 1.5% - 2.0% ] 1.86% | 30,627 | 92.9% |
[ 1.5% - 2.0% ] 1.91% | 29,672 | 95.9% |
[ 1.5% - 2.0% ] 1.96% | 9,062 | 93.5% |
[ 2.0% - 2.5% ] 2.04% | 3,882 | 96.1% |
[ 2.0% - 2.5% ] 2.08% | 6,503 | 95.1% |
[ 2.0% - 2.5% ] 2.15% | 1,811 | 93.8% |
[ 2.0% - 2.5% ] 2.22% | 3,247 | 90.9% |
[ 2.0% - 2.5% ] 2.25% | 754 | 94.6% |
[ 2.0% - 2.5% ] 2.30% | 304 | 82.8% |
[ 2.0% - 2.5% ] 2.37% | 10,780 | 96.3% |
[ 2.0% - 2.5% ] 2.42% | 4,466 | 87.0% |
[ 2.0% - 2.5% ] 2.48% | 1,493 | 93.6% |
[ 2.5% - 3.0% ] 2.53% | 5,013 | 87.6% |
[ 2.5% - 3.0% ] 2.60% | 6,011 | 96.7% |
[ 2.5% - 3.0% ] 2.66% | 31,720 | 95.6% |
[ 2.5% - 3.0% ] 2.72% | 2,799 | 93.2% |
[ 2.5% - 3.0% ] 2.74% | 7,599 | 95.3% |
[ 2.5% - 3.0% ] 2.89% | 3,809 | 93.2% |
[ 2.5% - 3.0% ] 2.92% | 857 | 100.0% |
[ 2.5% - 3.0% ] 2.97% | 20,439 | 81.8% |
[ 3.0% - 3.5% ] 3.09% | 356 | 100.0% |
[ 3.0% - 3.5% ] 3.16% | 7,729 | 92.9% |
[ 3.0% - 3.5% ] 3.20% | 2,812 | 98.3% |
[ 3.0% - 3.5% ] 3.26% | 768 | 95.6% |
[ 3.0% - 3.5% ] 3.31% | 8,872 | 85.7% |
[ 3.0% - 3.5% ] 3.37% | 297 | 95.2% |
[ 3.0% - 3.5% ] 3.49% | 15,666 | 87.7% |
[ 3.5% - 4.0% ] 3.58% | 2,041 | 88.4% |
[ 3.5% - 4.0% ] 3.65% | 2,987 | 90.2% |
[ 3.5% - 4.0% ] 3.70% | 16,426 | 88.1% |
[ 3.5% - 4.0% ] 3.74% | 3,828 | 93.4% |
[ 3.5% - 4.0% ] 3.83% | 575 | 91.2% |
[ 4.0% - 4.5% ] 4.05% | 8,250 | 95.0% |
[ 4.0% - 4.5% ] 4.09% | 514 | 96.1% |
[ 4.0% - 4.5% ] 4.14% | 893 | 85.3% |
[ 4.0% - 4.5% ] 4.30% | 186 | 97.3% |
[ 4.5% - 5.0% ] 4.55% | 550 | 96.5% |
[ 4.5% - 5.0% ] 4.59% | 2,047 | 93.7% |
[ 4.5% - 5.0% ] 4.67% | 793 | 100.0% |
[ 4.5% - 5.0% ] 4.72% | 254 | 92.9% |
[ 4.5% - 5.0% ] 4.77% | 943 | 92.5% |
[ 5.0% - 5.5% ] 5.01% | 33,059 | 83.5% |
[ 5.5% - 6.0% ] 5.76% | 191 | 84.7% |
[ 6.0% - 6.5% ] 6.36% | 330 | 89.1% |
[ 8.0% - 8.5% ] 8.24% | 595 | 95.4% |
[ 9.5% - 10.0% ] 9.80% | 153 | 80.5% |
[ 11.0% - 11.5% ] 11.14% | 2,540 | 96.8% |
[ 18.0% - 18.5% ] 18.18% | 55 | 71.4% |