Immigrants from Ireland Married-couple Households
COMPARE
Immigrants from Ireland
Select to Compare
Married-couple Households
Immigrants from Ireland Married-couple Households
48.0%
MARRIED-COUPLE HOUSEHOLDS
97.3/ 100
METRIC RATING
87th/ 347
METRIC RANK
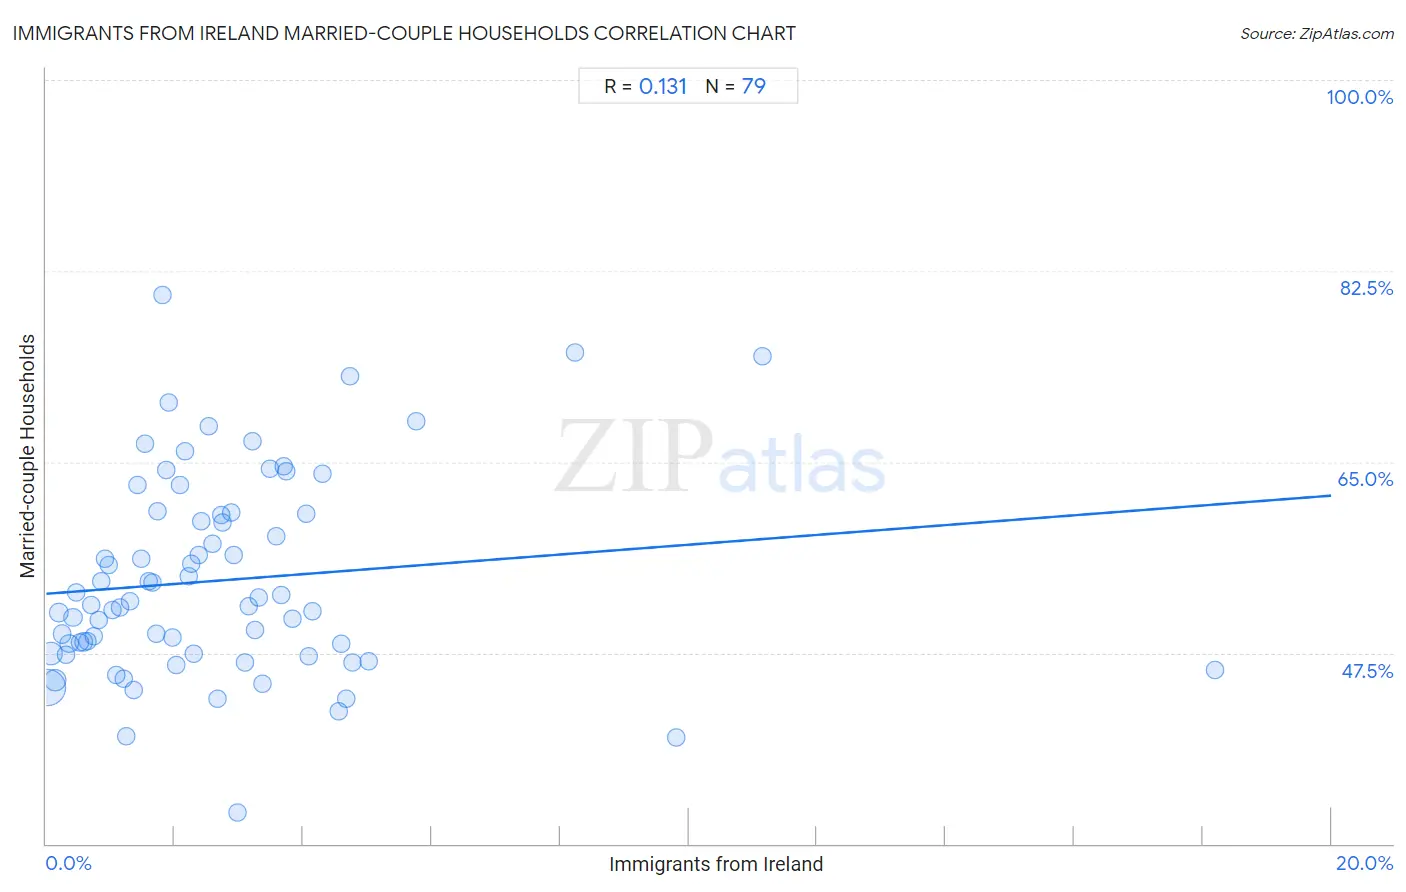
Immigrants from Ireland Married-couple Households Correlation Chart
The statistical analysis conducted on geographies consisting of 240,743,344 people shows a poor positive correlation between the proportion of Immigrants from Ireland and percentage of married-couple family households in the United States with a correlation coefficient (R) of 0.131 and weighted average of 48.0%. On average, for every 1% (one percent) increase in Immigrants from Ireland within a typical geography, there is an increase of 0.45% in percentage of married-couple family households.
It is essential to understand that the correlation between the percentage of Immigrants from Ireland and percentage of married-couple family households does not imply a direct cause-and-effect relationship. It remains uncertain whether the presence of Immigrants from Ireland influences an upward or downward trend in the level of percentage of married-couple family households within an area, or if Immigrants from Ireland simply ended up residing in those areas with higher or lower levels of percentage of married-couple family households due to other factors.
Demographics Similar to Immigrants from Ireland by Married-couple Households
In terms of married-couple households, the demographic groups most similar to Immigrants from Ireland are Afghan (48.0%, a difference of 0.0%), Belgian (48.0%, a difference of 0.010%), Cypriot (48.0%, a difference of 0.030%), Immigrants from Israel (48.0%, a difference of 0.040%), and French (48.0%, a difference of 0.050%).
| Demographics | Rating | Rank | Married-couple Households |
| Russians | 98.1 /100 | #80 | Exceptional 48.2% |
| Finns | 98.0 /100 | #81 | Exceptional 48.1% |
| Immigrants from Poland | 97.7 /100 | #82 | Exceptional 48.1% |
| Guamanians/Chamorros | 97.6 /100 | #83 | Exceptional 48.1% |
| Ukrainians | 97.6 /100 | #84 | Exceptional 48.1% |
| Immigrants from Israel | 97.4 /100 | #85 | Exceptional 48.0% |
| Belgians | 97.4 /100 | #86 | Exceptional 48.0% |
| Immigrants from Ireland | 97.3 /100 | #87 | Exceptional 48.0% |
| Afghans | 97.3 /100 | #88 | Exceptional 48.0% |
| Cypriots | 97.2 /100 | #89 | Exceptional 48.0% |
| French | 97.2 /100 | #90 | Exceptional 48.0% |
| Immigrants from Moldova | 97.0 /100 | #91 | Exceptional 48.0% |
| Palestinians | 96.9 /100 | #92 | Exceptional 48.0% |
| Lebanese | 96.9 /100 | #93 | Exceptional 47.9% |
| Americans | 96.9 /100 | #94 | Exceptional 47.9% |
Immigrants from Ireland Married-couple Households Correlation Summary
| Measurement | Immigrants from Ireland Data | Married-couple Households Data |
| Minimum | 0.024% | 32.8% |
| Maximum | 18.2% | 80.3% |
| Range | 18.2% | 47.5% |
| Mean | 2.7% | 54.1% |
| Median | 2.2% | 51.9% |
| Interquartile 25% (IQ1) | 1.1% | 47.4% |
| Interquartile 75% (IQ3) | 3.6% | 60.2% |
| Interquartile Range (IQR) | 2.5% | 12.8% |
| Standard Deviation (Sample) | 2.7% | 9.2% |
| Standard Deviation (Population) | 2.7% | 9.1% |
Correlation Details
| Immigrants from Ireland Percentile | Sample Size | Married-couple Households |
[ 0.0% - 0.5% ] 0.024% | 144,623,470 | 44.4% |
[ 0.0% - 0.5% ] 0.080% | 41,675,095 | 47.4% |
[ 0.0% - 0.5% ] 0.14% | 25,967,044 | 45.0% |
[ 0.0% - 0.5% ] 0.19% | 8,524,241 | 51.2% |
[ 0.0% - 0.5% ] 0.25% | 5,248,992 | 49.2% |
[ 0.0% - 0.5% ] 0.31% | 3,738,958 | 47.3% |
[ 0.0% - 0.5% ] 0.36% | 2,729,924 | 48.4% |
[ 0.0% - 0.5% ] 0.42% | 1,432,812 | 50.7% |
[ 0.0% - 0.5% ] 0.47% | 1,137,813 | 53.1% |
[ 0.5% - 1.0% ] 0.52% | 841,655 | 48.4% |
[ 0.5% - 1.0% ] 0.58% | 896,187 | 48.5% |
[ 0.5% - 1.0% ] 0.63% | 627,539 | 48.6% |
[ 0.5% - 1.0% ] 0.70% | 379,126 | 51.9% |
[ 0.5% - 1.0% ] 0.75% | 442,740 | 49.0% |
[ 0.5% - 1.0% ] 0.81% | 389,912 | 50.6% |
[ 0.5% - 1.0% ] 0.86% | 351,625 | 54.0% |
[ 0.5% - 1.0% ] 0.92% | 83,281 | 56.2% |
[ 0.5% - 1.0% ] 0.97% | 118,500 | 55.5% |
[ 1.0% - 1.5% ] 1.04% | 143,553 | 51.4% |
[ 1.0% - 1.5% ] 1.08% | 265,114 | 45.5% |
[ 1.0% - 1.5% ] 1.16% | 75,662 | 51.7% |
[ 1.0% - 1.5% ] 1.21% | 288,396 | 45.1% |
[ 1.0% - 1.5% ] 1.24% | 99,410 | 39.8% |
[ 1.0% - 1.5% ] 1.30% | 86,599 | 52.3% |
[ 1.0% - 1.5% ] 1.37% | 58,038 | 44.1% |
[ 1.0% - 1.5% ] 1.42% | 28,596 | 62.9% |
[ 1.0% - 1.5% ] 1.47% | 47,192 | 56.1% |
[ 1.5% - 2.0% ] 1.54% | 57,181 | 66.7% |
[ 1.5% - 2.0% ] 1.59% | 19,334 | 54.1% |
[ 1.5% - 2.0% ] 1.65% | 13,221 | 53.9% |
[ 1.5% - 2.0% ] 1.71% | 16,804 | 49.3% |
[ 1.5% - 2.0% ] 1.74% | 39,141 | 60.5% |
[ 1.5% - 2.0% ] 1.81% | 5,808 | 80.3% |
[ 1.5% - 2.0% ] 1.86% | 30,627 | 64.3% |
[ 1.5% - 2.0% ] 1.91% | 29,672 | 70.4% |
[ 1.5% - 2.0% ] 1.96% | 9,062 | 48.9% |
[ 2.0% - 2.5% ] 2.03% | 1,528 | 46.4% |
[ 2.0% - 2.5% ] 2.08% | 6,503 | 62.9% |
[ 2.0% - 2.5% ] 2.15% | 1,811 | 65.9% |
[ 2.0% - 2.5% ] 2.22% | 3,247 | 54.5% |
[ 2.0% - 2.5% ] 2.25% | 754 | 55.6% |
[ 2.0% - 2.5% ] 2.30% | 304 | 47.4% |
[ 2.0% - 2.5% ] 2.37% | 10,780 | 56.4% |
[ 2.0% - 2.5% ] 2.42% | 4,466 | 59.6% |
[ 2.5% - 3.0% ] 2.53% | 5,013 | 68.3% |
[ 2.5% - 3.0% ] 2.60% | 6,011 | 57.5% |
[ 2.5% - 3.0% ] 2.66% | 31,720 | 43.3% |
[ 2.5% - 3.0% ] 2.72% | 2,799 | 60.1% |
[ 2.5% - 3.0% ] 2.74% | 7,599 | 59.5% |
[ 2.5% - 3.0% ] 2.89% | 3,809 | 60.4% |
[ 2.5% - 3.0% ] 2.92% | 857 | 56.5% |
[ 2.5% - 3.0% ] 2.97% | 20,439 | 32.8% |
[ 3.0% - 3.5% ] 3.09% | 356 | 46.6% |
[ 3.0% - 3.5% ] 3.16% | 7,729 | 51.8% |
[ 3.0% - 3.5% ] 3.20% | 2,812 | 66.9% |
[ 3.0% - 3.5% ] 3.26% | 768 | 49.6% |
[ 3.0% - 3.5% ] 3.31% | 8,872 | 52.6% |
[ 3.0% - 3.5% ] 3.37% | 297 | 44.7% |
[ 3.0% - 3.5% ] 3.49% | 15,666 | 64.4% |
[ 3.5% - 4.0% ] 3.58% | 2,041 | 58.2% |
[ 3.5% - 4.0% ] 3.65% | 2,987 | 52.8% |
[ 3.5% - 4.0% ] 3.70% | 16,426 | 64.6% |
[ 3.5% - 4.0% ] 3.74% | 3,828 | 64.1% |
[ 3.5% - 4.0% ] 3.83% | 575 | 50.6% |
[ 4.0% - 4.5% ] 4.05% | 8,250 | 60.2% |
[ 4.0% - 4.5% ] 4.09% | 514 | 47.2% |
[ 4.0% - 4.5% ] 4.14% | 893 | 51.3% |
[ 4.0% - 4.5% ] 4.30% | 186 | 63.9% |
[ 4.5% - 5.0% ] 4.55% | 550 | 42.1% |
[ 4.5% - 5.0% ] 4.59% | 2,047 | 48.3% |
[ 4.5% - 5.0% ] 4.67% | 793 | 43.3% |
[ 4.5% - 5.0% ] 4.72% | 254 | 72.8% |
[ 4.5% - 5.0% ] 4.77% | 943 | 46.6% |
[ 5.0% - 5.5% ] 5.01% | 33,059 | 46.8% |
[ 5.5% - 6.0% ] 5.76% | 191 | 68.7% |
[ 8.0% - 8.5% ] 8.24% | 595 | 75.0% |
[ 9.5% - 10.0% ] 9.80% | 153 | 39.8% |
[ 11.0% - 11.5% ] 11.14% | 2,540 | 74.6% |
[ 18.0% - 18.5% ] 18.18% | 55 | 45.9% |