Immigrants from Ireland vs Immigrants from El Salvador Disability Age 5 to 17
COMPARE
Immigrants from Ireland
Immigrants from El Salvador
Disability Age 5 to 17
Disability Age 5 to 17 Comparison
Immigrants from Ireland
Immigrants from El Salvador
5.2%
DISABILITY AGE 5 TO 17
99.8/ 100
METRIC RATING
62nd/ 347
METRIC RANK
5.3%
DISABILITY AGE 5 TO 17
99.0/ 100
METRIC RATING
96th/ 347
METRIC RANK
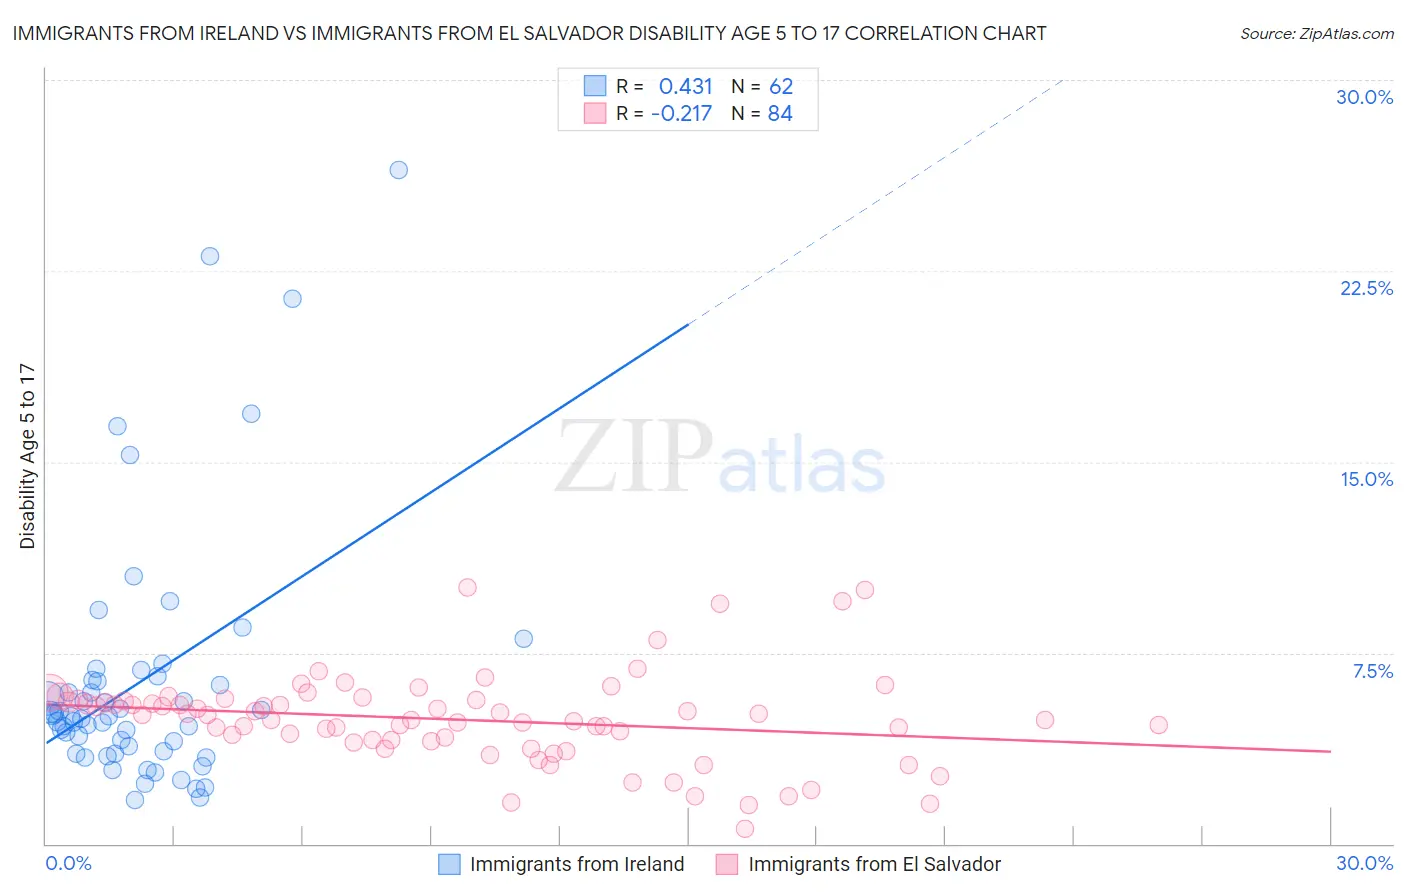
Immigrants from Ireland vs Immigrants from El Salvador Disability Age 5 to 17 Correlation Chart
The statistical analysis conducted on geographies consisting of 239,046,676 people shows a moderate positive correlation between the proportion of Immigrants from Ireland and percentage of population with a disability between the ages 5 and 17 in the United States with a correlation coefficient (R) of 0.431 and weighted average of 5.2%. Similarly, the statistical analysis conducted on geographies consisting of 355,746,060 people shows a weak negative correlation between the proportion of Immigrants from El Salvador and percentage of population with a disability between the ages 5 and 17 in the United States with a correlation coefficient (R) of -0.217 and weighted average of 5.3%, a difference of 2.2%.
Disability Age 5 to 17 Correlation Summary
| Measurement | Immigrants from Ireland | Immigrants from El Salvador |
| Minimum | 1.7% | 0.57% |
| Maximum | 26.5% | 10.1% |
| Range | 24.8% | 9.5% |
| Mean | 6.4% | 4.9% |
| Median | 5.0% | 5.0% |
| Interquartile 25% (IQ1) | 3.6% | 4.0% |
| Interquartile 75% (IQ3) | 6.4% | 5.6% |
| Interquartile Range (IQR) | 2.8% | 1.6% |
| Standard Deviation (Sample) | 5.0% | 1.8% |
| Standard Deviation (Population) | 4.9% | 1.7% |
Similar Demographics by Disability Age 5 to 17
Demographics Similar to Immigrants from Ireland by Disability Age 5 to 17
In terms of disability age 5 to 17, the demographic groups most similar to Immigrants from Ireland are Immigrants from Switzerland (5.2%, a difference of 0.090%), Immigrants from Bangladesh (5.2%, a difference of 0.11%), Immigrants from South Eastern Asia (5.2%, a difference of 0.14%), Immigrants from Greece (5.2%, a difference of 0.15%), and Palestinian (5.2%, a difference of 0.19%).
| Demographics | Rating | Rank | Disability Age 5 to 17 |
| Laotians | 99.9 /100 | #55 | Exceptional 5.1% |
| Immigrants | Turkey | 99.9 /100 | #56 | Exceptional 5.1% |
| Immigrants | Poland | 99.9 /100 | #57 | Exceptional 5.1% |
| Immigrants | Ukraine | 99.9 /100 | #58 | Exceptional 5.1% |
| Immigrants | North Macedonia | 99.9 /100 | #59 | Exceptional 5.1% |
| Immigrants | Eastern Europe | 99.9 /100 | #60 | Exceptional 5.1% |
| Immigrants | Switzerland | 99.8 /100 | #61 | Exceptional 5.2% |
| Immigrants | Ireland | 99.8 /100 | #62 | Exceptional 5.2% |
| Immigrants | Bangladesh | 99.8 /100 | #63 | Exceptional 5.2% |
| Immigrants | South Eastern Asia | 99.8 /100 | #64 | Exceptional 5.2% |
| Immigrants | Greece | 99.8 /100 | #65 | Exceptional 5.2% |
| Palestinians | 99.8 /100 | #66 | Exceptional 5.2% |
| Macedonians | 99.8 /100 | #67 | Exceptional 5.2% |
| Immigrants | Syria | 99.7 /100 | #68 | Exceptional 5.2% |
| Guyanese | 99.7 /100 | #69 | Exceptional 5.2% |
Demographics Similar to Immigrants from El Salvador by Disability Age 5 to 17
In terms of disability age 5 to 17, the demographic groups most similar to Immigrants from El Salvador are Immigrants from Europe (5.3%, a difference of 0.0%), Immigrants from Austria (5.3%, a difference of 0.050%), Cambodian (5.3%, a difference of 0.15%), Immigrants from Grenada (5.3%, a difference of 0.16%), and Immigrants from Jordan (5.3%, a difference of 0.18%).
| Demographics | Rating | Rank | Disability Age 5 to 17 |
| Immigrants | Spain | 99.4 /100 | #89 | Exceptional 5.2% |
| Immigrants | Kuwait | 99.4 /100 | #90 | Exceptional 5.3% |
| Mongolians | 99.2 /100 | #91 | Exceptional 5.3% |
| Luxembourgers | 99.2 /100 | #92 | Exceptional 5.3% |
| Immigrants | Peru | 99.1 /100 | #93 | Exceptional 5.3% |
| Immigrants | Jordan | 99.1 /100 | #94 | Exceptional 5.3% |
| Immigrants | Grenada | 99.1 /100 | #95 | Exceptional 5.3% |
| Immigrants | El Salvador | 99.0 /100 | #96 | Exceptional 5.3% |
| Immigrants | Europe | 99.0 /100 | #97 | Exceptional 5.3% |
| Immigrants | Austria | 98.9 /100 | #98 | Exceptional 5.3% |
| Cambodians | 98.8 /100 | #99 | Exceptional 5.3% |
| Nepalese | 98.7 /100 | #100 | Exceptional 5.3% |
| Menominee | 98.7 /100 | #101 | Exceptional 5.3% |
| Nicaraguans | 98.6 /100 | #102 | Exceptional 5.3% |
| Salvadorans | 98.6 /100 | #103 | Exceptional 5.3% |