Immigrants from Colombia vs Alaska Native Disability Age 5 to 17
COMPARE
Immigrants from Colombia
Alaska Native
Disability Age 5 to 17
Disability Age 5 to 17 Comparison
Immigrants from Colombia
Alaska Natives
5.4%
DISABILITY AGE 5 TO 17
92.9/ 100
METRIC RATING
132nd/ 347
METRIC RANK
6.0%
DISABILITY AGE 5 TO 17
0.2/ 100
METRIC RATING
273rd/ 347
METRIC RANK
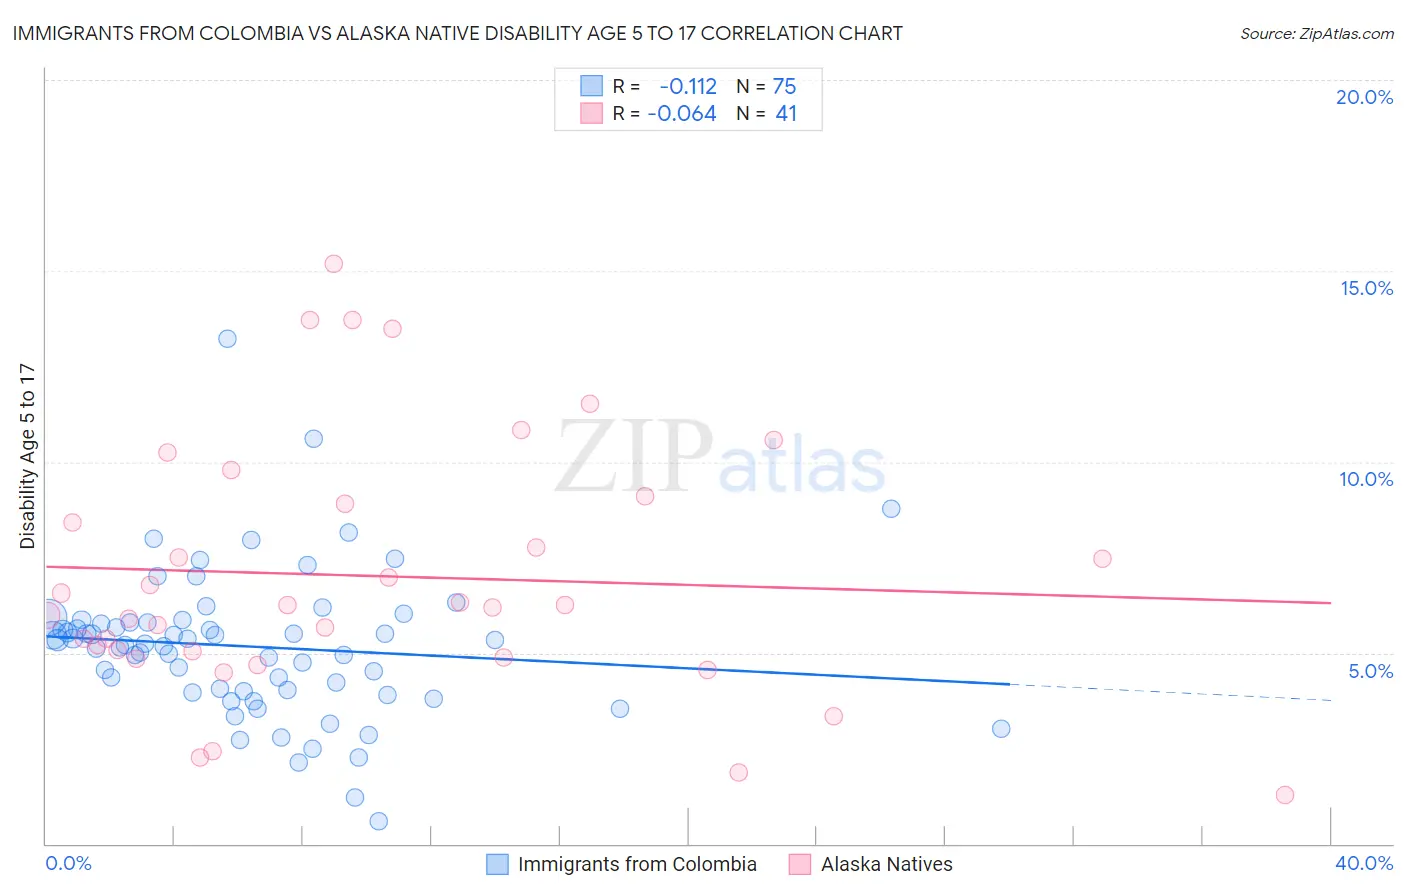
Immigrants from Colombia vs Alaska Native Disability Age 5 to 17 Correlation Chart
The statistical analysis conducted on geographies consisting of 376,032,819 people shows a poor negative correlation between the proportion of Immigrants from Colombia and percentage of population with a disability between the ages 5 and 17 in the United States with a correlation coefficient (R) of -0.112 and weighted average of 5.4%. Similarly, the statistical analysis conducted on geographies consisting of 76,612,507 people shows a slight negative correlation between the proportion of Alaska Natives and percentage of population with a disability between the ages 5 and 17 in the United States with a correlation coefficient (R) of -0.064 and weighted average of 6.0%, a difference of 11.3%.
Disability Age 5 to 17 Correlation Summary
| Measurement | Immigrants from Colombia | Alaska Native |
| Minimum | 0.60% | 1.3% |
| Maximum | 13.2% | 15.2% |
| Range | 12.6% | 13.9% |
| Mean | 5.2% | 7.0% |
| Median | 5.2% | 6.2% |
| Interquartile 25% (IQ1) | 4.0% | 5.0% |
| Interquartile 75% (IQ3) | 5.8% | 9.0% |
| Interquartile Range (IQR) | 1.8% | 4.0% |
| Standard Deviation (Sample) | 1.9% | 3.3% |
| Standard Deviation (Population) | 1.9% | 3.3% |
Similar Demographics by Disability Age 5 to 17
Demographics Similar to Immigrants from Colombia by Disability Age 5 to 17
In terms of disability age 5 to 17, the demographic groups most similar to Immigrants from Colombia are Arab (5.4%, a difference of 0.020%), Venezuelan (5.4%, a difference of 0.030%), Yuman (5.4%, a difference of 0.11%), Immigrants from Belize (5.4%, a difference of 0.21%), and Immigrants from Bulgaria (5.4%, a difference of 0.25%).
| Demographics | Rating | Rank | Disability Age 5 to 17 |
| Immigrants | Chile | 95.0 /100 | #125 | Exceptional 5.4% |
| New Zealanders | 95.0 /100 | #126 | Exceptional 5.4% |
| Latvians | 95.0 /100 | #127 | Exceptional 5.4% |
| Immigrants | Venezuela | 94.5 /100 | #128 | Exceptional 5.4% |
| Romanians | 94.1 /100 | #129 | Exceptional 5.4% |
| Immigrants | Bulgaria | 94.0 /100 | #130 | Exceptional 5.4% |
| Arabs | 92.9 /100 | #131 | Exceptional 5.4% |
| Immigrants | Colombia | 92.9 /100 | #132 | Exceptional 5.4% |
| Venezuelans | 92.7 /100 | #133 | Exceptional 5.4% |
| Yuman | 92.3 /100 | #134 | Exceptional 5.4% |
| Immigrants | Belize | 91.7 /100 | #135 | Exceptional 5.4% |
| Immigrants | Denmark | 91.4 /100 | #136 | Exceptional 5.4% |
| Navajo | 90.9 /100 | #137 | Exceptional 5.4% |
| Immigrants | Oceania | 90.8 /100 | #138 | Exceptional 5.4% |
| Belizeans | 90.8 /100 | #139 | Exceptional 5.4% |
Demographics Similar to Alaska Natives by Disability Age 5 to 17
In terms of disability age 5 to 17, the demographic groups most similar to Alaska Natives are Finnish (6.0%, a difference of 0.050%), Immigrants from Zaire (6.0%, a difference of 0.080%), Cheyenne (6.0%, a difference of 0.11%), Dutch (6.0%, a difference of 0.22%), and Japanese (6.1%, a difference of 0.33%).
| Demographics | Rating | Rank | Disability Age 5 to 17 |
| Slovenes | 0.6 /100 | #266 | Tragic 6.0% |
| Spanish | 0.5 /100 | #267 | Tragic 6.0% |
| Sioux | 0.4 /100 | #268 | Tragic 6.0% |
| Liberians | 0.4 /100 | #269 | Tragic 6.0% |
| Immigrants | Somalia | 0.4 /100 | #270 | Tragic 6.0% |
| Immigrants | Zaire | 0.2 /100 | #271 | Tragic 6.0% |
| Finns | 0.2 /100 | #272 | Tragic 6.0% |
| Alaska Natives | 0.2 /100 | #273 | Tragic 6.0% |
| Cheyenne | 0.2 /100 | #274 | Tragic 6.0% |
| Dutch | 0.2 /100 | #275 | Tragic 6.0% |
| Japanese | 0.1 /100 | #276 | Tragic 6.1% |
| Puget Sound Salish | 0.1 /100 | #277 | Tragic 6.1% |
| Immigrants | Liberia | 0.1 /100 | #278 | Tragic 6.1% |
| Immigrants | Jamaica | 0.1 /100 | #279 | Tragic 6.1% |
| Portuguese | 0.1 /100 | #280 | Tragic 6.1% |