French vs Northern European Disability Age 5 to 17
COMPARE
French
Northern European
Disability Age 5 to 17
Disability Age 5 to 17 Comparison
French
Northern Europeans
6.4%
DISABILITY AGE 5 TO 17
0.0/ 100
METRIC RATING
314th/ 347
METRIC RANK
5.7%
DISABILITY AGE 5 TO 17
15.2/ 100
METRIC RATING
199th/ 347
METRIC RANK
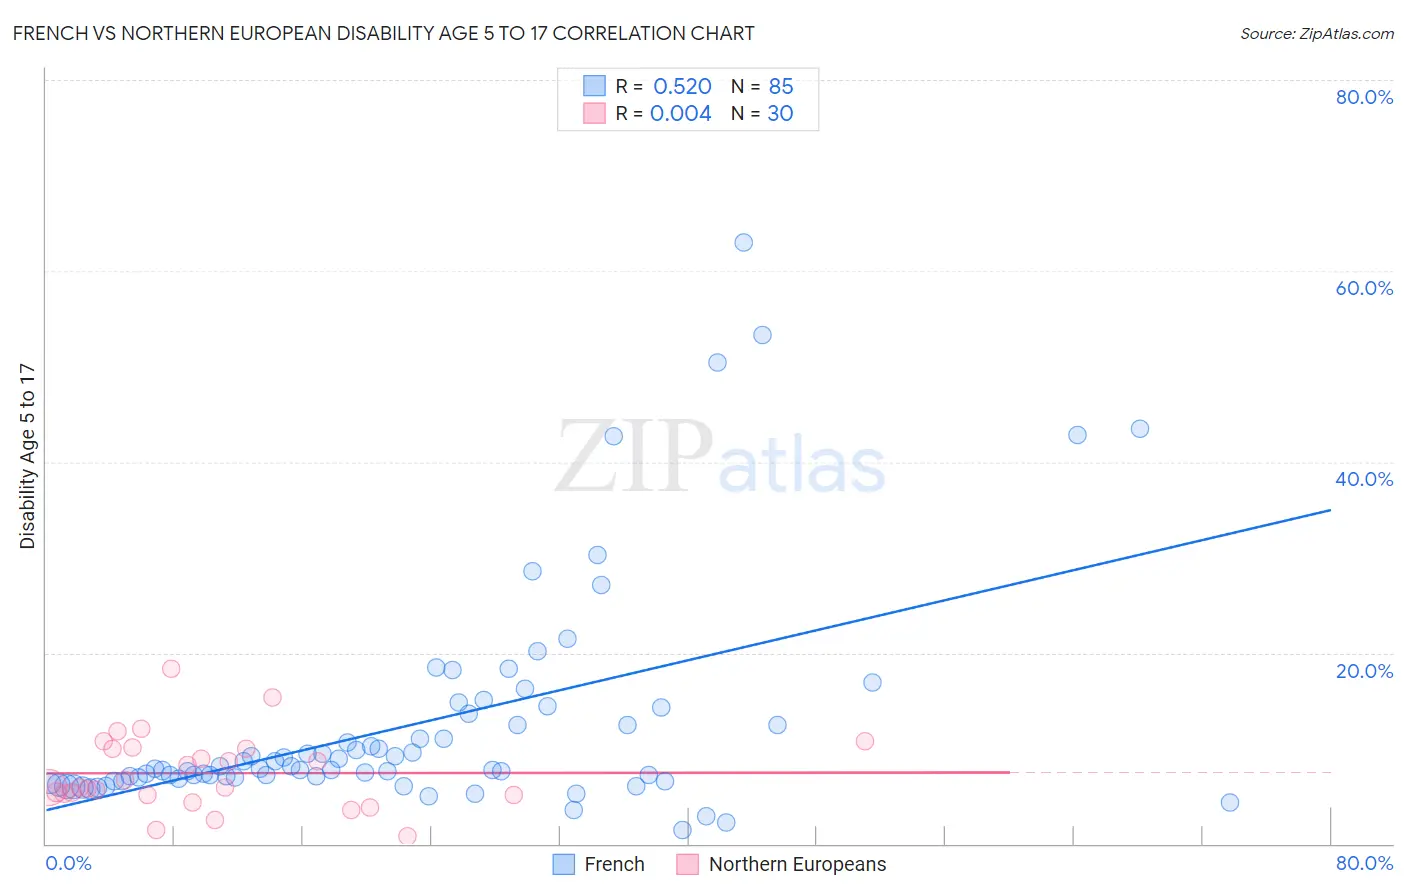
French vs Northern European Disability Age 5 to 17 Correlation Chart
The statistical analysis conducted on geographies consisting of 558,470,754 people shows a substantial positive correlation between the proportion of French and percentage of population with a disability between the ages 5 and 17 in the United States with a correlation coefficient (R) of 0.520 and weighted average of 6.4%. Similarly, the statistical analysis conducted on geographies consisting of 401,696,711 people shows no correlation between the proportion of Northern Europeans and percentage of population with a disability between the ages 5 and 17 in the United States with a correlation coefficient (R) of 0.004 and weighted average of 5.7%, a difference of 12.1%.
Disability Age 5 to 17 Correlation Summary
| Measurement | French | Northern European |
| Minimum | 1.4% | 0.78% |
| Maximum | 62.9% | 18.3% |
| Range | 61.5% | 17.5% |
| Mean | 12.5% | 7.4% |
| Median | 7.9% | 5.9% |
| Interquartile 25% (IQ1) | 6.7% | 5.2% |
| Interquartile 75% (IQ3) | 13.0% | 10.0% |
| Interquartile Range (IQR) | 6.3% | 4.8% |
| Standard Deviation (Sample) | 11.7% | 3.9% |
| Standard Deviation (Population) | 11.6% | 3.9% |
Similar Demographics by Disability Age 5 to 17
Demographics Similar to French by Disability Age 5 to 17
In terms of disability age 5 to 17, the demographic groups most similar to French are Immigrants from Portugal (6.4%, a difference of 0.18%), Immigrants from Dominican Republic (6.4%, a difference of 0.36%), Kiowa (6.4%, a difference of 0.48%), Apache (6.4%, a difference of 0.51%), and Comanche (6.4%, a difference of 0.51%).
| Demographics | Rating | Rank | Disability Age 5 to 17 |
| Bahamians | 0.0 /100 | #307 | Tragic 6.3% |
| Scotch-Irish | 0.0 /100 | #308 | Tragic 6.3% |
| Hmong | 0.0 /100 | #309 | Tragic 6.3% |
| Alaskan Athabascans | 0.0 /100 | #310 | Tragic 6.3% |
| Immigrants | Dominica | 0.0 /100 | #311 | Tragic 6.3% |
| Bermudans | 0.0 /100 | #312 | Tragic 6.4% |
| Apache | 0.0 /100 | #313 | Tragic 6.4% |
| French | 0.0 /100 | #314 | Tragic 6.4% |
| Immigrants | Portugal | 0.0 /100 | #315 | Tragic 6.4% |
| Immigrants | Dominican Republic | 0.0 /100 | #316 | Tragic 6.4% |
| Kiowa | 0.0 /100 | #317 | Tragic 6.4% |
| Comanche | 0.0 /100 | #318 | Tragic 6.4% |
| Delaware | 0.0 /100 | #319 | Tragic 6.5% |
| Africans | 0.0 /100 | #320 | Tragic 6.5% |
| Tohono O'odham | 0.0 /100 | #321 | Tragic 6.5% |
Demographics Similar to Northern Europeans by Disability Age 5 to 17
In terms of disability age 5 to 17, the demographic groups most similar to Northern Europeans are Icelander (5.7%, a difference of 0.060%), Basque (5.7%, a difference of 0.15%), Austrian (5.7%, a difference of 0.20%), Spanish American Indian (5.7%, a difference of 0.24%), and Paiute (5.7%, a difference of 0.42%).
| Demographics | Rating | Rank | Disability Age 5 to 17 |
| Immigrants | Bosnia and Herzegovina | 26.3 /100 | #192 | Fair 5.7% |
| Immigrants | Canada | 26.1 /100 | #193 | Fair 5.7% |
| Croatians | 23.6 /100 | #194 | Fair 5.7% |
| Immigrants | Nigeria | 23.4 /100 | #195 | Fair 5.7% |
| Inupiat | 23.3 /100 | #196 | Fair 5.7% |
| Immigrants | North America | 23.1 /100 | #197 | Fair 5.7% |
| Norwegians | 20.9 /100 | #198 | Fair 5.7% |
| Northern Europeans | 15.2 /100 | #199 | Poor 5.7% |
| Icelanders | 14.6 /100 | #200 | Poor 5.7% |
| Basques | 13.7 /100 | #201 | Poor 5.7% |
| Austrians | 13.2 /100 | #202 | Poor 5.7% |
| Spanish American Indians | 12.8 /100 | #203 | Poor 5.7% |
| Paiute | 11.2 /100 | #204 | Poor 5.7% |
| Trinidadians and Tobagonians | 10.8 /100 | #205 | Poor 5.7% |
| Immigrants | Africa | 10.8 /100 | #206 | Poor 5.7% |