French vs Australian Disability Age 5 to 17
COMPARE
French
Australian
Disability Age 5 to 17
Disability Age 5 to 17 Comparison
French
Australians
6.4%
DISABILITY AGE 5 TO 17
0.0/ 100
METRIC RATING
314th/ 347
METRIC RANK
5.5%
DISABILITY AGE 5 TO 17
78.8/ 100
METRIC RATING
154th/ 347
METRIC RANK
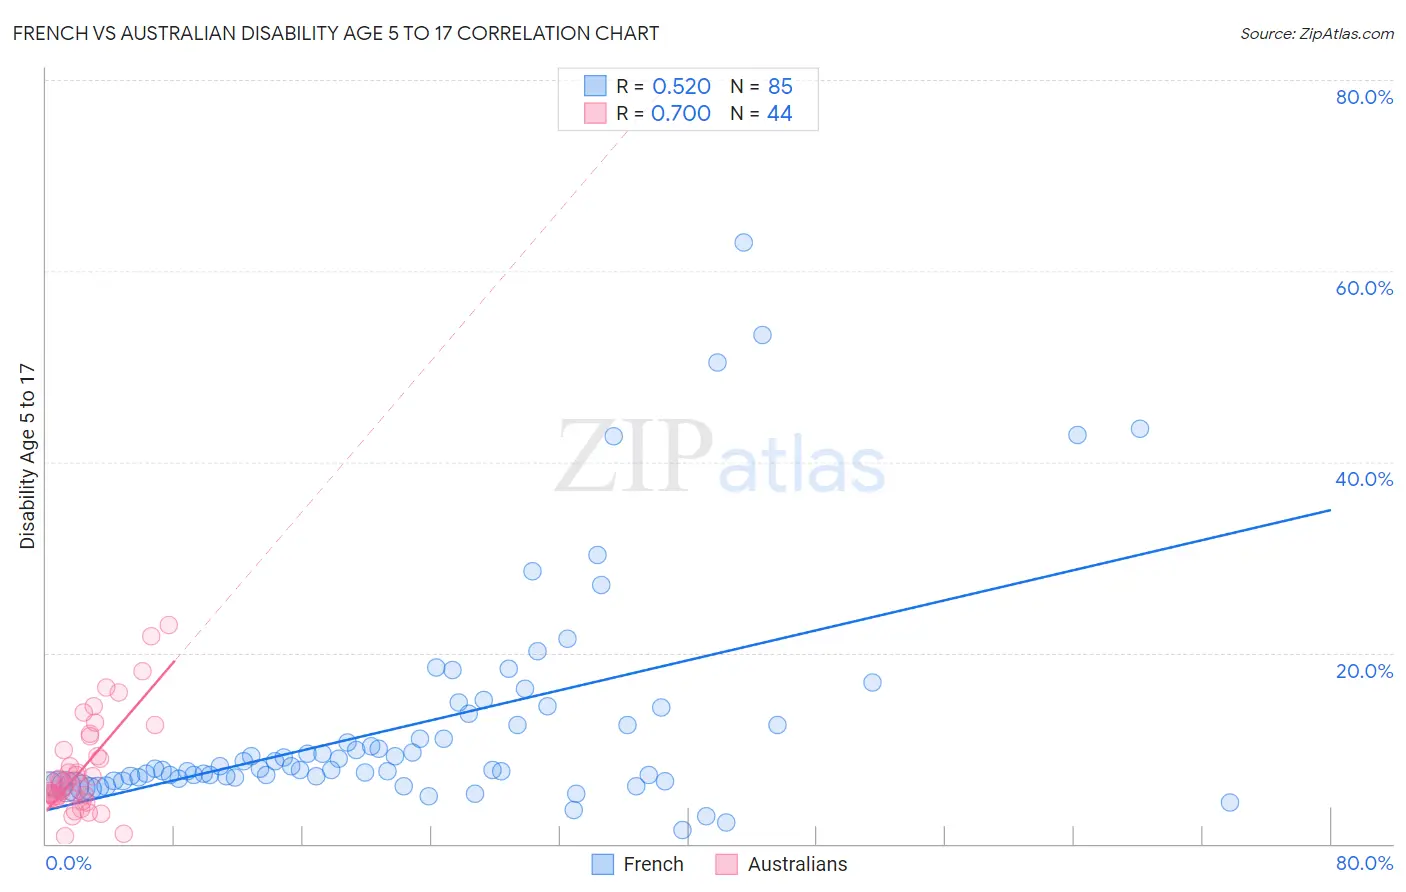
French vs Australian Disability Age 5 to 17 Correlation Chart
The statistical analysis conducted on geographies consisting of 558,470,754 people shows a substantial positive correlation between the proportion of French and percentage of population with a disability between the ages 5 and 17 in the United States with a correlation coefficient (R) of 0.520 and weighted average of 6.4%. Similarly, the statistical analysis conducted on geographies consisting of 222,865,567 people shows a strong positive correlation between the proportion of Australians and percentage of population with a disability between the ages 5 and 17 in the United States with a correlation coefficient (R) of 0.700 and weighted average of 5.5%, a difference of 16.4%.
Disability Age 5 to 17 Correlation Summary
| Measurement | French | Australian |
| Minimum | 1.4% | 0.74% |
| Maximum | 62.9% | 23.0% |
| Range | 61.5% | 22.2% |
| Mean | 12.5% | 8.0% |
| Median | 7.9% | 6.4% |
| Interquartile 25% (IQ1) | 6.7% | 5.0% |
| Interquartile 75% (IQ3) | 13.0% | 10.5% |
| Interquartile Range (IQR) | 6.3% | 5.5% |
| Standard Deviation (Sample) | 11.7% | 5.1% |
| Standard Deviation (Population) | 11.6% | 5.1% |
Similar Demographics by Disability Age 5 to 17
Demographics Similar to French by Disability Age 5 to 17
In terms of disability age 5 to 17, the demographic groups most similar to French are Immigrants from Portugal (6.4%, a difference of 0.18%), Immigrants from Dominican Republic (6.4%, a difference of 0.36%), Kiowa (6.4%, a difference of 0.48%), Apache (6.4%, a difference of 0.51%), and Comanche (6.4%, a difference of 0.51%).
| Demographics | Rating | Rank | Disability Age 5 to 17 |
| Bahamians | 0.0 /100 | #307 | Tragic 6.3% |
| Scotch-Irish | 0.0 /100 | #308 | Tragic 6.3% |
| Hmong | 0.0 /100 | #309 | Tragic 6.3% |
| Alaskan Athabascans | 0.0 /100 | #310 | Tragic 6.3% |
| Immigrants | Dominica | 0.0 /100 | #311 | Tragic 6.3% |
| Bermudans | 0.0 /100 | #312 | Tragic 6.4% |
| Apache | 0.0 /100 | #313 | Tragic 6.4% |
| French | 0.0 /100 | #314 | Tragic 6.4% |
| Immigrants | Portugal | 0.0 /100 | #315 | Tragic 6.4% |
| Immigrants | Dominican Republic | 0.0 /100 | #316 | Tragic 6.4% |
| Kiowa | 0.0 /100 | #317 | Tragic 6.4% |
| Comanche | 0.0 /100 | #318 | Tragic 6.4% |
| Delaware | 0.0 /100 | #319 | Tragic 6.5% |
| Africans | 0.0 /100 | #320 | Tragic 6.5% |
| Tohono O'odham | 0.0 /100 | #321 | Tragic 6.5% |
Demographics Similar to Australians by Disability Age 5 to 17
In terms of disability age 5 to 17, the demographic groups most similar to Australians are Immigrants from Ecuador (5.5%, a difference of 0.040%), Hawaiian (5.5%, a difference of 0.060%), Ecuadorian (5.5%, a difference of 0.070%), Immigrants from Costa Rica (5.5%, a difference of 0.070%), and Immigrants from Nepal (5.5%, a difference of 0.12%).
| Demographics | Rating | Rank | Disability Age 5 to 17 |
| Immigrants | Albania | 83.1 /100 | #147 | Excellent 5.5% |
| Samoans | 81.9 /100 | #148 | Excellent 5.5% |
| Central Americans | 81.6 /100 | #149 | Excellent 5.5% |
| Guatemalans | 81.5 /100 | #150 | Excellent 5.5% |
| Estonians | 80.8 /100 | #151 | Excellent 5.5% |
| Ute | 80.6 /100 | #152 | Excellent 5.5% |
| Ecuadorians | 79.7 /100 | #153 | Good 5.5% |
| Australians | 78.8 /100 | #154 | Good 5.5% |
| Immigrants | Ecuador | 78.3 /100 | #155 | Good 5.5% |
| Hawaiians | 78.0 /100 | #156 | Good 5.5% |
| Immigrants | Costa Rica | 77.9 /100 | #157 | Good 5.5% |
| Immigrants | Nepal | 77.1 /100 | #158 | Good 5.5% |
| Immigrants | Zimbabwe | 75.3 /100 | #159 | Good 5.5% |
| South Africans | 73.3 /100 | #160 | Good 5.5% |
| Immigrants | Saudi Arabia | 69.1 /100 | #161 | Good 5.5% |