French vs Asian Disability Age 5 to 17
COMPARE
French
Asian
Disability Age 5 to 17
Disability Age 5 to 17 Comparison
French
Asians
6.4%
DISABILITY AGE 5 TO 17
0.0/ 100
METRIC RATING
314th/ 347
METRIC RANK
4.8%
DISABILITY AGE 5 TO 17
100.0/ 100
METRIC RATING
22nd/ 347
METRIC RANK
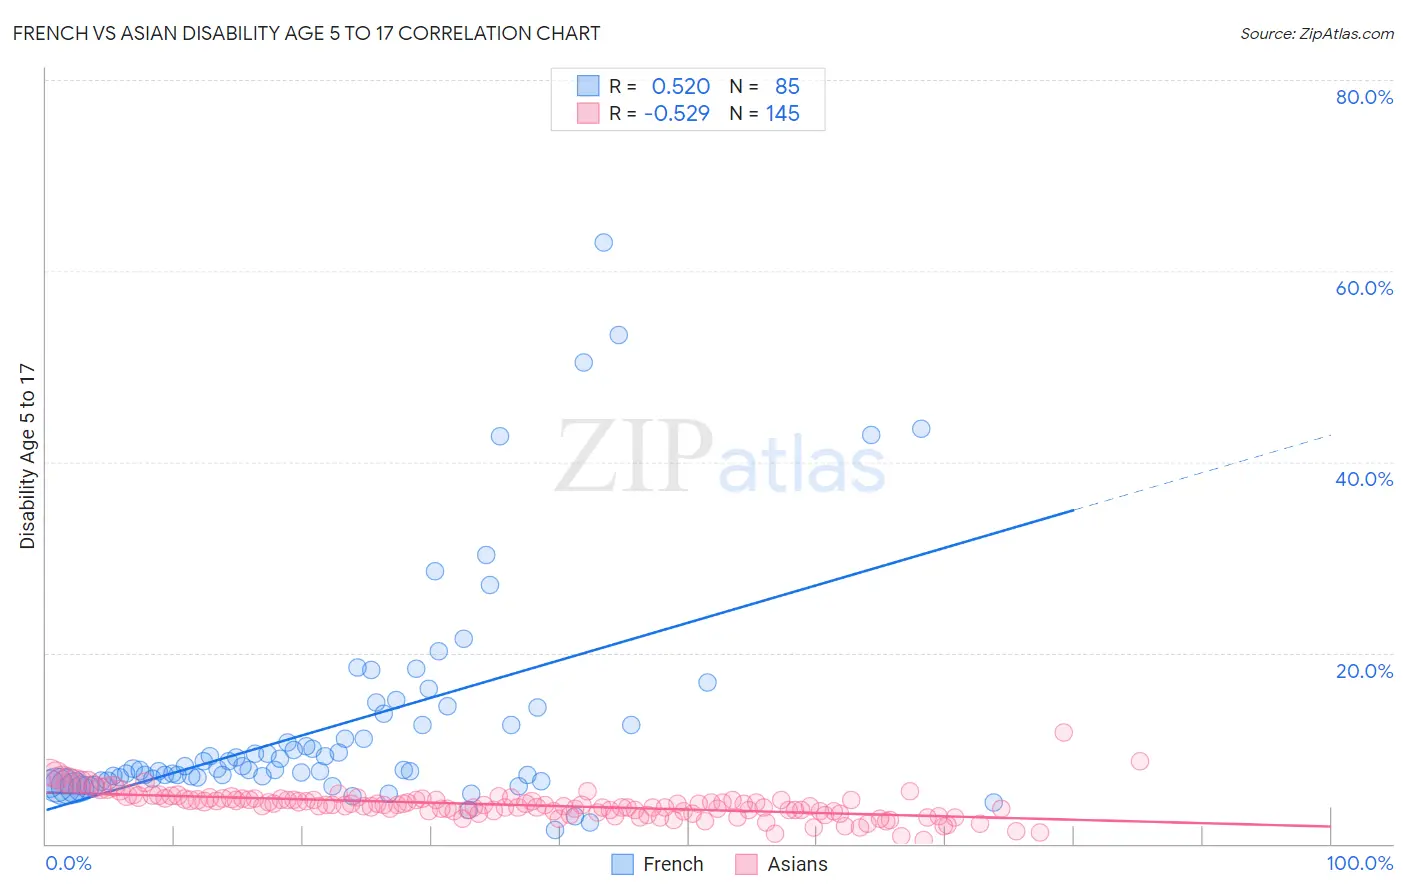
French vs Asian Disability Age 5 to 17 Correlation Chart
The statistical analysis conducted on geographies consisting of 558,470,754 people shows a substantial positive correlation between the proportion of French and percentage of population with a disability between the ages 5 and 17 in the United States with a correlation coefficient (R) of 0.520 and weighted average of 6.4%. Similarly, the statistical analysis conducted on geographies consisting of 540,712,205 people shows a substantial negative correlation between the proportion of Asians and percentage of population with a disability between the ages 5 and 17 in the United States with a correlation coefficient (R) of -0.529 and weighted average of 4.8%, a difference of 33.4%.
Disability Age 5 to 17 Correlation Summary
| Measurement | French | Asian |
| Minimum | 1.4% | 0.35% |
| Maximum | 62.9% | 11.7% |
| Range | 61.5% | 11.3% |
| Mean | 12.5% | 4.1% |
| Median | 7.9% | 4.1% |
| Interquartile 25% (IQ1) | 6.7% | 3.4% |
| Interquartile 75% (IQ3) | 13.0% | 4.7% |
| Interquartile Range (IQR) | 6.3% | 1.3% |
| Standard Deviation (Sample) | 11.7% | 1.5% |
| Standard Deviation (Population) | 11.6% | 1.5% |
Similar Demographics by Disability Age 5 to 17
Demographics Similar to French by Disability Age 5 to 17
In terms of disability age 5 to 17, the demographic groups most similar to French are Immigrants from Portugal (6.4%, a difference of 0.18%), Immigrants from Dominican Republic (6.4%, a difference of 0.36%), Kiowa (6.4%, a difference of 0.48%), Apache (6.4%, a difference of 0.51%), and Comanche (6.4%, a difference of 0.51%).
| Demographics | Rating | Rank | Disability Age 5 to 17 |
| Bahamians | 0.0 /100 | #307 | Tragic 6.3% |
| Scotch-Irish | 0.0 /100 | #308 | Tragic 6.3% |
| Hmong | 0.0 /100 | #309 | Tragic 6.3% |
| Alaskan Athabascans | 0.0 /100 | #310 | Tragic 6.3% |
| Immigrants | Dominica | 0.0 /100 | #311 | Tragic 6.3% |
| Bermudans | 0.0 /100 | #312 | Tragic 6.4% |
| Apache | 0.0 /100 | #313 | Tragic 6.4% |
| French | 0.0 /100 | #314 | Tragic 6.4% |
| Immigrants | Portugal | 0.0 /100 | #315 | Tragic 6.4% |
| Immigrants | Dominican Republic | 0.0 /100 | #316 | Tragic 6.4% |
| Kiowa | 0.0 /100 | #317 | Tragic 6.4% |
| Comanche | 0.0 /100 | #318 | Tragic 6.4% |
| Delaware | 0.0 /100 | #319 | Tragic 6.5% |
| Africans | 0.0 /100 | #320 | Tragic 6.5% |
| Tohono O'odham | 0.0 /100 | #321 | Tragic 6.5% |
Demographics Similar to Asians by Disability Age 5 to 17
In terms of disability age 5 to 17, the demographic groups most similar to Asians are Yup'ik (4.8%, a difference of 0.34%), Burmese (4.8%, a difference of 0.56%), Immigrants from Bolivia (4.8%, a difference of 0.66%), Immigrants from Lebanon (4.8%, a difference of 0.81%), and Immigrants from Asia (4.8%, a difference of 0.92%).
| Demographics | Rating | Rank | Disability Age 5 to 17 |
| Chinese | 100.0 /100 | #15 | Exceptional 4.7% |
| Immigrants | Singapore | 100.0 /100 | #16 | Exceptional 4.7% |
| Arapaho | 100.0 /100 | #17 | Exceptional 4.7% |
| Immigrants | South Central Asia | 100.0 /100 | #18 | Exceptional 4.7% |
| Immigrants | Uzbekistan | 100.0 /100 | #19 | Exceptional 4.8% |
| Burmese | 100.0 /100 | #20 | Exceptional 4.8% |
| Yup'ik | 100.0 /100 | #21 | Exceptional 4.8% |
| Asians | 100.0 /100 | #22 | Exceptional 4.8% |
| Immigrants | Bolivia | 100.0 /100 | #23 | Exceptional 4.8% |
| Immigrants | Lebanon | 100.0 /100 | #24 | Exceptional 4.8% |
| Immigrants | Asia | 100.0 /100 | #25 | Exceptional 4.8% |
| Bhutanese | 100.0 /100 | #26 | Exceptional 4.9% |
| Taiwanese | 100.0 /100 | #27 | Exceptional 4.9% |
| Immigrants | Japan | 100.0 /100 | #28 | Exceptional 4.9% |
| Immigrants | Serbia | 100.0 /100 | #29 | Exceptional 4.9% |