Cherokee College, Under 1 year
COMPARE
Cherokee
Select to Compare
College, Under 1 year
Cherokee College, Under 1 year
60.1%
COLLEGE, UNDER 1 YEAR
0.1/ 100
METRIC RATING
281st/ 347
METRIC RANK
Cherokee College, Under 1 year Correlation Chart
The statistical analysis conducted on geographies consisting of 493,717,865 people shows a moderate negative correlation between the proportion of Cherokee and percentage of population with at least college, under 1 year education in the United States with a correlation coefficient (R) of -0.435 and weighted average of 60.1%. On average, for every 1% (one percent) increase in Cherokee within a typical geography, there is a decrease of 0.20% in percentage of population with at least college, under 1 year education.
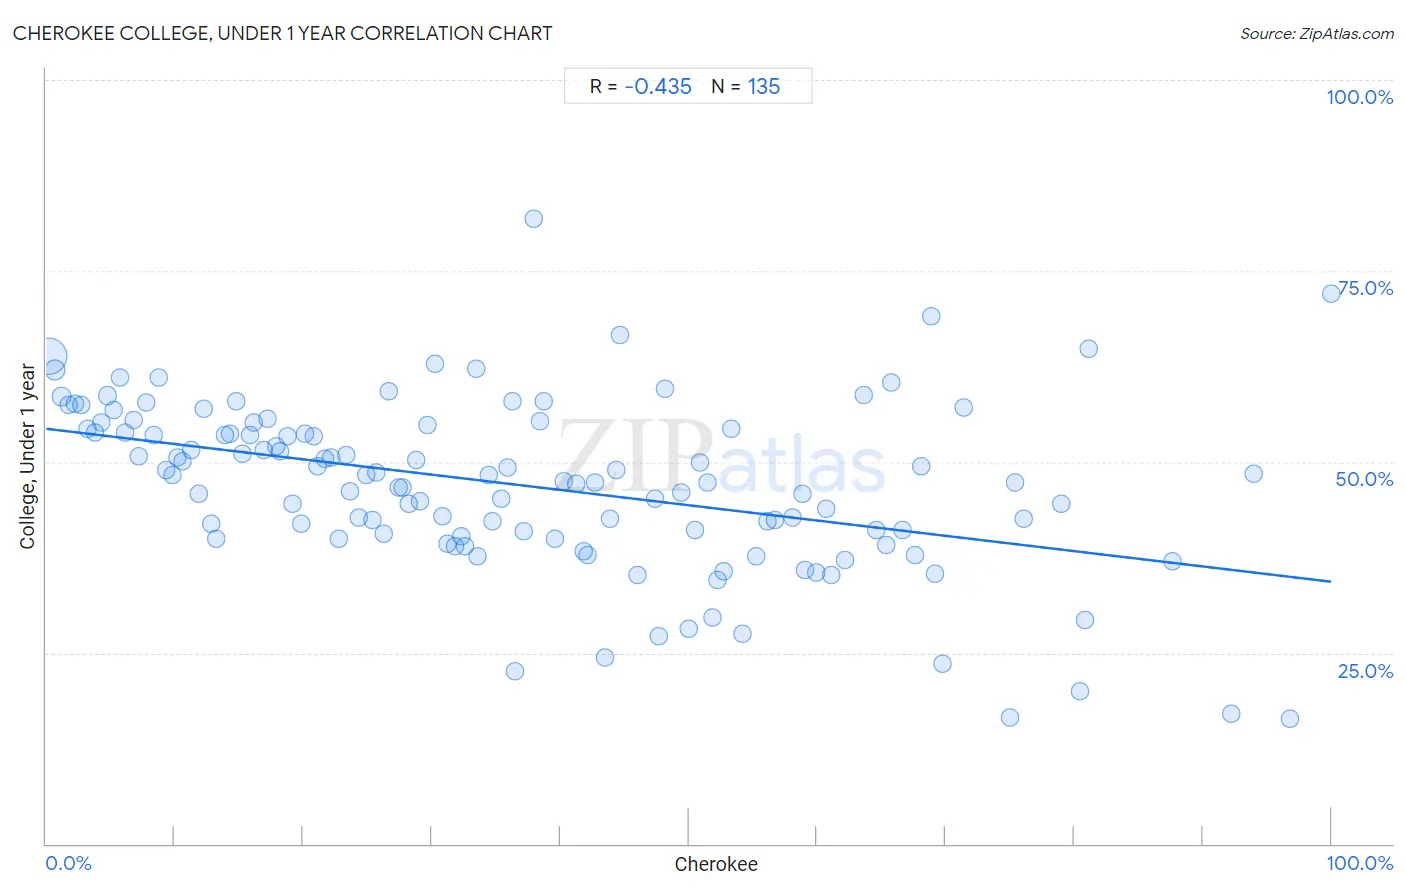
It is essential to understand that the correlation between the percentage of Cherokee and percentage of population with at least college, under 1 year education does not imply a direct cause-and-effect relationship. It remains uncertain whether the presence of Cherokee influences an upward or downward trend in the level of percentage of population with at least college, under 1 year education within an area, or if Cherokee simply ended up residing in those areas with higher or lower levels of percentage of population with at least college, under 1 year education due to other factors.
Demographics Similar to Cherokee by College, Under 1 year
In terms of college, under 1 year, the demographic groups most similar to Cherokee are Belizean (60.1%, a difference of 0.040%), Crow (60.2%, a difference of 0.11%), Ute (60.2%, a difference of 0.20%), Yaqui (60.2%, a difference of 0.21%), and Bahamian (60.3%, a difference of 0.25%).
| Demographics | Rating | Rank | College, Under 1 year |
| Alaska Natives | 0.1 /100 | #274 | Tragic 60.4% |
| Immigrants from Barbados | 0.1 /100 | #275 | Tragic 60.4% |
| Arapaho | 0.1 /100 | #276 | Tragic 60.3% |
| Bahamians | 0.1 /100 | #277 | Tragic 60.3% |
| Yaqui | 0.1 /100 | #278 | Tragic 60.2% |
| Ute | 0.1 /100 | #279 | Tragic 60.2% |
| Crow | 0.1 /100 | #280 | Tragic 60.2% |
| Cherokee | 0.1 /100 | #281 | Tragic 60.1% |
| Belizeans | 0.1 /100 | #282 | Tragic 60.1% |
| Immigrants from Jamaica | 0.0 /100 | #283 | Tragic 59.7% |
| Immigrants from St. Vincent and the Grenadines | 0.0 /100 | #284 | Tragic 59.6% |
| Paiute | 0.0 /100 | #285 | Tragic 59.6% |
| British West Indians | 0.0 /100 | #286 | Tragic 59.5% |
| Sioux | 0.0 /100 | #287 | Tragic 59.4% |
| Blacks/African Americans | 0.0 /100 | #288 | Tragic 59.4% |
Cherokee College, Under 1 year Correlation Summary
| Measurement | Cherokee Data | College, Under 1 year Data |
| Minimum | 0.20% | 16.3% |
| Maximum | 100.0% | 81.8% |
| Range | 99.8% | 65.5% |
| Mean | 37.0% | 46.9% |
| Median | 33.6% | 47.4% |
| Interquartile 25% (IQ1) | 16.9% | 40.3% |
| Interquartile 75% (IQ3) | 54.2% | 54.4% |
| Interquartile Range (IQR) | 37.3% | 14.2% |
| Standard Deviation (Sample) | 24.4% | 11.2% |
| Standard Deviation (Population) | 24.3% | 11.2% |
Correlation Details
| Cherokee Percentile | Sample Size | College, Under 1 year |
[ 0.0% - 0.5% ] 0.20% | 408,475,885 | 63.9% |
[ 0.5% - 1.0% ] 0.68% | 57,660,770 | 62.0% |
[ 1.0% - 1.5% ] 1.19% | 12,067,801 | 58.5% |
[ 1.5% - 2.0% ] 1.74% | 5,811,559 | 57.5% |
[ 2.0% - 2.5% ] 2.22% | 2,737,274 | 57.6% |
[ 2.5% - 3.0% ] 2.72% | 1,566,596 | 57.4% |
[ 3.0% - 3.5% ] 3.23% | 900,576 | 54.4% |
[ 3.5% - 4.0% ] 3.76% | 642,341 | 53.9% |
[ 4.0% - 4.5% ] 4.26% | 412,205 | 55.2% |
[ 4.5% - 5.0% ] 4.79% | 829,632 | 58.7% |
[ 5.0% - 5.5% ] 5.24% | 435,765 | 56.8% |
[ 5.5% - 6.0% ] 5.78% | 380,977 | 61.0% |
[ 6.0% - 6.5% ] 6.17% | 127,869 | 53.9% |
[ 6.5% - 7.0% ] 6.79% | 142,872 | 55.5% |
[ 7.0% - 7.5% ] 7.25% | 156,119 | 50.7% |
[ 7.5% - 8.0% ] 7.76% | 188,955 | 57.8% |
[ 8.0% - 8.5% ] 8.32% | 74,163 | 53.5% |
[ 8.5% - 9.0% ] 8.72% | 107,837 | 61.1% |
[ 9.0% - 9.5% ] 9.29% | 63,061 | 49.0% |
[ 9.5% - 10.0% ] 9.81% | 34,698 | 48.3% |
[ 10.0% - 10.5% ] 10.23% | 56,764 | 50.6% |
[ 10.5% - 11.0% ] 10.65% | 28,225 | 50.1% |
[ 11.0% - 11.5% ] 11.30% | 19,940 | 51.5% |
[ 11.5% - 12.0% ] 11.87% | 22,053 | 45.8% |
[ 12.0% - 12.5% ] 12.21% | 42,830 | 57.0% |
[ 12.5% - 13.0% ] 12.85% | 7,619 | 41.9% |
[ 13.0% - 13.5% ] 13.21% | 11,777 | 40.0% |
[ 13.5% - 14.0% ] 13.88% | 19,032 | 53.6% |
[ 14.0% - 14.5% ] 14.29% | 54,898 | 53.7% |
[ 14.5% - 15.0% ] 14.80% | 48,183 | 58.0% |
[ 15.0% - 15.5% ] 15.29% | 11,791 | 51.1% |
[ 15.5% - 16.0% ] 15.86% | 9,958 | 53.5% |
[ 16.0% - 16.5% ] 16.11% | 41,798 | 55.2% |
[ 16.5% - 17.0% ] 16.89% | 73,263 | 51.6% |
[ 17.0% - 17.5% ] 17.25% | 11,298 | 55.6% |
[ 17.5% - 18.0% ] 17.87% | 8,788 | 52.1% |
[ 18.0% - 18.5% ] 18.17% | 41,497 | 51.3% |
[ 18.5% - 19.0% ] 18.77% | 19,487 | 53.3% |
[ 19.0% - 19.5% ] 19.18% | 2,550 | 44.4% |
[ 19.5% - 20.0% ] 19.83% | 1,039 | 41.9% |
[ 20.0% - 20.5% ] 20.18% | 31,550 | 53.7% |
[ 20.5% - 21.0% ] 20.86% | 20,194 | 53.3% |
[ 21.0% - 21.5% ] 21.13% | 6,274 | 49.4% |
[ 21.5% - 22.0% ] 21.73% | 16,055 | 50.4% |
[ 22.0% - 22.5% ] 22.15% | 5,015 | 50.5% |
[ 22.5% - 23.0% ] 22.77% | 3,966 | 39.9% |
[ 23.0% - 23.5% ] 23.35% | 1,088 | 50.9% |
[ 23.5% - 24.0% ] 23.67% | 5,894 | 46.2% |
[ 24.0% - 24.5% ] 24.28% | 13,446 | 42.7% |
[ 24.5% - 25.0% ] 24.92% | 2,761 | 48.3% |
[ 25.0% - 25.5% ] 25.41% | 18,655 | 42.4% |
[ 25.5% - 26.0% ] 25.66% | 9,859 | 48.6% |
[ 26.0% - 26.5% ] 26.25% | 9,364 | 40.5% |
[ 26.5% - 27.0% ] 26.65% | 1,966 | 59.3% |
[ 27.0% - 27.5% ] 27.42% | 19,203 | 46.7% |
[ 27.5% - 28.0% ] 27.71% | 2,645 | 46.6% |
[ 28.0% - 28.5% ] 28.20% | 3,503 | 44.6% |
[ 28.5% - 29.0% ] 28.75% | 1,965 | 50.2% |
[ 29.0% - 29.5% ] 29.10% | 756 | 44.8% |
[ 29.5% - 30.0% ] 29.70% | 10,864 | 54.8% |
[ 30.0% - 30.5% ] 30.25% | 4,526 | 62.8% |
[ 30.5% - 31.0% ] 30.79% | 7,456 | 42.9% |
[ 31.0% - 31.5% ] 31.19% | 7,973 | 39.4% |
[ 31.5% - 32.0% ] 31.82% | 7,184 | 38.9% |
[ 32.0% - 32.5% ] 32.26% | 496 | 40.3% |
[ 32.5% - 33.0% ] 32.62% | 2,400 | 38.9% |
[ 33.0% - 33.5% ] 33.48% | 17,036 | 62.3% |
[ 33.5% - 34.0% ] 33.55% | 1,523 | 37.6% |
[ 34.0% - 34.5% ] 34.48% | 145 | 48.2% |
[ 34.5% - 35.0% ] 34.71% | 4,500 | 42.2% |
[ 35.0% - 35.5% ] 35.41% | 6,806 | 45.1% |
[ 35.5% - 36.0% ] 35.87% | 12,277 | 49.3% |
[ 36.0% - 36.5% ] 36.29% | 350 | 58.0% |
[ 36.5% - 37.0% ] 36.52% | 827 | 22.6% |
[ 37.0% - 37.5% ] 37.17% | 460 | 40.9% |
[ 37.5% - 38.0% ] 37.98% | 258 | 81.8% |
[ 38.0% - 38.5% ] 38.41% | 3,697 | 55.3% |
[ 38.5% - 39.0% ] 38.70% | 32,497 | 57.9% |
[ 39.5% - 40.0% ] 39.57% | 4,554 | 39.9% |
[ 40.0% - 40.5% ] 40.30% | 6,767 | 47.4% |
[ 41.0% - 41.5% ] 41.24% | 1,295 | 47.1% |
[ 41.5% - 42.0% ] 41.82% | 3,300 | 38.3% |
[ 42.0% - 42.5% ] 42.16% | 268 | 37.8% |
[ 42.5% - 43.0% ] 42.74% | 1,577 | 47.4% |
[ 43.0% - 43.5% ] 43.48% | 69 | 24.5% |
[ 43.5% - 44.0% ] 43.89% | 540 | 42.5% |
[ 44.0% - 44.5% ] 44.40% | 696 | 48.9% |
[ 44.5% - 45.0% ] 44.68% | 47 | 66.7% |
[ 46.0% - 46.5% ] 46.05% | 2,999 | 35.1% |
[ 47.0% - 47.5% ] 47.41% | 2,871 | 45.2% |
[ 47.5% - 48.0% ] 47.66% | 770 | 27.2% |
[ 48.0% - 48.5% ] 48.19% | 83 | 59.6% |
[ 49.0% - 49.5% ] 49.41% | 4,795 | 46.0% |
[ 50.0% - 50.5% ] 50.00% | 230 | 28.2% |
[ 50.0% - 50.5% ] 50.45% | 333 | 41.1% |
[ 50.5% - 51.0% ] 50.84% | 1,548 | 49.9% |
[ 51.0% - 51.5% ] 51.48% | 270 | 47.3% |
[ 51.5% - 52.0% ] 51.89% | 318 | 29.5% |
[ 52.0% - 52.5% ] 52.22% | 203 | 34.5% |
[ 52.5% - 53.0% ] 52.71% | 4,635 | 35.7% |
[ 53.0% - 53.5% ] 53.31% | 1,467 | 54.3% |
[ 54.0% - 54.5% ] 54.22% | 249 | 27.6% |
[ 55.0% - 55.5% ] 55.25% | 1,171 | 37.7% |
[ 56.0% - 56.5% ] 56.15% | 1,464 | 42.2% |
[ 56.5% - 57.0% ] 56.76% | 37 | 42.4% |
[ 58.0% - 58.5% ] 58.05% | 348 | 42.7% |
[ 58.5% - 59.0% ] 58.84% | 413 | 45.8% |
[ 59.0% - 59.5% ] 59.09% | 12,720 | 35.9% |
[ 59.5% - 60.0% ] 59.93% | 277 | 35.5% |
[ 60.5% - 61.0% ] 60.66% | 183 | 43.8% |
[ 61.0% - 61.5% ] 61.05% | 95 | 35.2% |
[ 62.0% - 62.5% ] 62.11% | 322 | 37.1% |
[ 63.5% - 64.0% ] 63.61% | 327 | 58.8% |
[ 64.5% - 65.0% ] 64.55% | 330 | 41.1% |
[ 65.0% - 65.5% ] 65.38% | 598 | 39.1% |
[ 65.5% - 66.0% ] 65.79% | 76 | 60.3% |
[ 66.5% - 67.0% ] 66.59% | 416 | 41.0% |
[ 67.5% - 68.0% ] 67.61% | 71 | 37.9% |
[ 68.0% - 68.5% ] 68.07% | 570 | 49.5% |
[ 68.5% - 69.0% ] 68.84% | 138 | 69.0% |
[ 69.0% - 69.5% ] 69.19% | 1,279 | 35.4% |
[ 69.5% - 70.0% ] 69.72% | 535 | 23.5% |
[ 71.0% - 71.5% ] 71.43% | 21 | 57.1% |
[ 75.0% - 75.5% ] 75.00% | 664 | 16.5% |
[ 75.0% - 75.5% ] 75.43% | 1,795 | 47.3% |
[ 76.0% - 76.5% ] 76.10% | 410 | 42.6% |
[ 79.0% - 79.5% ] 79.03% | 7,023 | 44.5% |
[ 80.0% - 80.5% ] 80.43% | 46 | 20.0% |
[ 80.5% - 81.0% ] 80.85% | 726 | 29.3% |
[ 81.0% - 81.5% ] 81.08% | 37 | 64.9% |
[ 87.5% - 88.0% ] 87.63% | 97 | 36.9% |
[ 92.0% - 92.5% ] 92.21% | 154 | 16.9% |
[ 93.5% - 94.0% ] 93.94% | 66 | 48.4% |
[ 96.5% - 97.0% ] 96.79% | 343 | 16.3% |
[ 99.5% - 100.0% ] 100.00% | 50 | 72.0% |