Cherokee Disability Age Under 5
COMPARE
Cherokee
Select to Compare
Disability Age Under 5
Cherokee Disability Age Under 5
1.8%
DISABILITY | AGE UNDER 5
0.0/ 100
METRIC RATING
324th/ 347
METRIC RANK
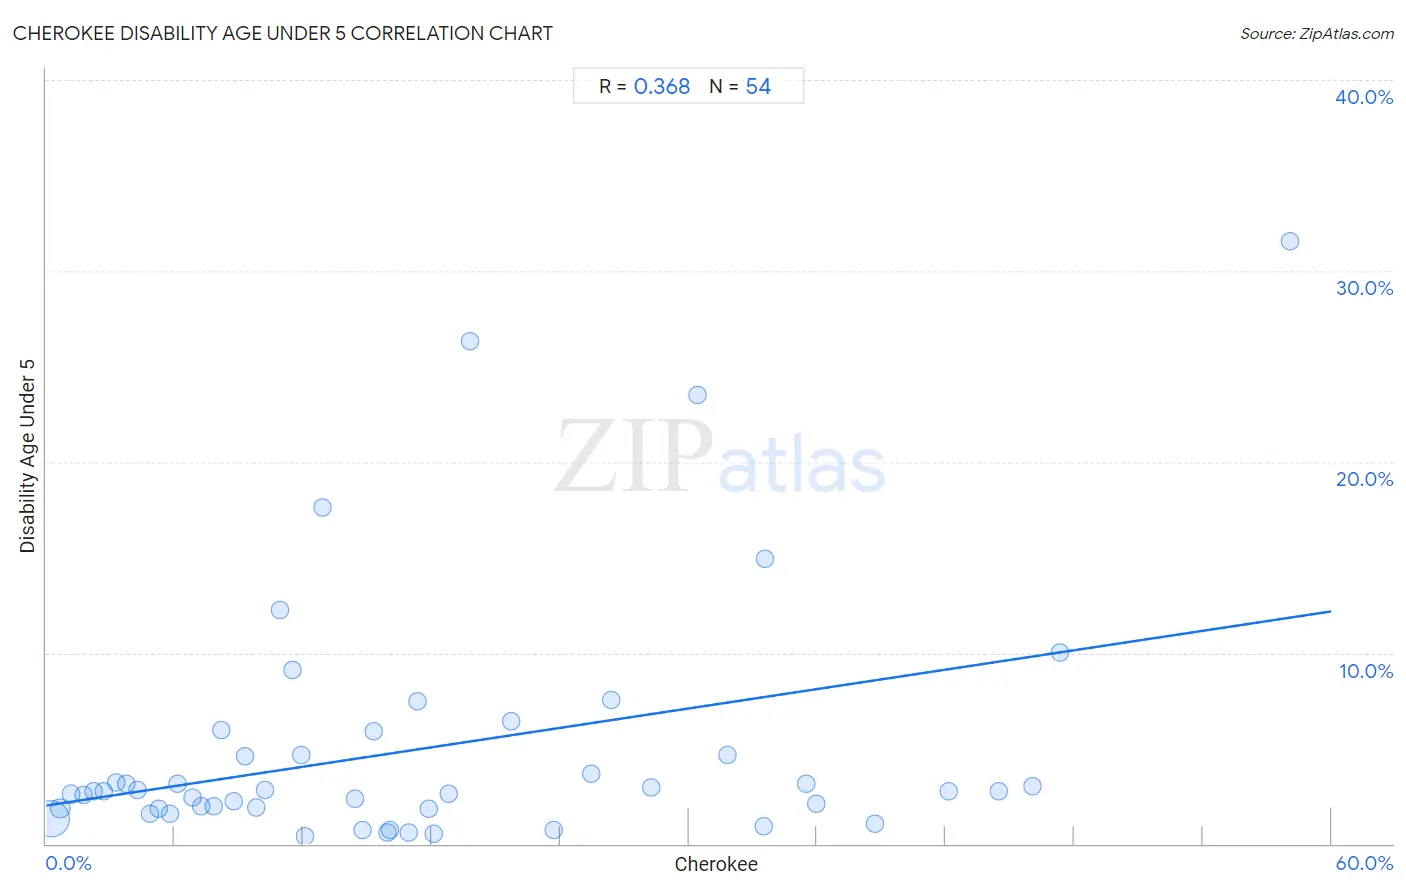
Cherokee Disability Age Under 5 Correlation Chart
The statistical analysis conducted on geographies consisting of 245,498,601 people shows a mild positive correlation between the proportion of Cherokee and percentage of population with a disability under the age of 5 in the United States with a correlation coefficient (R) of 0.368 and weighted average of 1.8%. On average, for every 1% (one percent) increase in Cherokee within a typical geography, there is an increase of 0.17% in percentage of population with a disability under the age of 5.
It is essential to understand that the correlation between the percentage of Cherokee and percentage of population with a disability under the age of 5 does not imply a direct cause-and-effect relationship. It remains uncertain whether the presence of Cherokee influences an upward or downward trend in the level of percentage of population with a disability under the age of 5 within an area, or if Cherokee simply ended up residing in those areas with higher or lower levels of percentage of population with a disability under the age of 5 due to other factors.
Demographics Similar to Cherokee by Disability Age Under 5
In terms of disability age under 5, the demographic groups most similar to Cherokee are Immigrants from Portugal (1.8%, a difference of 1.3%), Chickasaw (1.7%, a difference of 1.8%), Sioux (1.8%, a difference of 2.8%), German (1.7%, a difference of 2.9%), and Osage (1.8%, a difference of 3.2%).
| Demographics | Rating | Rank | Disability Age Under 5 |
| French | 0.0 /100 | #317 | Tragic 1.7% |
| Irish | 0.0 /100 | #318 | Tragic 1.7% |
| Slovaks | 0.0 /100 | #319 | Tragic 1.7% |
| Scotch-Irish | 0.0 /100 | #320 | Tragic 1.7% |
| Ottawa | 0.0 /100 | #321 | Tragic 1.7% |
| Germans | 0.0 /100 | #322 | Tragic 1.7% |
| Chickasaw | 0.0 /100 | #323 | Tragic 1.7% |
| Cherokee | 0.0 /100 | #324 | Tragic 1.8% |
| Immigrants from Portugal | 0.0 /100 | #325 | Tragic 1.8% |
| Sioux | 0.0 /100 | #326 | Tragic 1.8% |
| Osage | 0.0 /100 | #327 | Tragic 1.8% |
| Americans | 0.0 /100 | #328 | Tragic 1.9% |
| Houma | 0.0 /100 | #329 | Tragic 1.9% |
| Choctaw | 0.0 /100 | #330 | Tragic 1.9% |
| French Canadians | 0.0 /100 | #331 | Tragic 1.9% |
Cherokee Disability Age Under 5 Correlation Summary
| Measurement | Cherokee Data | Disability Age Under 5 Data |
| Minimum | 0.21% | 0.42% |
| Maximum | 58.0% | 31.6% |
| Range | 57.8% | 31.2% |
| Mean | 17.7% | 5.0% |
| Median | 14.6% | 2.8% |
| Interquartile 25% (IQ1) | 6.8% | 1.9% |
| Interquartile 75% (IQ3) | 26.4% | 4.7% |
| Interquartile Range (IQR) | 19.6% | 2.8% |
| Standard Deviation (Sample) | 14.1% | 6.5% |
| Standard Deviation (Population) | 14.0% | 6.4% |
Correlation Details
| Cherokee Percentile | Sample Size | Disability Age Under 5 |
[ 0.0% - 0.5% ] 0.21% | 212,427,686 | 1.3% |
[ 0.5% - 1.0% ] 0.67% | 23,054,230 | 1.9% |
[ 1.0% - 1.5% ] 1.17% | 4,121,401 | 2.6% |
[ 1.5% - 2.0% ] 1.76% | 1,869,101 | 2.5% |
[ 2.0% - 2.5% ] 2.23% | 944,939 | 2.8% |
[ 2.5% - 3.0% ] 2.69% | 563,157 | 2.8% |
[ 3.0% - 3.5% ] 3.25% | 254,117 | 3.2% |
[ 3.5% - 4.0% ] 3.72% | 180,300 | 3.2% |
[ 4.0% - 4.5% ] 4.25% | 153,793 | 2.8% |
[ 4.5% - 5.0% ] 4.82% | 579,352 | 1.5% |
[ 5.0% - 5.5% ] 5.25% | 288,372 | 1.8% |
[ 5.5% - 6.0% ] 5.77% | 219,313 | 1.6% |
[ 6.0% - 6.5% ] 6.11% | 75,604 | 3.2% |
[ 6.5% - 7.0% ] 6.80% | 78,411 | 2.4% |
[ 7.0% - 7.5% ] 7.24% | 57,749 | 1.9% |
[ 7.5% - 8.0% ] 7.79% | 89,148 | 2.0% |
[ 8.0% - 8.5% ] 8.18% | 9,140 | 6.0% |
[ 8.5% - 9.0% ] 8.73% | 82,983 | 2.2% |
[ 9.0% - 9.5% ] 9.28% | 38,156 | 4.6% |
[ 9.5% - 10.0% ] 9.80% | 9,946 | 1.9% |
[ 10.0% - 10.5% ] 10.24% | 28,594 | 2.8% |
[ 10.5% - 11.0% ] 10.94% | 1,966 | 12.2% |
[ 11.0% - 11.5% ] 11.47% | 2,031 | 9.1% |
[ 11.5% - 12.0% ] 11.92% | 10,469 | 4.7% |
[ 12.0% - 12.5% ] 12.08% | 22,698 | 0.42% |
[ 12.5% - 13.0% ] 12.88% | 4,590 | 17.6% |
[ 14.0% - 14.5% ] 14.40% | 24,491 | 2.3% |
[ 14.5% - 15.0% ] 14.77% | 31,945 | 0.72% |
[ 15.0% - 15.5% ] 15.30% | 9,659 | 5.9% |
[ 15.5% - 16.0% ] 15.93% | 2,906 | 0.62% |
[ 16.0% - 16.5% ] 16.07% | 34,582 | 0.72% |
[ 16.5% - 17.0% ] 16.91% | 65,774 | 0.57% |
[ 17.0% - 17.5% ] 17.32% | 7,113 | 7.4% |
[ 17.5% - 18.0% ] 17.85% | 3,439 | 1.9% |
[ 18.0% - 18.5% ] 18.09% | 25,416 | 0.54% |
[ 18.5% - 19.0% ] 18.77% | 17,979 | 2.6% |
[ 19.5% - 20.0% ] 19.76% | 577 | 26.3% |
[ 21.5% - 22.0% ] 21.69% | 10,145 | 6.4% |
[ 23.5% - 24.0% ] 23.67% | 1,783 | 0.72% |
[ 25.0% - 25.5% ] 25.43% | 17,205 | 3.7% |
[ 26.0% - 26.5% ] 26.38% | 2,559 | 7.5% |
[ 28.0% - 28.5% ] 28.27% | 1,914 | 2.9% |
[ 30.0% - 30.5% ] 30.42% | 286 | 23.5% |
[ 31.5% - 32.0% ] 31.83% | 6,309 | 4.7% |
[ 33.0% - 33.5% ] 33.49% | 16,782 | 0.94% |
[ 33.5% - 34.0% ] 33.55% | 1,368 | 14.9% |
[ 35.0% - 35.5% ] 35.48% | 5,412 | 3.1% |
[ 35.5% - 36.0% ] 35.96% | 7,895 | 2.1% |
[ 38.5% - 39.0% ] 38.69% | 30,812 | 1.1% |
[ 42.0% - 42.5% ] 42.16% | 268 | 2.8% |
[ 44.0% - 44.5% ] 44.47% | 389 | 2.8% |
[ 46.0% - 46.5% ] 46.03% | 2,900 | 3.0% |
[ 47.0% - 47.5% ] 47.32% | 1,099 | 10.0% |
[ 58.0% - 58.5% ] 58.05% | 348 | 31.6% |