Cherokee Disability
COMPARE
Cherokee
Select to Compare
Disability
Cherokee Disability
14.8%
DISABILITY
0.0/ 100
METRIC RATING
336th/ 347
METRIC RANK
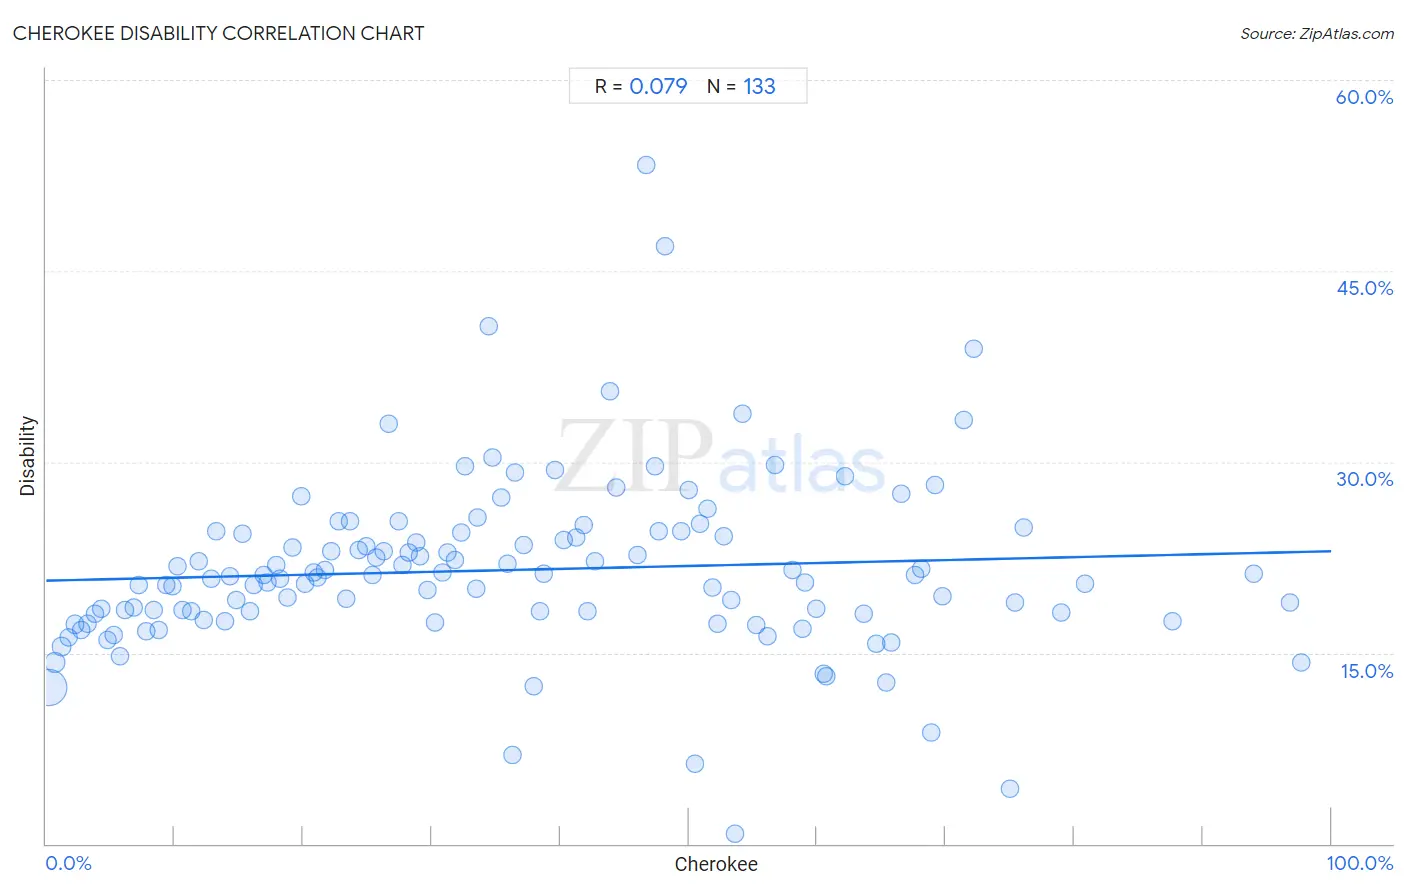
Cherokee Disability Correlation Chart
The statistical analysis conducted on geographies consisting of 493,590,600 people shows a slight positive correlation between the proportion of Cherokee and percentage of population with a disability in the United States with a correlation coefficient (R) of 0.079 and weighted average of 14.8%. On average, for every 1% (one percent) increase in Cherokee within a typical geography, there is an increase of 0.023% in percentage of population with a disability.
It is essential to understand that the correlation between the percentage of Cherokee and percentage of population with a disability does not imply a direct cause-and-effect relationship. It remains uncertain whether the presence of Cherokee influences an upward or downward trend in the level of percentage of population with a disability within an area, or if Cherokee simply ended up residing in those areas with higher or lower levels of percentage of population with a disability due to other factors.
Demographics Similar to Cherokee by Disability
In terms of disability, the demographic groups most similar to Cherokee are Seminole (14.9%, a difference of 0.090%), Dutch West Indian (14.9%, a difference of 0.39%), Tohono O'odham (14.8%, a difference of 0.51%), Yuman (14.6%, a difference of 1.5%), and Cajun (14.6%, a difference of 1.7%).
| Demographics | Rating | Rank | Disability |
| Potawatomi | 0.0 /100 | #329 | Tragic 14.2% |
| Navajo | 0.0 /100 | #330 | Tragic 14.3% |
| Alaskan Athabascans | 0.0 /100 | #331 | Tragic 14.4% |
| Pueblo | 0.0 /100 | #332 | Tragic 14.4% |
| Cajuns | 0.0 /100 | #333 | Tragic 14.6% |
| Yuman | 0.0 /100 | #334 | Tragic 14.6% |
| Tohono O'odham | 0.0 /100 | #335 | Tragic 14.8% |
| Cherokee | 0.0 /100 | #336 | Tragic 14.8% |
| Seminole | 0.0 /100 | #337 | Tragic 14.9% |
| Dutch West Indians | 0.0 /100 | #338 | Tragic 14.9% |
| Chickasaw | 0.0 /100 | #339 | Tragic 15.2% |
| Choctaw | 0.0 /100 | #340 | Tragic 15.4% |
| Lumbee | 0.0 /100 | #341 | Tragic 15.5% |
| Kiowa | 0.0 /100 | #342 | Tragic 15.6% |
| Creek | 0.0 /100 | #343 | Tragic 15.6% |
Cherokee Disability Correlation Summary
| Measurement | Cherokee Data | Disability Data |
| Minimum | 0.20% | 0.80% |
| Maximum | 97.6% | 53.3% |
| Range | 97.4% | 52.5% |
| Mean | 36.3% | 21.5% |
| Median | 33.5% | 21.0% |
| Interquartile 25% (IQ1) | 16.5% | 18.0% |
| Interquartile 75% (IQ3) | 53.5% | 24.4% |
| Interquartile Range (IQR) | 37.0% | 6.4% |
| Standard Deviation (Sample) | 23.7% | 6.9% |
| Standard Deviation (Population) | 23.6% | 6.9% |
Correlation Details
| Cherokee Percentile | Sample Size | Disability |
[ 0.0% - 0.5% ] 0.20% | 408,440,928 | 12.3% |
[ 0.5% - 1.0% ] 0.68% | 57,642,327 | 14.3% |
[ 1.0% - 1.5% ] 1.19% | 12,037,661 | 15.5% |
[ 1.5% - 2.0% ] 1.74% | 5,800,158 | 16.2% |
[ 2.0% - 2.5% ] 2.22% | 2,727,268 | 17.2% |
[ 2.5% - 3.0% ] 2.72% | 1,560,499 | 16.8% |
[ 3.0% - 3.5% ] 3.23% | 897,157 | 17.3% |
[ 3.5% - 4.0% ] 3.76% | 641,149 | 18.0% |
[ 4.0% - 4.5% ] 4.26% | 411,740 | 18.5% |
[ 4.5% - 5.0% ] 4.79% | 826,199 | 16.0% |
[ 5.0% - 5.5% ] 5.24% | 434,952 | 16.4% |
[ 5.5% - 6.0% ] 5.78% | 379,363 | 14.7% |
[ 6.0% - 6.5% ] 6.16% | 125,974 | 18.4% |
[ 6.5% - 7.0% ] 6.79% | 141,371 | 18.6% |
[ 7.0% - 7.5% ] 7.25% | 156,049 | 20.3% |
[ 7.5% - 8.0% ] 7.76% | 188,648 | 16.7% |
[ 8.0% - 8.5% ] 8.32% | 74,092 | 18.4% |
[ 8.5% - 9.0% ] 8.72% | 107,837 | 16.8% |
[ 9.0% - 9.5% ] 9.29% | 62,462 | 20.3% |
[ 9.5% - 10.0% ] 9.81% | 34,698 | 20.2% |
[ 10.0% - 10.5% ] 10.23% | 56,764 | 21.8% |
[ 10.5% - 11.0% ] 10.65% | 28,132 | 18.4% |
[ 11.0% - 11.5% ] 11.30% | 19,887 | 18.3% |
[ 11.5% - 12.0% ] 11.87% | 22,053 | 22.2% |
[ 12.0% - 12.5% ] 12.21% | 42,830 | 17.5% |
[ 12.5% - 13.0% ] 12.85% | 7,619 | 20.8% |
[ 13.0% - 13.5% ] 13.21% | 11,935 | 24.6% |
[ 13.5% - 14.0% ] 13.88% | 19,032 | 17.5% |
[ 14.0% - 14.5% ] 14.29% | 54,884 | 21.0% |
[ 14.5% - 15.0% ] 14.80% | 48,012 | 19.1% |
[ 15.0% - 15.5% ] 15.29% | 11,791 | 24.4% |
[ 15.5% - 16.0% ] 15.86% | 9,926 | 18.2% |
[ 16.0% - 16.5% ] 16.11% | 41,798 | 20.3% |
[ 16.5% - 17.0% ] 16.89% | 73,263 | 21.2% |
[ 17.0% - 17.5% ] 17.25% | 11,298 | 20.5% |
[ 17.5% - 18.0% ] 17.87% | 8,788 | 21.9% |
[ 18.0% - 18.5% ] 18.17% | 41,497 | 20.8% |
[ 18.5% - 19.0% ] 18.77% | 19,487 | 19.3% |
[ 19.0% - 19.5% ] 19.17% | 2,332 | 23.3% |
[ 19.5% - 20.0% ] 19.83% | 1,039 | 27.3% |
[ 20.0% - 20.5% ] 20.18% | 31,550 | 20.5% |
[ 20.5% - 21.0% ] 20.86% | 20,194 | 21.3% |
[ 21.0% - 21.5% ] 21.13% | 6,274 | 20.9% |
[ 21.5% - 22.0% ] 21.73% | 16,055 | 21.5% |
[ 22.0% - 22.5% ] 22.15% | 5,015 | 23.0% |
[ 22.5% - 23.0% ] 22.77% | 3,966 | 25.3% |
[ 23.0% - 23.5% ] 23.35% | 1,088 | 19.3% |
[ 23.5% - 24.0% ] 23.67% | 5,894 | 25.3% |
[ 24.0% - 24.5% ] 24.28% | 13,446 | 23.1% |
[ 24.5% - 25.0% ] 24.92% | 2,749 | 23.4% |
[ 25.0% - 25.5% ] 25.41% | 18,655 | 21.1% |
[ 25.5% - 26.0% ] 25.66% | 9,859 | 22.4% |
[ 26.0% - 26.5% ] 26.25% | 9,326 | 23.0% |
[ 26.5% - 27.0% ] 26.65% | 1,966 | 33.0% |
[ 27.0% - 27.5% ] 27.42% | 19,203 | 25.3% |
[ 27.5% - 28.0% ] 27.71% | 2,645 | 21.9% |
[ 28.0% - 28.5% ] 28.20% | 3,503 | 22.8% |
[ 28.5% - 29.0% ] 28.75% | 1,965 | 23.7% |
[ 29.0% - 29.5% ] 29.10% | 756 | 22.6% |
[ 29.5% - 30.0% ] 29.70% | 10,864 | 20.0% |
[ 30.0% - 30.5% ] 30.25% | 4,503 | 17.4% |
[ 30.5% - 31.0% ] 30.79% | 7,456 | 21.4% |
[ 31.0% - 31.5% ] 31.19% | 7,973 | 22.9% |
[ 31.5% - 32.0% ] 31.82% | 7,184 | 22.3% |
[ 32.0% - 32.5% ] 32.26% | 592 | 24.5% |
[ 32.5% - 33.0% ] 32.62% | 2,400 | 29.7% |
[ 33.0% - 33.5% ] 33.48% | 17,036 | 20.1% |
[ 33.5% - 34.0% ] 33.55% | 1,523 | 25.6% |
[ 34.0% - 34.5% ] 34.48% | 145 | 40.7% |
[ 34.5% - 35.0% ] 34.71% | 4,500 | 30.4% |
[ 35.0% - 35.5% ] 35.41% | 6,806 | 27.2% |
[ 35.5% - 36.0% ] 35.87% | 12,277 | 22.0% |
[ 36.0% - 36.5% ] 36.28% | 317 | 6.9% |
[ 36.5% - 37.0% ] 36.52% | 827 | 29.1% |
[ 37.0% - 37.5% ] 37.17% | 460 | 23.5% |
[ 37.5% - 38.0% ] 37.98% | 258 | 12.4% |
[ 38.0% - 38.5% ] 38.41% | 3,697 | 18.3% |
[ 38.5% - 39.0% ] 38.70% | 32,497 | 21.2% |
[ 39.5% - 40.0% ] 39.57% | 4,554 | 29.4% |
[ 40.0% - 40.5% ] 40.30% | 6,665 | 23.9% |
[ 41.0% - 41.5% ] 41.24% | 1,295 | 24.1% |
[ 41.5% - 42.0% ] 41.82% | 3,300 | 25.1% |
[ 42.0% - 42.5% ] 42.16% | 268 | 18.3% |
[ 42.5% - 43.0% ] 42.74% | 1,577 | 22.2% |
[ 43.5% - 44.0% ] 43.89% | 540 | 35.6% |
[ 44.0% - 44.5% ] 44.40% | 696 | 28.0% |
[ 46.0% - 46.5% ] 46.05% | 2,999 | 22.7% |
[ 46.5% - 47.0% ] 46.67% | 15 | 53.3% |
[ 47.0% - 47.5% ] 47.41% | 2,871 | 29.7% |
[ 47.5% - 48.0% ] 47.66% | 770 | 24.5% |
[ 48.0% - 48.5% ] 48.19% | 83 | 47.0% |
[ 49.0% - 49.5% ] 49.41% | 4,795 | 24.6% |
[ 50.0% - 50.5% ] 50.00% | 230 | 27.8% |
[ 50.0% - 50.5% ] 50.45% | 333 | 6.3% |
[ 50.5% - 51.0% ] 50.84% | 1,548 | 25.1% |
[ 51.0% - 51.5% ] 51.48% | 270 | 26.3% |
[ 51.5% - 52.0% ] 51.89% | 318 | 20.1% |
[ 52.0% - 52.5% ] 52.22% | 203 | 17.2% |
[ 52.5% - 53.0% ] 52.71% | 4,635 | 24.1% |
[ 53.0% - 53.5% ] 53.31% | 1,467 | 19.2% |
[ 53.5% - 54.0% ] 53.60% | 125 | 0.80% |
[ 54.0% - 54.5% ] 54.22% | 249 | 33.7% |
[ 55.0% - 55.5% ] 55.25% | 1,171 | 17.2% |
[ 56.0% - 56.5% ] 56.15% | 1,464 | 16.3% |
[ 56.5% - 57.0% ] 56.76% | 37 | 29.7% |
[ 58.0% - 58.5% ] 58.05% | 348 | 21.6% |
[ 58.5% - 59.0% ] 58.84% | 413 | 16.9% |
[ 59.0% - 59.5% ] 59.09% | 12,720 | 20.5% |
[ 59.5% - 60.0% ] 59.93% | 277 | 18.5% |
[ 60.0% - 60.5% ] 60.47% | 172 | 13.4% |
[ 60.5% - 61.0% ] 60.66% | 183 | 13.1% |
[ 62.0% - 62.5% ] 62.11% | 322 | 28.9% |
[ 63.5% - 64.0% ] 63.61% | 327 | 18.0% |
[ 64.5% - 65.0% ] 64.55% | 330 | 15.8% |
[ 65.0% - 65.5% ] 65.38% | 598 | 12.7% |
[ 65.5% - 66.0% ] 65.79% | 76 | 15.8% |
[ 66.5% - 67.0% ] 66.58% | 386 | 27.5% |
[ 67.5% - 68.0% ] 67.61% | 71 | 21.1% |
[ 68.0% - 68.5% ] 68.07% | 570 | 21.6% |
[ 68.5% - 69.0% ] 68.84% | 138 | 8.7% |
[ 69.0% - 69.5% ] 69.19% | 1,279 | 28.2% |
[ 69.5% - 70.0% ] 69.72% | 535 | 19.4% |
[ 71.0% - 71.5% ] 71.43% | 21 | 33.3% |
[ 72.0% - 72.5% ] 72.22% | 36 | 38.9% |
[ 75.0% - 75.5% ] 75.00% | 664 | 4.4% |
[ 75.0% - 75.5% ] 75.43% | 1,795 | 19.0% |
[ 76.0% - 76.5% ] 76.10% | 410 | 24.9% |
[ 79.0% - 79.5% ] 79.02% | 6,854 | 18.2% |
[ 80.5% - 81.0% ] 80.85% | 726 | 20.4% |
[ 87.5% - 88.0% ] 87.63% | 97 | 17.5% |
[ 93.5% - 94.0% ] 93.94% | 66 | 21.2% |
[ 96.5% - 97.0% ] 96.79% | 343 | 19.0% |
[ 97.5% - 98.0% ] 97.62% | 42 | 14.3% |