Cherokee Unemployment Among Women with Children Ages 6 to 17 years
COMPARE
Cherokee
Select to Compare
Unemployment Among Women with Children Ages 6 to 17 years
Cherokee Unemployment Among Women with Children Ages 6 to 17 years
10.0%
UNEMPLOYMENT | WOMEN W/ CHILDREN 6 TO 17
0.0/ 100
METRIC RATING
295th/ 347
METRIC RANK
Cherokee Unemployment Among Women with Children Ages 6 to 17 years Correlation Chart
The statistical analysis conducted on geographies consisting of 331,434,739 people shows a moderate positive correlation between the proportion of Cherokee and unemployment rate among women with children between the ages 6 and 17 in the United States with a correlation coefficient (R) of 0.422 and weighted average of 10.0%. On average, for every 1% (one percent) increase in Cherokee within a typical geography, there is an increase of 0.48% in unemployment rate among women with children between the ages 6 and 17.
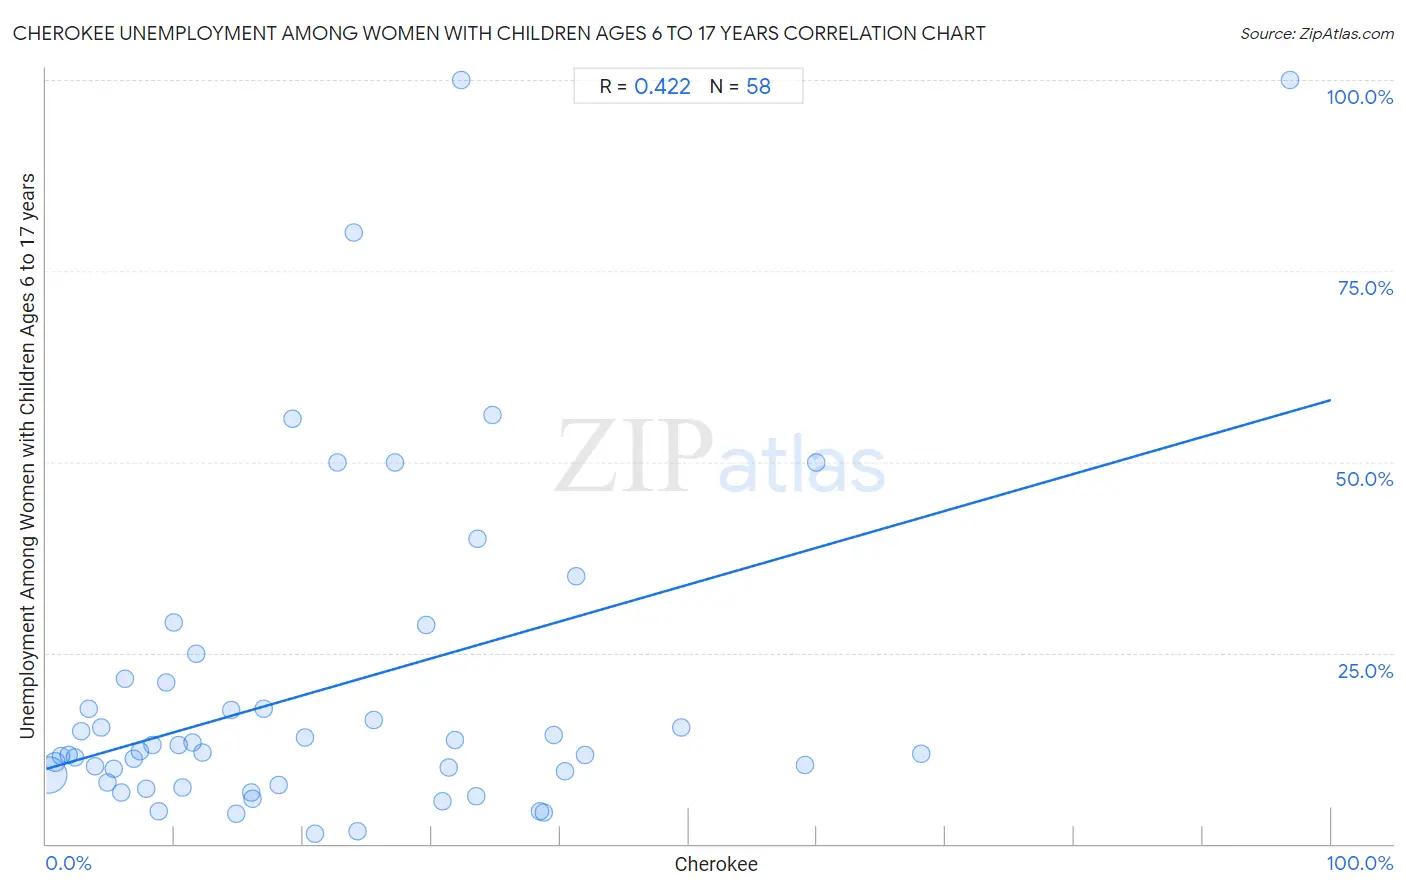
It is essential to understand that the correlation between the percentage of Cherokee and unemployment rate among women with children between the ages 6 and 17 does not imply a direct cause-and-effect relationship. It remains uncertain whether the presence of Cherokee influences an upward or downward trend in the level of unemployment rate among women with children between the ages 6 and 17 within an area, or if Cherokee simply ended up residing in those areas with higher or lower levels of unemployment rate among women with children between the ages 6 and 17 due to other factors.
Demographics Similar to Cherokee by Unemployment Among Women with Children Ages 6 to 17 years
In terms of unemployment among women with children ages 6 to 17 years, the demographic groups most similar to Cherokee are Ecuadorian (10.0%, a difference of 0.030%), Haitian (10.0%, a difference of 0.13%), Carpatho Rusyn (10.0%, a difference of 0.22%), Nonimmigrants (10.0%, a difference of 0.23%), and Subsaharan African (10.0%, a difference of 0.25%).
| Demographics | Rating | Rank | Unemployment Among Women with Children Ages 6 to 17 years |
| Shoshone | 0.0 /100 | #288 | Tragic 10.0% |
| Hondurans | 0.0 /100 | #289 | Tragic 10.0% |
| Sub-Saharan Africans | 0.0 /100 | #290 | Tragic 10.0% |
| Nonimmigrants | 0.0 /100 | #291 | Tragic 10.0% |
| Carpatho Rusyns | 0.0 /100 | #292 | Tragic 10.0% |
| Haitians | 0.0 /100 | #293 | Tragic 10.0% |
| Ecuadorians | 0.0 /100 | #294 | Tragic 10.0% |
| Cherokee | 0.0 /100 | #295 | Tragic 10.0% |
| Immigrants from Western Africa | 0.0 /100 | #296 | Tragic 10.1% |
| Immigrants from Caribbean | 0.0 /100 | #297 | Tragic 10.1% |
| Immigrants from Haiti | 0.0 /100 | #298 | Tragic 10.1% |
| Immigrants from Honduras | 0.0 /100 | #299 | Tragic 10.1% |
| Nigerians | 0.0 /100 | #300 | Tragic 10.1% |
| Immigrants from Bahamas | 0.0 /100 | #301 | Tragic 10.1% |
| Venezuelans | 0.0 /100 | #302 | Tragic 10.2% |
Cherokee Unemployment Among Women with Children Ages 6 to 17 years Correlation Summary
| Measurement | Cherokee Data | Unemployment Among Women with Children Ages 6 to 17 years Data |
| Minimum | 0.21% | 1.3% |
| Maximum | 96.8% | 100.0% |
| Range | 96.6% | 98.7% |
| Mean | 21.8% | 20.4% |
| Median | 16.5% | 12.0% |
| Interquartile 25% (IQ1) | 7.3% | 8.0% |
| Interquartile 75% (IQ3) | 32.3% | 21.1% |
| Interquartile Range (IQR) | 25.0% | 13.2% |
| Standard Deviation (Sample) | 19.1% | 21.9% |
| Standard Deviation (Population) | 19.0% | 21.7% |
Correlation Details
| Cherokee Percentile | Sample Size | Unemployment Among Women with Children Ages 6 to 17 years |
[ 0.0% - 0.5% ] 0.21% | 284,644,093 | 8.9% |
[ 0.5% - 1.0% ] 0.67% | 33,891,638 | 10.7% |
[ 1.0% - 1.5% ] 1.17% | 5,856,816 | 11.5% |
[ 1.5% - 2.0% ] 1.74% | 2,639,057 | 11.7% |
[ 2.0% - 2.5% ] 2.22% | 1,352,486 | 11.3% |
[ 2.5% - 3.0% ] 2.70% | 527,453 | 14.8% |
[ 3.0% - 3.5% ] 3.26% | 262,842 | 17.7% |
[ 3.5% - 4.0% ] 3.79% | 195,916 | 10.2% |
[ 4.0% - 4.5% ] 4.26% | 183,062 | 15.2% |
[ 4.5% - 5.0% ] 4.81% | 582,460 | 8.0% |
[ 5.0% - 5.5% ] 5.27% | 266,944 | 9.8% |
[ 5.5% - 6.0% ] 5.80% | 206,031 | 6.7% |
[ 6.0% - 6.5% ] 6.14% | 39,437 | 21.7% |
[ 6.5% - 7.0% ] 6.85% | 61,565 | 11.1% |
[ 7.0% - 7.5% ] 7.29% | 96,850 | 12.1% |
[ 7.5% - 8.0% ] 7.81% | 100,131 | 7.2% |
[ 8.0% - 8.5% ] 8.31% | 23,923 | 13.0% |
[ 8.5% - 9.0% ] 8.72% | 82,981 | 4.3% |
[ 9.0% - 9.5% ] 9.33% | 24,301 | 21.1% |
[ 9.5% - 10.0% ] 9.88% | 11,601 | 28.9% |
[ 10.0% - 10.5% ] 10.27% | 34,637 | 12.9% |
[ 10.5% - 11.0% ] 10.63% | 2,323 | 7.4% |
[ 11.0% - 11.5% ] 11.35% | 1,172 | 13.3% |
[ 11.5% - 12.0% ] 11.65% | 1,562 | 24.9% |
[ 12.0% - 12.5% ] 12.12% | 27,290 | 12.0% |
[ 14.0% - 14.5% ] 14.36% | 39,836 | 17.5% |
[ 14.5% - 15.0% ] 14.78% | 30,066 | 3.9% |
[ 15.5% - 16.0% ] 15.93% | 2,906 | 6.7% |
[ 16.0% - 16.5% ] 16.01% | 20,435 | 5.9% |
[ 16.5% - 17.0% ] 16.90% | 36,933 | 17.6% |
[ 18.0% - 18.5% ] 18.05% | 20,007 | 7.7% |
[ 19.0% - 19.5% ] 19.15% | 141 | 55.6% |
[ 20.0% - 20.5% ] 20.16% | 29,382 | 14.0% |
[ 20.5% - 21.0% ] 20.91% | 17,213 | 1.3% |
[ 22.5% - 23.0% ] 22.70% | 423 | 50.0% |
[ 23.5% - 24.0% ] 23.91% | 1,129 | 80.0% |
[ 24.0% - 24.5% ] 24.27% | 11,093 | 1.6% |
[ 25.0% - 25.5% ] 25.49% | 5,700 | 16.2% |
[ 27.0% - 27.5% ] 27.10% | 3,070 | 50.0% |
[ 29.5% - 30.0% ] 29.55% | 1,445 | 28.6% |
[ 30.5% - 31.0% ] 30.81% | 5,134 | 5.6% |
[ 31.0% - 31.5% ] 31.29% | 1,502 | 10.0% |
[ 31.5% - 32.0% ] 31.83% | 6,309 | 13.7% |
[ 32.0% - 32.5% ] 32.29% | 96 | 100.0% |
[ 33.0% - 33.5% ] 33.49% | 16,782 | 6.2% |
[ 33.5% - 34.0% ] 33.55% | 1,368 | 40.0% |
[ 34.5% - 35.0% ] 34.71% | 4,500 | 56.1% |
[ 38.0% - 38.5% ] 38.42% | 3,587 | 4.2% |
[ 38.5% - 39.0% ] 38.69% | 31,164 | 4.0% |
[ 39.5% - 40.0% ] 39.53% | 1,371 | 14.3% |
[ 40.0% - 40.5% ] 40.34% | 5,692 | 9.5% |
[ 41.0% - 41.5% ] 41.23% | 1,266 | 35.0% |
[ 41.5% - 42.0% ] 41.93% | 1,672 | 11.6% |
[ 49.0% - 49.5% ] 49.42% | 4,589 | 15.2% |
[ 59.0% - 59.5% ] 59.07% | 12,167 | 10.4% |
[ 59.5% - 60.0% ] 59.93% | 277 | 50.0% |
[ 68.0% - 68.5% ] 68.07% | 570 | 11.8% |
[ 96.5% - 97.0% ] 96.79% | 343 | 100.0% |