Alaskan Athabascan vs Immigrants from North Macedonia Disability Age 5 to 17
COMPARE
Alaskan Athabascan
Immigrants from North Macedonia
Disability Age 5 to 17
Disability Age 5 to 17 Comparison
Alaskan Athabascans
Immigrants from North Macedonia
6.3%
DISABILITY AGE 5 TO 17
0.0/ 100
METRIC RATING
310th/ 347
METRIC RANK
5.1%
DISABILITY AGE 5 TO 17
99.9/ 100
METRIC RATING
59th/ 347
METRIC RANK
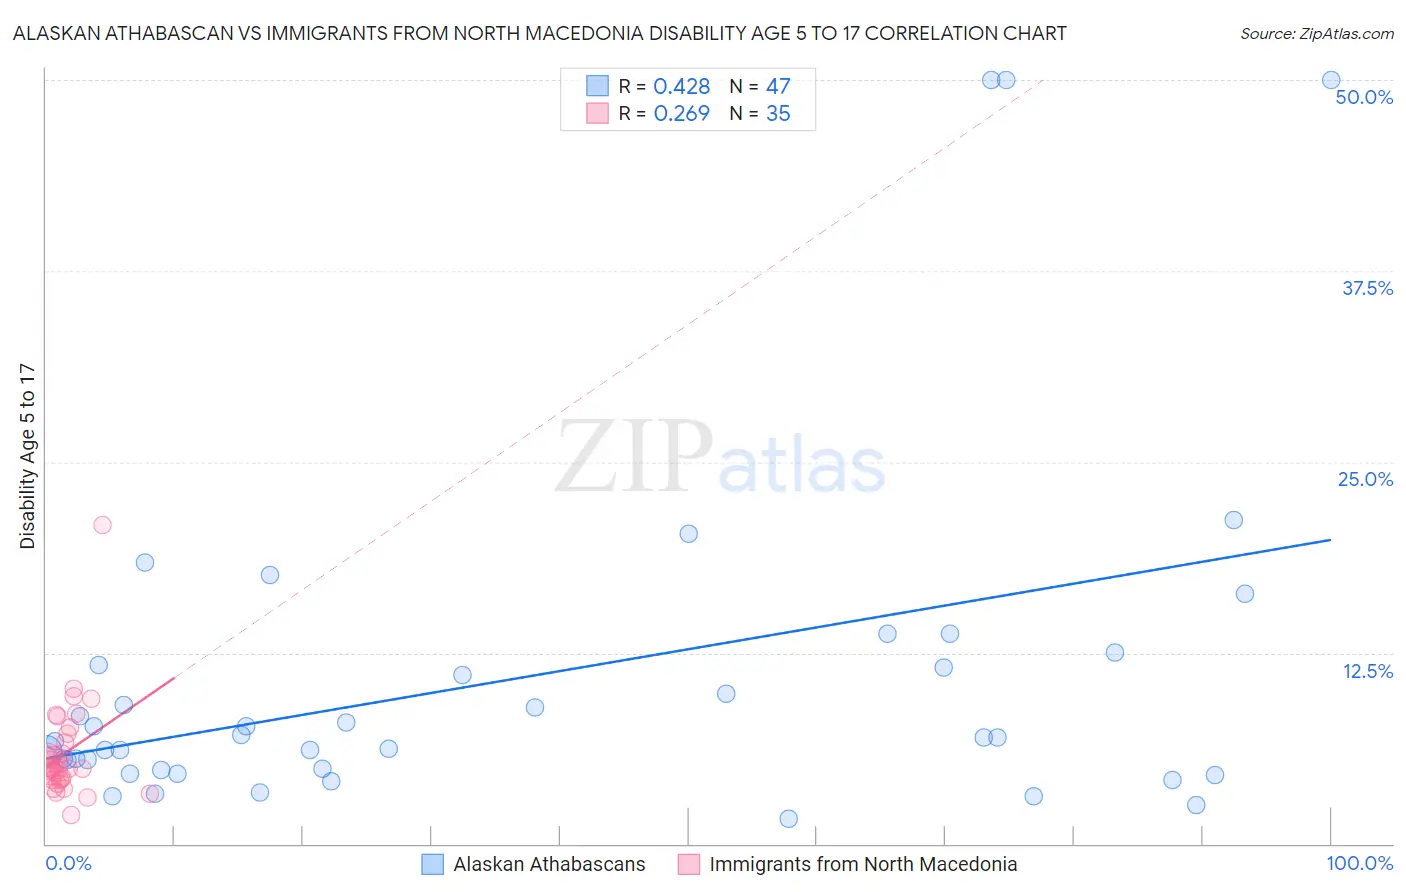
Alaskan Athabascan vs Immigrants from North Macedonia Disability Age 5 to 17 Correlation Chart
The statistical analysis conducted on geographies consisting of 45,771,406 people shows a moderate positive correlation between the proportion of Alaskan Athabascans and percentage of population with a disability between the ages 5 and 17 in the United States with a correlation coefficient (R) of 0.428 and weighted average of 6.3%. Similarly, the statistical analysis conducted on geographies consisting of 74,064,473 people shows a weak positive correlation between the proportion of Immigrants from North Macedonia and percentage of population with a disability between the ages 5 and 17 in the United States with a correlation coefficient (R) of 0.269 and weighted average of 5.1%, a difference of 23.6%.
Disability Age 5 to 17 Correlation Summary
| Measurement | Alaskan Athabascan | Immigrants from North Macedonia |
| Minimum | 1.7% | 1.9% |
| Maximum | 50.0% | 20.9% |
| Range | 48.3% | 19.0% |
| Mean | 10.8% | 6.0% |
| Median | 7.0% | 5.0% |
| Interquartile 25% (IQ1) | 4.8% | 4.2% |
| Interquartile 75% (IQ3) | 11.7% | 7.2% |
| Interquartile Range (IQR) | 6.9% | 3.0% |
| Standard Deviation (Sample) | 11.4% | 3.3% |
| Standard Deviation (Population) | 11.2% | 3.2% |
Similar Demographics by Disability Age 5 to 17
Demographics Similar to Alaskan Athabascans by Disability Age 5 to 17
In terms of disability age 5 to 17, the demographic groups most similar to Alaskan Athabascans are Immigrants from Dominica (6.3%, a difference of 0.040%), Hmong (6.3%, a difference of 0.13%), Scotch-Irish (6.3%, a difference of 0.16%), Bermudan (6.4%, a difference of 0.16%), and Bahamian (6.3%, a difference of 0.39%).
| Demographics | Rating | Rank | Disability Age 5 to 17 |
| Yakama | 0.0 /100 | #303 | Tragic 6.3% |
| Senegalese | 0.0 /100 | #304 | Tragic 6.3% |
| Natives/Alaskans | 0.0 /100 | #305 | Tragic 6.3% |
| Immigrants | Nonimmigrants | 0.0 /100 | #306 | Tragic 6.3% |
| Bahamians | 0.0 /100 | #307 | Tragic 6.3% |
| Scotch-Irish | 0.0 /100 | #308 | Tragic 6.3% |
| Hmong | 0.0 /100 | #309 | Tragic 6.3% |
| Alaskan Athabascans | 0.0 /100 | #310 | Tragic 6.3% |
| Immigrants | Dominica | 0.0 /100 | #311 | Tragic 6.3% |
| Bermudans | 0.0 /100 | #312 | Tragic 6.4% |
| Apache | 0.0 /100 | #313 | Tragic 6.4% |
| French | 0.0 /100 | #314 | Tragic 6.4% |
| Immigrants | Portugal | 0.0 /100 | #315 | Tragic 6.4% |
| Immigrants | Dominican Republic | 0.0 /100 | #316 | Tragic 6.4% |
| Kiowa | 0.0 /100 | #317 | Tragic 6.4% |
Demographics Similar to Immigrants from North Macedonia by Disability Age 5 to 17
In terms of disability age 5 to 17, the demographic groups most similar to Immigrants from North Macedonia are Immigrants from Eastern Europe (5.1%, a difference of 0.11%), Immigrants from Ukraine (5.1%, a difference of 0.18%), Immigrants from Poland (5.1%, a difference of 0.26%), Immigrants from Turkey (5.1%, a difference of 0.41%), and Laotian (5.1%, a difference of 0.42%).
| Demographics | Rating | Rank | Disability Age 5 to 17 |
| Immigrants | Fiji | 99.9 /100 | #52 | Exceptional 5.1% |
| Immigrants | Lithuania | 99.9 /100 | #53 | Exceptional 5.1% |
| Paraguayans | 99.9 /100 | #54 | Exceptional 5.1% |
| Laotians | 99.9 /100 | #55 | Exceptional 5.1% |
| Immigrants | Turkey | 99.9 /100 | #56 | Exceptional 5.1% |
| Immigrants | Poland | 99.9 /100 | #57 | Exceptional 5.1% |
| Immigrants | Ukraine | 99.9 /100 | #58 | Exceptional 5.1% |
| Immigrants | North Macedonia | 99.9 /100 | #59 | Exceptional 5.1% |
| Immigrants | Eastern Europe | 99.9 /100 | #60 | Exceptional 5.1% |
| Immigrants | Switzerland | 99.8 /100 | #61 | Exceptional 5.2% |
| Immigrants | Ireland | 99.8 /100 | #62 | Exceptional 5.2% |
| Immigrants | Bangladesh | 99.8 /100 | #63 | Exceptional 5.2% |
| Immigrants | South Eastern Asia | 99.8 /100 | #64 | Exceptional 5.2% |
| Immigrants | Greece | 99.8 /100 | #65 | Exceptional 5.2% |
| Palestinians | 99.8 /100 | #66 | Exceptional 5.2% |