Alaskan Athabascan vs Alaska Native Disability Age 5 to 17
COMPARE
Alaskan Athabascan
Alaska Native
Disability Age 5 to 17
Disability Age 5 to 17 Comparison
Alaskan Athabascans
Alaska Natives
6.3%
DISABILITY AGE 5 TO 17
0.0/ 100
METRIC RATING
310th/ 347
METRIC RANK
6.0%
DISABILITY AGE 5 TO 17
0.2/ 100
METRIC RATING
273rd/ 347
METRIC RANK
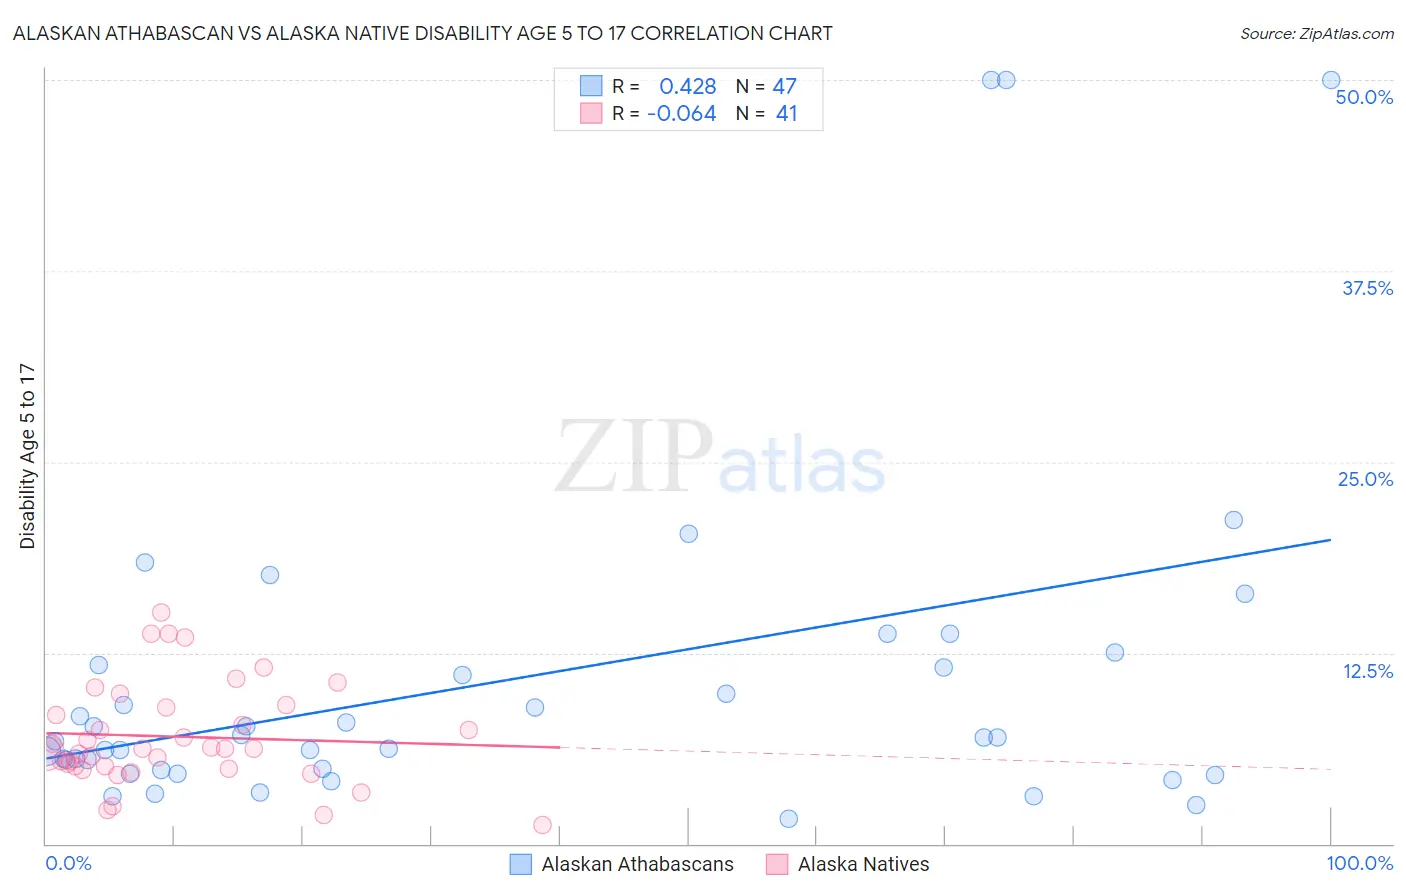
Alaskan Athabascan vs Alaska Native Disability Age 5 to 17 Correlation Chart
The statistical analysis conducted on geographies consisting of 45,771,406 people shows a moderate positive correlation between the proportion of Alaskan Athabascans and percentage of population with a disability between the ages 5 and 17 in the United States with a correlation coefficient (R) of 0.428 and weighted average of 6.3%. Similarly, the statistical analysis conducted on geographies consisting of 76,612,507 people shows a slight negative correlation between the proportion of Alaska Natives and percentage of population with a disability between the ages 5 and 17 in the United States with a correlation coefficient (R) of -0.064 and weighted average of 6.0%, a difference of 5.2%.
Disability Age 5 to 17 Correlation Summary
| Measurement | Alaskan Athabascan | Alaska Native |
| Minimum | 1.7% | 1.3% |
| Maximum | 50.0% | 15.2% |
| Range | 48.3% | 13.9% |
| Mean | 10.8% | 7.0% |
| Median | 7.0% | 6.2% |
| Interquartile 25% (IQ1) | 4.8% | 5.0% |
| Interquartile 75% (IQ3) | 11.7% | 9.0% |
| Interquartile Range (IQR) | 6.9% | 4.0% |
| Standard Deviation (Sample) | 11.4% | 3.3% |
| Standard Deviation (Population) | 11.2% | 3.3% |
Similar Demographics by Disability Age 5 to 17
Demographics Similar to Alaskan Athabascans by Disability Age 5 to 17
In terms of disability age 5 to 17, the demographic groups most similar to Alaskan Athabascans are Immigrants from Dominica (6.3%, a difference of 0.040%), Hmong (6.3%, a difference of 0.13%), Scotch-Irish (6.3%, a difference of 0.16%), Bermudan (6.4%, a difference of 0.16%), and Bahamian (6.3%, a difference of 0.39%).
| Demographics | Rating | Rank | Disability Age 5 to 17 |
| Yakama | 0.0 /100 | #303 | Tragic 6.3% |
| Senegalese | 0.0 /100 | #304 | Tragic 6.3% |
| Natives/Alaskans | 0.0 /100 | #305 | Tragic 6.3% |
| Immigrants | Nonimmigrants | 0.0 /100 | #306 | Tragic 6.3% |
| Bahamians | 0.0 /100 | #307 | Tragic 6.3% |
| Scotch-Irish | 0.0 /100 | #308 | Tragic 6.3% |
| Hmong | 0.0 /100 | #309 | Tragic 6.3% |
| Alaskan Athabascans | 0.0 /100 | #310 | Tragic 6.3% |
| Immigrants | Dominica | 0.0 /100 | #311 | Tragic 6.3% |
| Bermudans | 0.0 /100 | #312 | Tragic 6.4% |
| Apache | 0.0 /100 | #313 | Tragic 6.4% |
| French | 0.0 /100 | #314 | Tragic 6.4% |
| Immigrants | Portugal | 0.0 /100 | #315 | Tragic 6.4% |
| Immigrants | Dominican Republic | 0.0 /100 | #316 | Tragic 6.4% |
| Kiowa | 0.0 /100 | #317 | Tragic 6.4% |
Demographics Similar to Alaska Natives by Disability Age 5 to 17
In terms of disability age 5 to 17, the demographic groups most similar to Alaska Natives are Finnish (6.0%, a difference of 0.050%), Immigrants from Zaire (6.0%, a difference of 0.080%), Cheyenne (6.0%, a difference of 0.11%), Dutch (6.0%, a difference of 0.22%), and Japanese (6.1%, a difference of 0.33%).
| Demographics | Rating | Rank | Disability Age 5 to 17 |
| Slovenes | 0.6 /100 | #266 | Tragic 6.0% |
| Spanish | 0.5 /100 | #267 | Tragic 6.0% |
| Sioux | 0.4 /100 | #268 | Tragic 6.0% |
| Liberians | 0.4 /100 | #269 | Tragic 6.0% |
| Immigrants | Somalia | 0.4 /100 | #270 | Tragic 6.0% |
| Immigrants | Zaire | 0.2 /100 | #271 | Tragic 6.0% |
| Finns | 0.2 /100 | #272 | Tragic 6.0% |
| Alaska Natives | 0.2 /100 | #273 | Tragic 6.0% |
| Cheyenne | 0.2 /100 | #274 | Tragic 6.0% |
| Dutch | 0.2 /100 | #275 | Tragic 6.0% |
| Japanese | 0.1 /100 | #276 | Tragic 6.1% |
| Puget Sound Salish | 0.1 /100 | #277 | Tragic 6.1% |
| Immigrants | Liberia | 0.1 /100 | #278 | Tragic 6.1% |
| Immigrants | Jamaica | 0.1 /100 | #279 | Tragic 6.1% |
| Portuguese | 0.1 /100 | #280 | Tragic 6.1% |