Zip Codes with the Highest Percentage of Immigrants from Latin America in Littleton, CO
RELATED REPORTS & OPTIONS
Latin America
Littleton
Compare Zip Codes
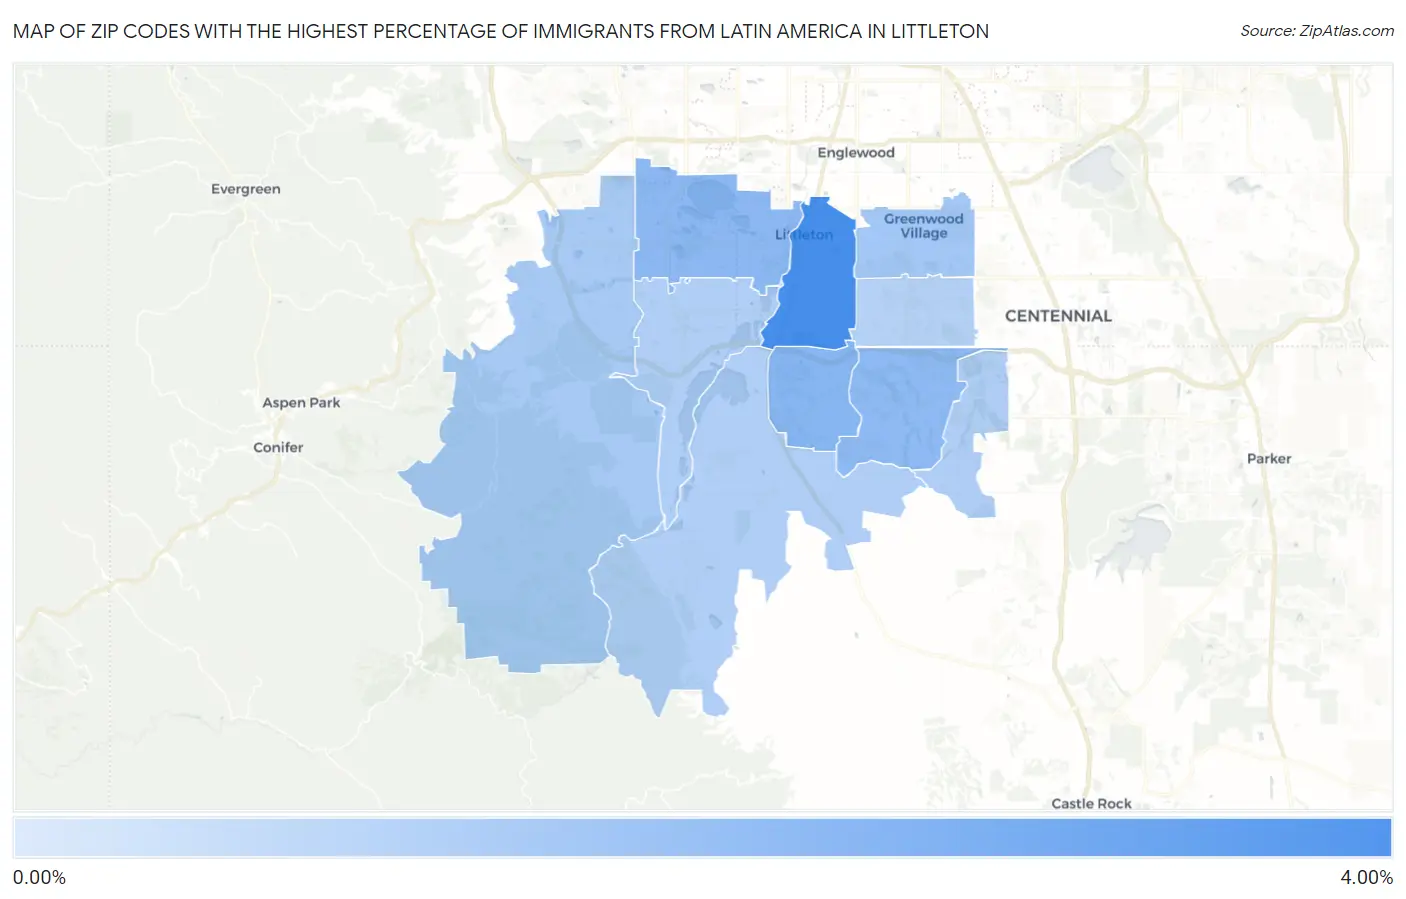
Map of Zip Codes with the Highest Percentage of Immigrants from Latin America in Littleton
0.83%
3.19%
Zip Codes with the Highest Percentage of Immigrants from Latin America in Littleton, CO
| Zip Code | Latin America | vs State | vs National | |
| 1. | 80120 | 3.19% | 4.80%(-1.61)#139 | 6.84%(-3.65)#4,999 |
| 2. | 80129 | 1.81% | 4.80%(-2.98)#140 | 6.84%(-5.03)#5,000 |
| 3. | 80123 | 1.71% | 4.80%(-3.09)#141 | 6.84%(-5.13)#5,001 |
| 4. | 80126 | 1.65% | 4.80%(-3.14)#142 | 6.84%(-5.19)#5,002 |
| 5. | 80121 | 1.23% | 4.80%(-3.57)#143 | 6.84%(-5.61)#5,003 |
| 6. | 80127 | 1.13% | 4.80%(-3.66)#144 | 6.84%(-5.71)#5,004 |
| 7. | 80130 | 0.98% | 4.80%(-3.82)#145 | 6.84%(-5.86)#5,005 |
| 8. | 80128 | 0.92% | 4.80%(-3.87)#146 | 6.84%(-5.92)#5,006 |
| 9. | 80125 | 0.92% | 4.80%(-3.88)#147 | 6.84%(-5.92)#5,007 |
| 10. | 80122 | 0.83% | 4.80%(-3.97)#148 | 6.84%(-6.01)#5,008 |
1
Common Questions
What are the Top 5 Zip Codes with the Highest Percentage of Immigrants from Latin America in Littleton, CO?
Top 5 Zip Codes with the Highest Percentage of Immigrants from Latin America in Littleton, CO are:
What zip code has the Highest Percentage of Immigrants from Latin America in Littleton, CO?
80120 has the Highest Percentage of Immigrants from Latin America in Littleton, CO with 3.19%.
What is the Percentage of Immigrants from Latin America in Littleton, CO?
Percentage of Immigrants from Latin America in Littleton is 2.65%.
What is the Percentage of Immigrants from Latin America in Colorado?
Percentage of Immigrants from Latin America in Colorado is 4.80%.
What is the Percentage of Immigrants from Latin America in the United States?
Percentage of Immigrants from Latin America in the United States is 6.84%.