Zip Codes with the Highest Percentage of Population Employed in Transportation & Warehousing in West Virginia
RELATED REPORTS & OPTIONS
Transportation & Warehousing
West Virginia
Compare Zip Codes
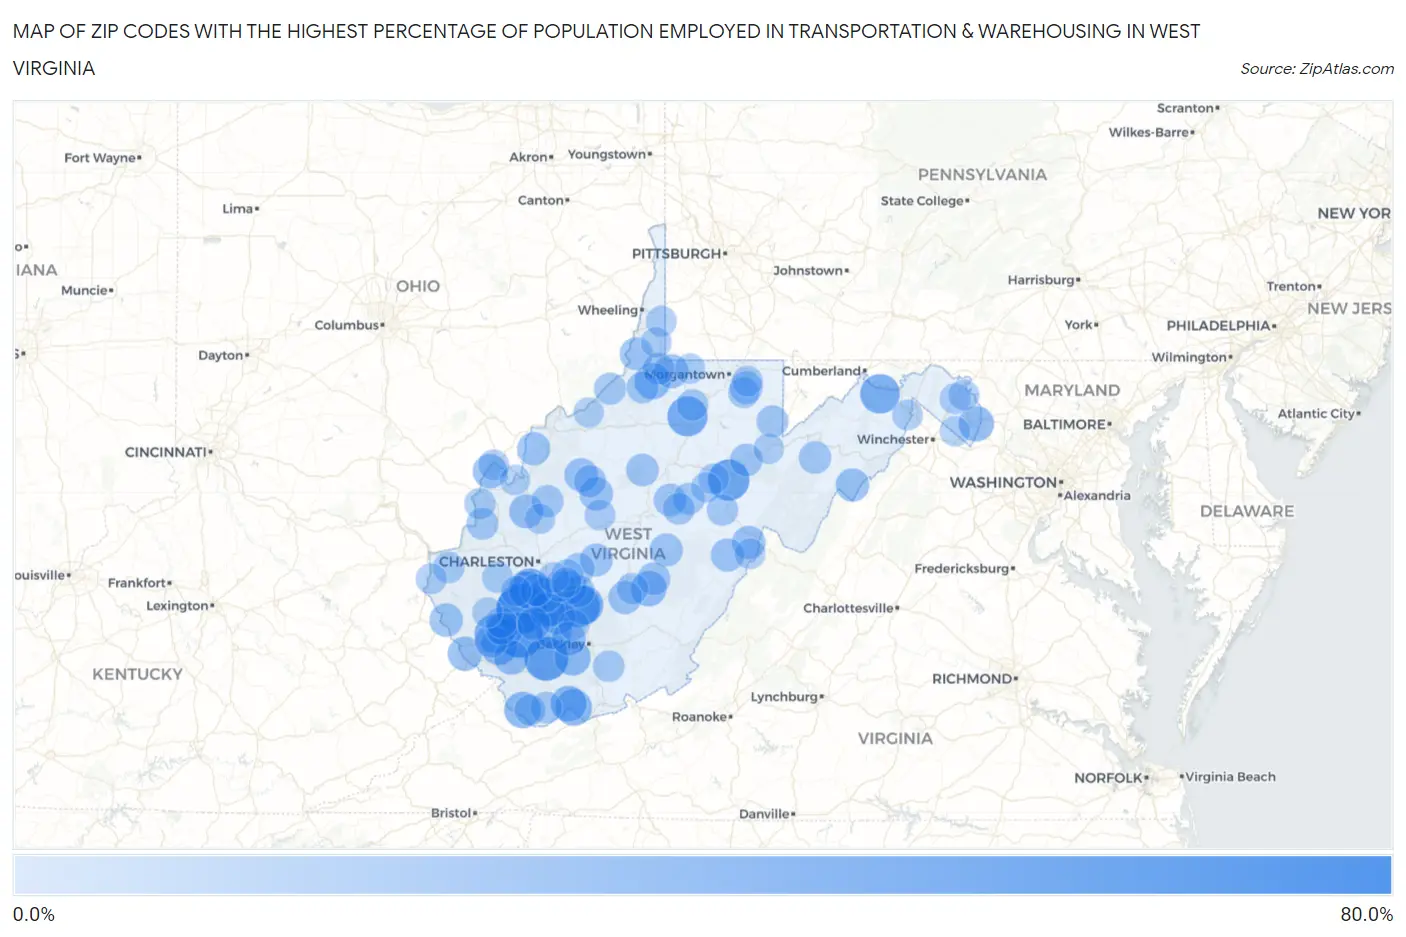
Map of Zip Codes with the Highest Percentage of Population Employed in Transportation & Warehousing in West Virginia
0.0%
80.0%
Zip Codes with the Highest Percentage of Population Employed in Transportation & Warehousing in West Virginia
| Zip Code | % Employed | vs State | vs National | |
| 1. | 25205 | 76.0% | 4.5%(+71.5)#1 | 4.9%(+71.0)#32 |
| 2. | 25022 | 62.2% | 4.5%(+57.7)#2 | 4.9%(+57.2)#46 |
| 3. | 24849 | 55.7% | 4.5%(+51.2)#3 | 4.9%(+50.7)#59 |
| 4. | 25119 | 50.0% | 4.5%(+45.5)#4 | 4.9%(+45.1)#76 |
| 5. | 26285 | 47.7% | 4.5%(+43.3)#5 | 4.9%(+42.8)#91 |
| 6. | 25051 | 44.1% | 4.5%(+39.7)#6 | 4.9%(+39.2)#108 |
| 7. | 26438 | 43.6% | 4.5%(+39.1)#7 | 4.9%(+38.6)#111 |
| 8. | 26722 | 41.7% | 4.5%(+37.2)#8 | 4.9%(+36.7)#119 |
| 9. | 25152 | 39.6% | 4.5%(+35.1)#9 | 4.9%(+34.6)#131 |
| 10. | 25637 | 38.2% | 4.5%(+33.7)#10 | 4.9%(+33.2)#145 |
| 11. | 25142 | 35.4% | 4.5%(+31.0)#11 | 4.9%(+30.5)#165 |
| 12. | 25612 | 33.3% | 4.5%(+28.9)#12 | 4.9%(+28.4)#182 |
| 13. | 24715 | 31.4% | 4.5%(+26.9)#13 | 4.9%(+26.4)#210 |
| 14. | 24879 | 30.8% | 4.5%(+26.3)#14 | 4.9%(+25.8)#212 |
| 15. | 25140 | 30.5% | 4.5%(+26.1)#15 | 4.9%(+25.6)#218 |
| 16. | 25148 | 30.3% | 4.5%(+25.8)#16 | 4.9%(+25.4)#221 |
| 17. | 25920 | 29.9% | 4.5%(+25.4)#17 | 4.9%(+24.9)#230 |
| 18. | 26419 | 29.6% | 4.5%(+25.1)#18 | 4.9%(+24.6)#236 |
| 19. | 25060 | 29.4% | 4.5%(+25.0)#19 | 4.9%(+24.5)#240 |
| 20. | 24861 | 29.3% | 4.5%(+24.9)#20 | 4.9%(+24.4)#243 |
| 21. | 26676 | 27.7% | 4.5%(+23.3)#21 | 4.9%(+22.8)#275 |
| 22. | 25432 | 27.3% | 4.5%(+22.8)#22 | 4.9%(+22.3)#285 |
| 23. | 25076 | 27.3% | 4.5%(+22.8)#23 | 4.9%(+22.3)#286 |
| 24. | 25193 | 27.2% | 4.5%(+22.7)#24 | 4.9%(+22.2)#289 |
| 25. | 25049 | 26.6% | 4.5%(+22.2)#25 | 4.9%(+21.7)#297 |
| 26. | 25611 | 24.5% | 4.5%(+20.1)#26 | 4.9%(+19.6)#346 |
| 27. | 25667 | 23.9% | 4.5%(+19.4)#27 | 4.9%(+18.9)#371 |
| 28. | 25287 | 23.5% | 4.5%(+19.0)#28 | 4.9%(+18.5)#381 |
| 29. | 25245 | 22.9% | 4.5%(+18.5)#29 | 4.9%(+18.0)#398 |
| 30. | 26562 | 22.7% | 4.5%(+18.2)#30 | 4.9%(+17.7)#404 |
| 31. | 26141 | 22.1% | 4.5%(+17.7)#31 | 4.9%(+17.2)#430 |
| 32. | 25102 | 22.1% | 4.5%(+17.7)#32 | 4.9%(+17.2)#431 |
| 33. | 25844 | 21.9% | 4.5%(+17.4)#33 | 4.9%(+16.9)#443 |
| 34. | 25234 | 21.4% | 4.5%(+16.9)#34 | 4.9%(+16.4)#461 |
| 35. | 24915 | 20.7% | 4.5%(+16.3)#35 | 4.9%(+15.8)#492 |
| 36. | 25669 | 20.4% | 4.5%(+16.0)#36 | 4.9%(+15.5)#512 |
| 37. | 24927 | 20.3% | 4.5%(+15.8)#37 | 4.9%(+15.3)#524 |
| 38. | 26812 | 20.2% | 4.5%(+15.8)#38 | 4.9%(+15.3)#529 |
| 39. | 26680 | 20.2% | 4.5%(+15.8)#39 | 4.9%(+15.3)#531 |
| 40. | 26133 | 19.9% | 4.5%(+15.4)#40 | 4.9%(+14.9)#547 |
| 41. | 25021 | 19.6% | 4.5%(+15.2)#41 | 4.9%(+14.7)#563 |
| 42. | 26266 | 19.6% | 4.5%(+15.1)#42 | 4.9%(+14.6)#566 |
| 43. | 25111 | 19.2% | 4.5%(+14.7)#43 | 4.9%(+14.2)#583 |
| 44. | 25652 | 19.1% | 4.5%(+14.6)#44 | 4.9%(+14.1)#589 |
| 45. | 26524 | 19.0% | 4.5%(+14.6)#45 | 4.9%(+14.1)#592 |
| 46. | 26055 | 19.0% | 4.5%(+14.6)#46 | 4.9%(+14.1)#594 |
| 47. | 26202 | 18.8% | 4.5%(+14.3)#47 | 4.9%(+13.8)#616 |
| 48. | 26376 | 18.3% | 4.5%(+13.9)#48 | 4.9%(+13.4)#651 |
| 49. | 26384 | 17.8% | 4.5%(+13.3)#49 | 4.9%(+12.8)#700 |
| 50. | 26283 | 17.7% | 4.5%(+13.3)#50 | 4.9%(+12.8)#708 |
| 51. | 26833 | 17.4% | 4.5%(+12.9)#51 | 4.9%(+12.4)#734 |
| 52. | 25165 | 16.7% | 4.5%(+12.3)#52 | 4.9%(+11.8)#806 |
| 53. | 25244 | 16.5% | 4.5%(+12.1)#53 | 4.9%(+11.6)#848 |
| 54. | 26151 | 16.2% | 4.5%(+11.7)#54 | 4.9%(+11.3)#877 |
| 55. | 26581 | 16.1% | 4.5%(+11.7)#55 | 4.9%(+11.2)#885 |
| 56. | 26175 | 16.1% | 4.5%(+11.6)#56 | 4.9%(+11.1)#897 |
| 57. | 26234 | 15.7% | 4.5%(+11.2)#57 | 4.9%(+10.7)#955 |
| 58. | 25639 | 15.6% | 4.5%(+11.2)#58 | 4.9%(+10.7)#958 |
| 59. | 25160 | 15.5% | 4.5%(+11.1)#59 | 4.9%(+10.6)#969 |
| 60. | 26705 | 15.3% | 4.5%(+10.9)#60 | 4.9%(+10.4)#1,003 |
| 61. | 26167 | 15.2% | 4.5%(+10.8)#61 | 4.9%(+10.3)#1,015 |
| 62. | 26215 | 15.1% | 4.5%(+10.6)#62 | 4.9%(+10.1)#1,045 |
| 63. | 25503 | 15.1% | 4.5%(+10.6)#63 | 4.9%(+10.1)#1,050 |
| 64. | 25031 | 15.0% | 4.5%(+10.6)#64 | 4.9%(+10.1)#1,060 |
| 65. | 26568 | 14.7% | 4.5%(+10.3)#65 | 4.9%(+9.80)#1,114 |
| 66. | 25061 | 14.7% | 4.5%(+10.2)#66 | 4.9%(+9.74)#1,124 |
| 67. | 25039 | 14.6% | 4.5%(+10.2)#67 | 4.9%(+9.67)#1,140 |
| 68. | 25969 | 14.5% | 4.5%(+10.0)#68 | 4.9%(+9.53)#1,171 |
| 69. | 24830 | 14.3% | 4.5%(+9.83)#69 | 4.9%(+9.34)#1,221 |
| 70. | 25535 | 14.2% | 4.5%(+9.77)#70 | 4.9%(+9.28)#1,232 |
| 71. | 26679 | 14.0% | 4.5%(+9.51)#71 | 4.9%(+9.01)#1,293 |
| 72. | 26280 | 13.7% | 4.5%(+9.21)#72 | 4.9%(+8.72)#1,358 |
| 73. | 25515 | 13.5% | 4.5%(+9.02)#73 | 4.9%(+8.53)#1,397 |
| 74. | 24892 | 13.0% | 4.5%(+8.51)#74 | 4.9%(+8.02)#1,543 |
| 75. | 26520 | 12.9% | 4.5%(+8.49)#75 | 4.9%(+7.99)#1,547 |
| 76. | 25521 | 12.7% | 4.5%(+8.26)#76 | 4.9%(+7.77)#1,619 |
| 77. | 25547 | 12.4% | 4.5%(+7.92)#77 | 4.9%(+7.42)#1,723 |
| 78. | 25235 | 12.1% | 4.5%(+7.62)#78 | 4.9%(+7.12)#1,828 |
| 79. | 25401 | 12.0% | 4.5%(+7.54)#79 | 4.9%(+7.04)#1,864 |
| 80. | 25260 | 12.0% | 4.5%(+7.53)#80 | 4.9%(+7.04)#1,868 |
| 81. | 25404 | 12.0% | 4.5%(+7.53)#81 | 4.9%(+7.03)#1,875 |
| 82. | 26542 | 11.8% | 4.5%(+7.34)#82 | 4.9%(+6.85)#1,950 |
| 83. | 25555 | 11.7% | 4.5%(+7.23)#83 | 4.9%(+6.73)#1,995 |
| 84. | 25015 | 11.7% | 4.5%(+7.20)#84 | 4.9%(+6.71)#2,005 |
| 85. | 26267 | 11.6% | 4.5%(+7.12)#85 | 4.9%(+6.63)#2,038 |
| 86. | 25044 | 11.6% | 4.5%(+7.12)#86 | 4.9%(+6.62)#2,041 |
| 87. | 26036 | 11.5% | 4.5%(+7.04)#87 | 4.9%(+6.55)#2,077 |
| 88. | 26817 | 11.4% | 4.5%(+6.91)#88 | 4.9%(+6.42)#2,139 |
| 89. | 24944 | 11.3% | 4.5%(+6.86)#89 | 4.9%(+6.36)#2,175 |
| 90. | 26033 | 11.3% | 4.5%(+6.81)#90 | 4.9%(+6.32)#2,197 |
| 91. | 25529 | 11.2% | 4.5%(+6.73)#91 | 4.9%(+6.24)#2,240 |
| 92. | 26237 | 11.0% | 4.5%(+6.50)#92 | 4.9%(+6.01)#2,343 |
| 93. | 26590 | 10.8% | 4.5%(+6.34)#93 | 4.9%(+5.85)#2,424 |
| 94. | 26269 | 10.8% | 4.5%(+6.34)#94 | 4.9%(+5.85)#2,426 |
| 95. | 25524 | 10.5% | 4.5%(+6.06)#95 | 4.9%(+5.56)#2,583 |
| 96. | 25248 | 10.4% | 4.5%(+5.90)#96 | 4.9%(+5.40)#2,675 |
| 97. | 25162 | 10.3% | 4.5%(+5.87)#97 | 4.9%(+5.38)#2,698 |
| 98. | 25446 | 10.3% | 4.5%(+5.83)#98 | 4.9%(+5.34)#2,716 |
| 99. | 25262 | 10.2% | 4.5%(+5.79)#99 | 4.9%(+5.30)#2,735 |
| 100. | 26170 | 10.2% | 4.5%(+5.79)#100 | 4.9%(+5.29)#2,736 |
Common Questions
What are the Top 10 Zip Codes with the Highest Percentage of Population Employed in Transportation & Warehousing in West Virginia?
Top 10 Zip Codes with the Highest Percentage of Population Employed in Transportation & Warehousing in West Virginia are:
What zip code has the Highest Percentage of Population Employed in Transportation & Warehousing in West Virginia?
25205 has the Highest Percentage of Population Employed in Transportation & Warehousing in West Virginia with 76.0%.
What is the Percentage of Population Employed in Transportation & Warehousing in the State of West Virginia?
Percentage of Population Employed in Transportation & Warehousing in West Virginia is 4.5%.
What is the Percentage of Population Employed in Transportation & Warehousing in the United States?
Percentage of Population Employed in Transportation & Warehousing in the United States is 4.9%.