Crescent, LA Map & Demographics
Crescent Map
Crescent Overview
$18,236
PER CAPITA INCOME
$41,289
AVG FAMILY INCOME
$40,898
AVG HOUSEHOLD INCOME
0.22
INEQUALITY / GINI INDEX
946
TOTAL POPULATION
333
MALE POPULATION
613
FEMALE POPULATION
54.32
MALES / 100 FEMALES
184.08
FEMALES / 100 MALES
43.2
MEDIAN AGE
2.7
AVG FAMILY SIZE
2.5
AVG HOUSEHOLD SIZE
333
LABOR FORCE [ PEOPLE ]
50.7%
PERCENT IN LABOR FORCE
5.1%
UNEMPLOYMENT RATE
Income in Crescent
Income Overview in Crescent
Per Capita Income in Crescent is $18,236, while median incomes of families and households are $41,289 and $40,898 respectively.
| Characteristic | Number | Measure |
| Per Capita Income | 946 | $18,236 |
| Median Family Income | 328 | $41,289 |
| Mean Family Income | 328 | $46,830 |
| Median Household Income | 378 | $40,898 |
| Mean Household Income | 378 | $45,311 |
| Income Deficit | 328 | $0 |
| Wage / Income Gap (%) | 946 | 0.00% |
| Wage / Income Gap ($) | 946 | 100.00¢ per $1 |
| Gini / Inequality Index | 946 | 0.22 |
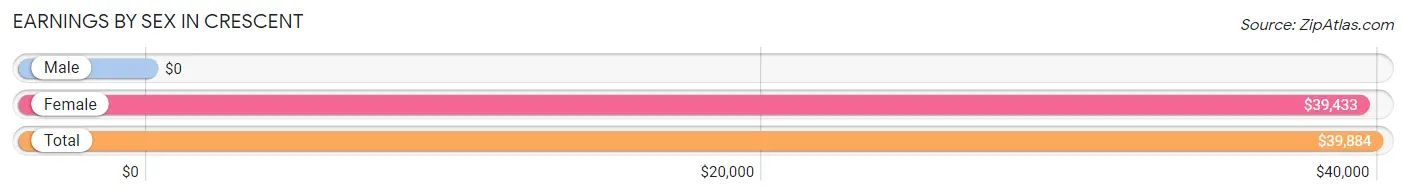
Earnings by Sex in Crescent
| Sex | Number | Average Earnings |
| Male | 111 (33.3%) | $0 |
| Female | 222 (66.7%) | $39,433 |
| Total | 333 (100.0%) | $39,884 |
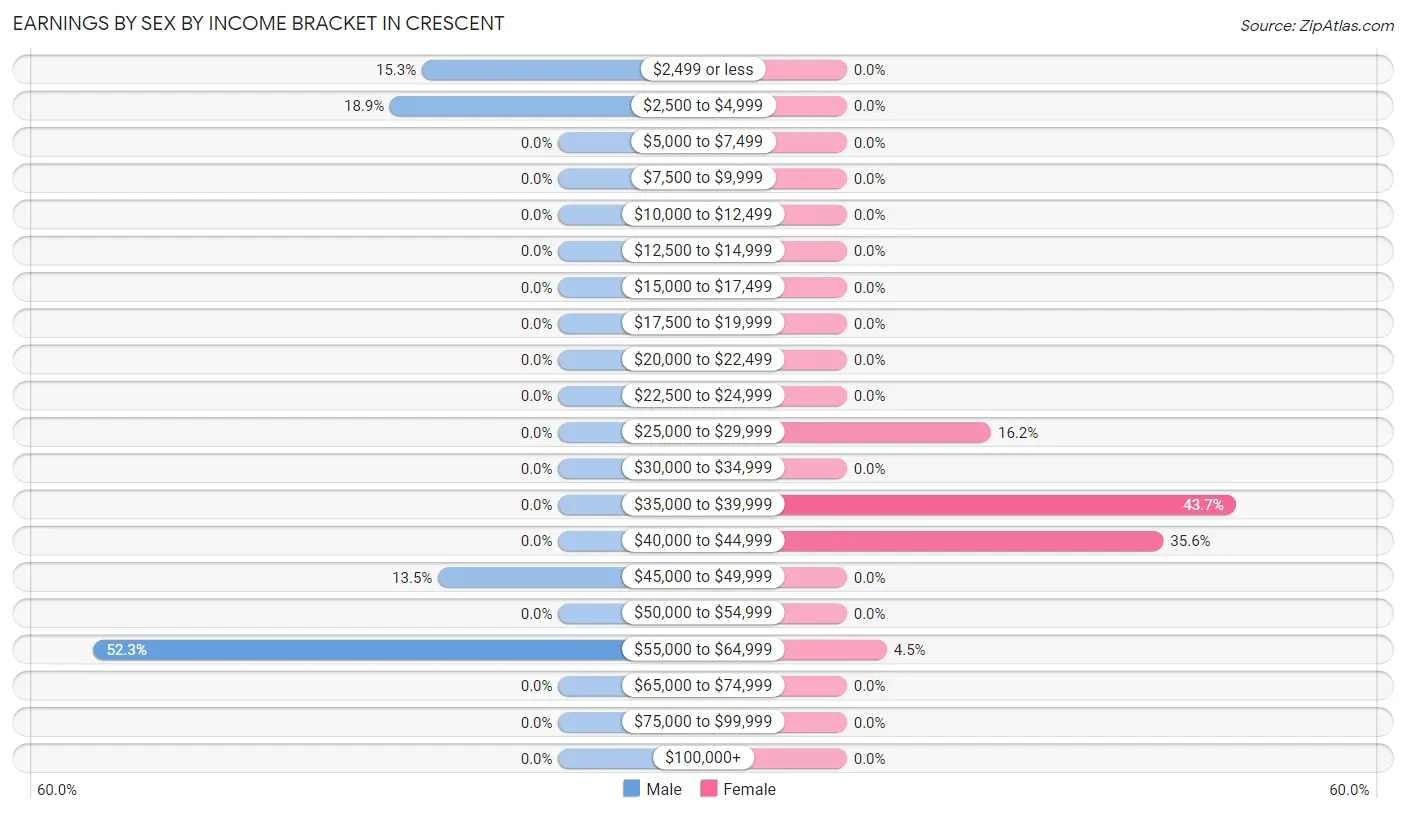
Earnings by Sex by Income Bracket in Crescent
The most common earnings brackets in Crescent are $55,000 to $64,999 for men (58 | 52.2%) and $35,000 to $39,999 for women (97 | 43.7%).
| Income | Male | Female |
| $2,499 or less | 17 (15.3%) | 0 (0.0%) |
| $2,500 to $4,999 | 21 (18.9%) | 0 (0.0%) |
| $5,000 to $7,499 | 0 (0.0%) | 0 (0.0%) |
| $7,500 to $9,999 | 0 (0.0%) | 0 (0.0%) |
| $10,000 to $12,499 | 0 (0.0%) | 0 (0.0%) |
| $12,500 to $14,999 | 0 (0.0%) | 0 (0.0%) |
| $15,000 to $17,499 | 0 (0.0%) | 0 (0.0%) |
| $17,500 to $19,999 | 0 (0.0%) | 0 (0.0%) |
| $20,000 to $22,499 | 0 (0.0%) | 0 (0.0%) |
| $22,500 to $24,999 | 0 (0.0%) | 0 (0.0%) |
| $25,000 to $29,999 | 0 (0.0%) | 36 (16.2%) |
| $30,000 to $34,999 | 0 (0.0%) | 0 (0.0%) |
| $35,000 to $39,999 | 0 (0.0%) | 97 (43.7%) |
| $40,000 to $44,999 | 0 (0.0%) | 79 (35.6%) |
| $45,000 to $49,999 | 15 (13.5%) | 0 (0.0%) |
| $50,000 to $54,999 | 0 (0.0%) | 0 (0.0%) |
| $55,000 to $64,999 | 58 (52.2%) | 10 (4.5%) |
| $65,000 to $74,999 | 0 (0.0%) | 0 (0.0%) |
| $75,000 to $99,999 | 0 (0.0%) | 0 (0.0%) |
| $100,000+ | 0 (0.0%) | 0 (0.0%) |
| Total | 111 (100.0%) | 222 (100.0%) |
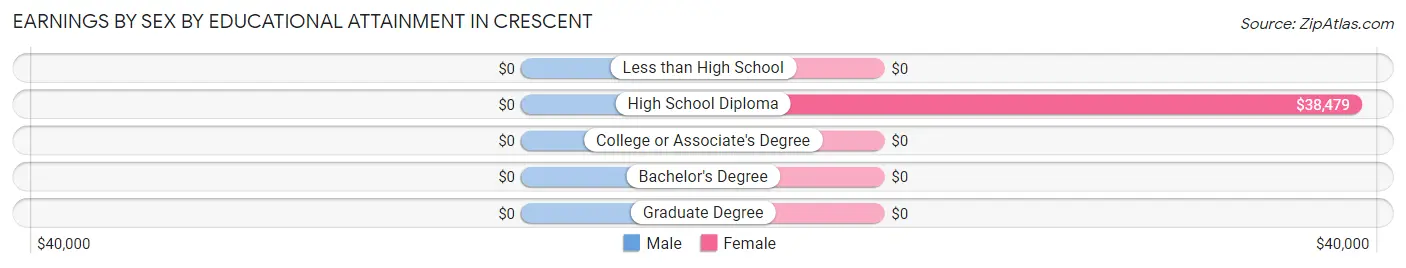
Earnings by Sex by Educational Attainment in Crescent
| Educational Attainment | Male Income | Female Income |
| Less than High School | - | - |
| High School Diploma | - | - |
| College or Associate's Degree | - | - |
| Bachelor's Degree | - | - |
| Graduate Degree | - | - |
| Total | - | - |
Family Income in Crescent
Family Income Brackets in Crescent
According to the Crescent family income data, there are 174 families falling into the $35,000 to $49,999 income range, which is the most common income bracket and makes up 53.0% of all families.
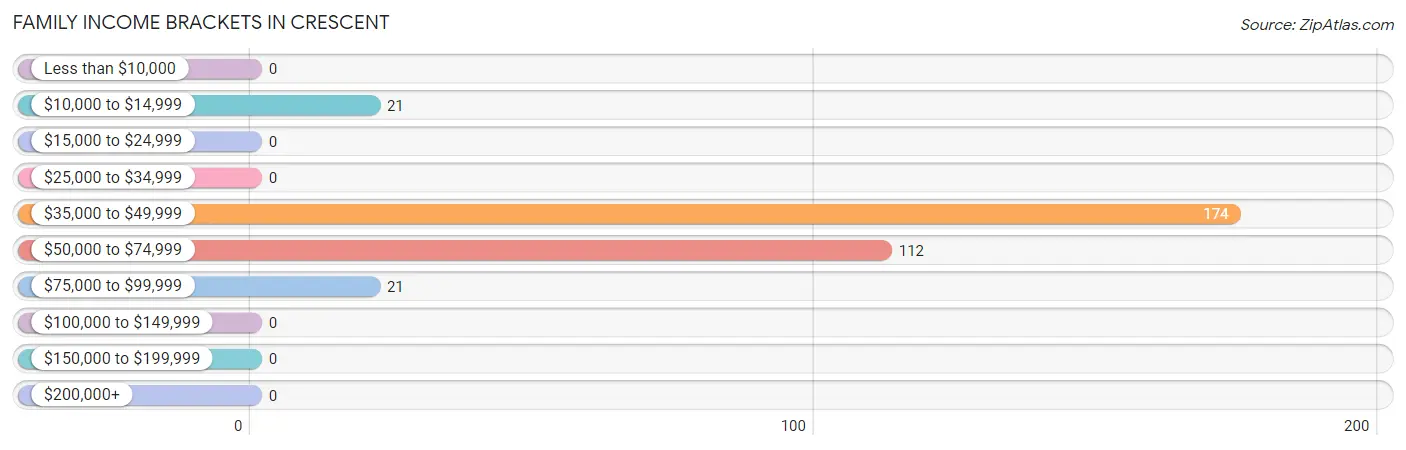
| Income Bracket | # Families | % Families |
| Less than $10,000 | 0 | 0.0% |
| $10,000 to $14,999 | 21 | 6.4% |
| $15,000 to $24,999 | 0 | 0.0% |
| $25,000 to $34,999 | 0 | 0.0% |
| $35,000 to $49,999 | 174 | 53.0% |
| $50,000 to $74,999 | 112 | 34.1% |
| $75,000 to $99,999 | 21 | 6.4% |
| $100,000 to $149,999 | 0 | 0.0% |
| $150,000 to $199,999 | 0 | 0.0% |
| $200,000+ | 0 | 0.0% |
Family Income by Famaliy Size in Crescent
2-person families (128 | 39.0%) account for the highest median family income in Crescent with $41,172 per family, while 2-person families (128 | 39.0%) have the highest median income of $20,586 per family member.
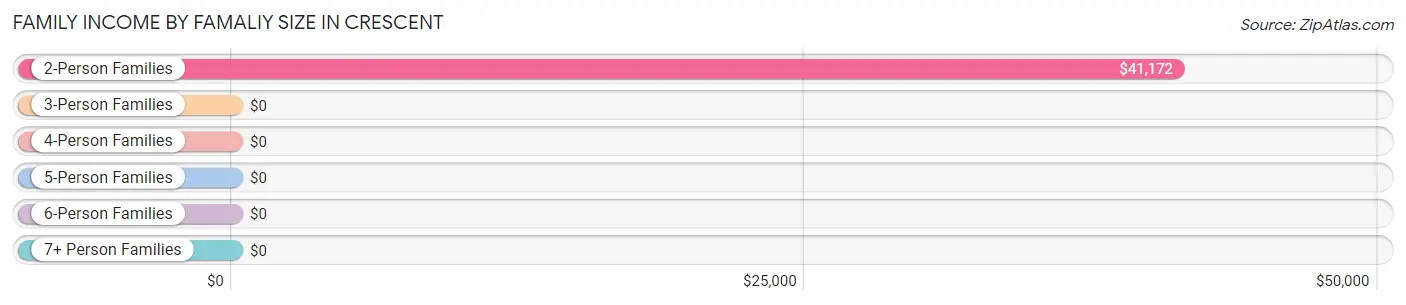
| Income Bracket | # Families | Median Income |
| 2-Person Families | 128 (39.0%) | $41,172 |
| 3-Person Families | 67 (20.4%) | $0 |
| 4-Person Families | 97 (29.6%) | $0 |
| 5-Person Families | 36 (11.0%) | $0 |
| 6-Person Families | 0 (0.0%) | $0 |
| 7+ Person Families | 0 (0.0%) | $0 |
| Total | 328 (100.0%) | $41,289 |
Family Income by Number of Earners in Crescent
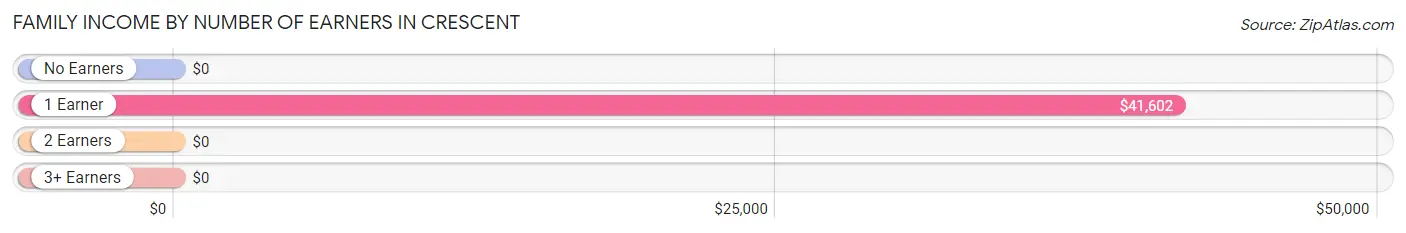
| Number of Earners | # Families | Median Income |
| No Earners | 31 (9.5%) | $0 |
| 1 Earner | 276 (84.2%) | $41,602 |
| 2 Earners | 21 (6.4%) | $0 |
| 3+ Earners | 0 (0.0%) | $0 |
| Total | 328 (100.0%) | $41,289 |
Household Income in Crescent
Household Income Brackets in Crescent
With 174 households falling in the category, the $35,000 to $49,999 income range is the most frequent in Crescent, accounting for 46.0% of all households.
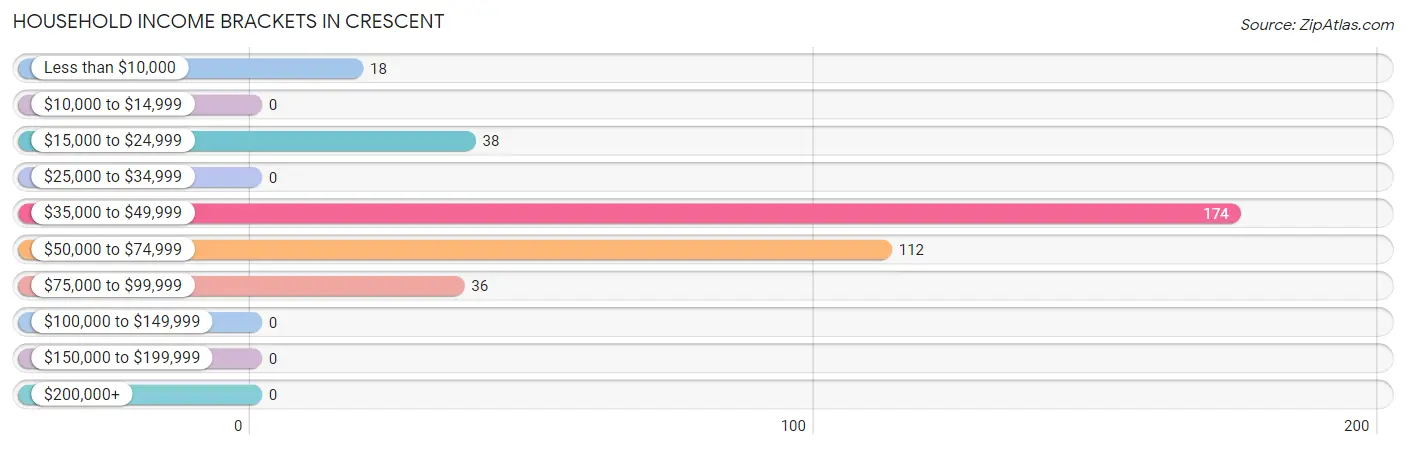
| Income Bracket | # Households | % Households |
| Less than $10,000 | 18 | 4.8% |
| $10,000 to $14,999 | 0 | 0.0% |
| $15,000 to $24,999 | 38 | 10.1% |
| $25,000 to $34,999 | 0 | 0.0% |
| $35,000 to $49,999 | 174 | 46.0% |
| $50,000 to $74,999 | 112 | 29.6% |
| $75,000 to $99,999 | 36 | 9.5% |
| $100,000 to $149,999 | 0 | 0.0% |
| $150,000 to $199,999 | 0 | 0.0% |
| $200,000+ | 0 | 0.0% |
Household Income by Householder Age in Crescent
The median household income in Crescent is $40,898, with the highest median household income of $57,845 found in the 45 to 64 years age bracket for the primary householder. A total of 130 households (34.4%) fall into this category.
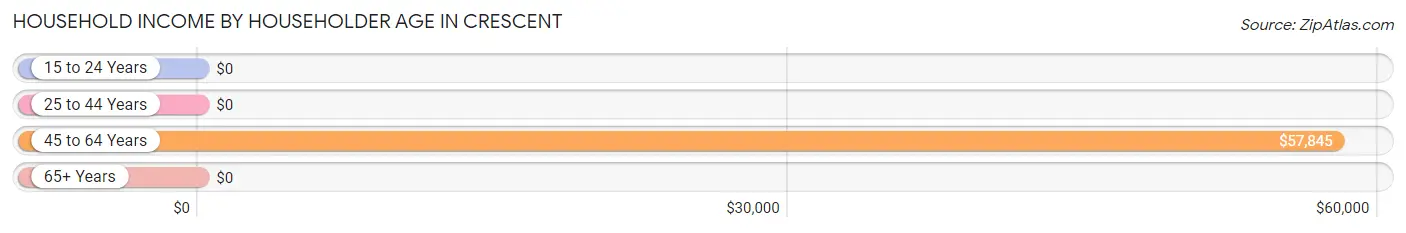
| Income Bracket | # Households | Median Income |
| 15 to 24 Years | 0 (0.0%) | $0 |
| 25 to 44 Years | 161 (42.6%) | $0 |
| 45 to 64 Years | 130 (34.4%) | $57,845 |
| 65+ Years | 87 (23.0%) | $0 |
| Total | 378 (100.0%) | $40,898 |
Poverty in Crescent
Income Below Poverty by Sex and Age in Crescent
With 11.4% poverty level for males and 6.5% for females among the residents of Crescent, 35 to 44 year old males and 65 to 74 year old females are the most vulnerable to poverty, with 17 males (100.0%) and 18 females (31.6%) in their respective age groups living below the poverty level.
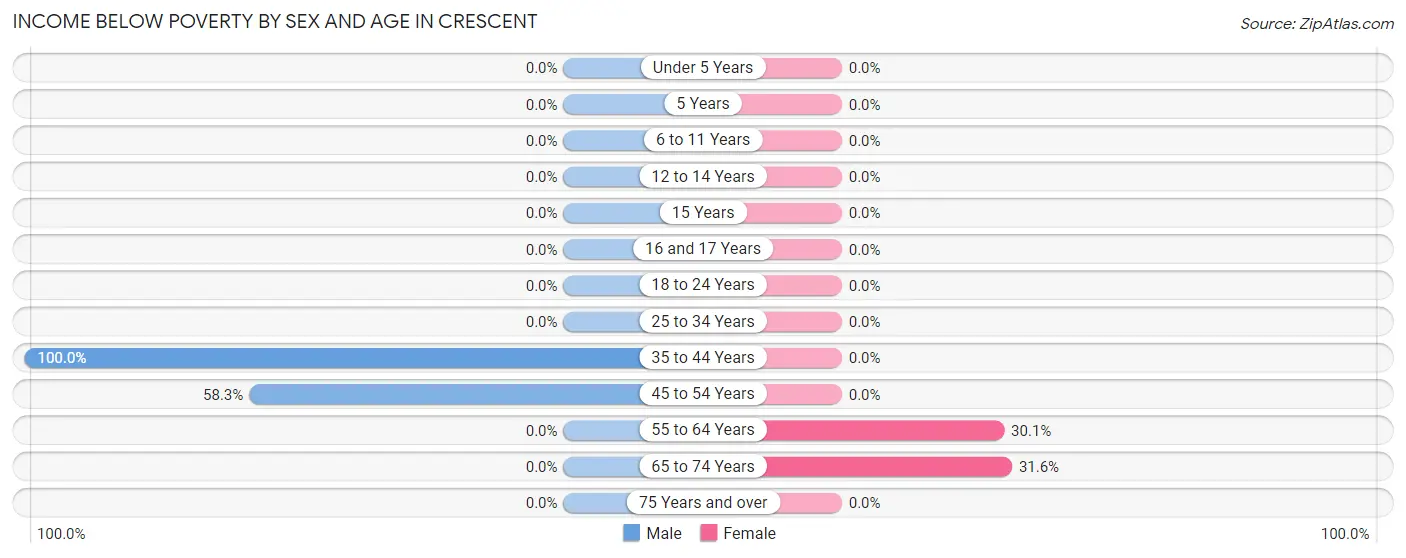
| Age Bracket | Male | Female |
| Under 5 Years | 0 (0.0%) | 0 (0.0%) |
| 5 Years | 0 (0.0%) | 0 (0.0%) |
| 6 to 11 Years | 0 (0.0%) | 0 (0.0%) |
| 12 to 14 Years | 0 (0.0%) | 0 (0.0%) |
| 15 Years | 0 (0.0%) | 0 (0.0%) |
| 16 and 17 Years | 0 (0.0%) | 0 (0.0%) |
| 18 to 24 Years | 0 (0.0%) | 0 (0.0%) |
| 25 to 34 Years | 0 (0.0%) | 0 (0.0%) |
| 35 to 44 Years | 17 (100.0%) | 0 (0.0%) |
| 45 to 54 Years | 21 (58.3%) | 0 (0.0%) |
| 55 to 64 Years | 0 (0.0%) | 22 (30.1%) |
| 65 to 74 Years | 0 (0.0%) | 18 (31.6%) |
| 75 Years and over | 0 (0.0%) | 0 (0.0%) |
| Total | 38 (11.4%) | 40 (6.5%) |
Income Above Poverty by Sex and Age in Crescent
According to the poverty statistics in Crescent, males aged 6 to 11 years and females aged 6 to 11 years are the age groups that are most secure financially, with 100.0% of males and 100.0% of females in these age groups living above the poverty line.
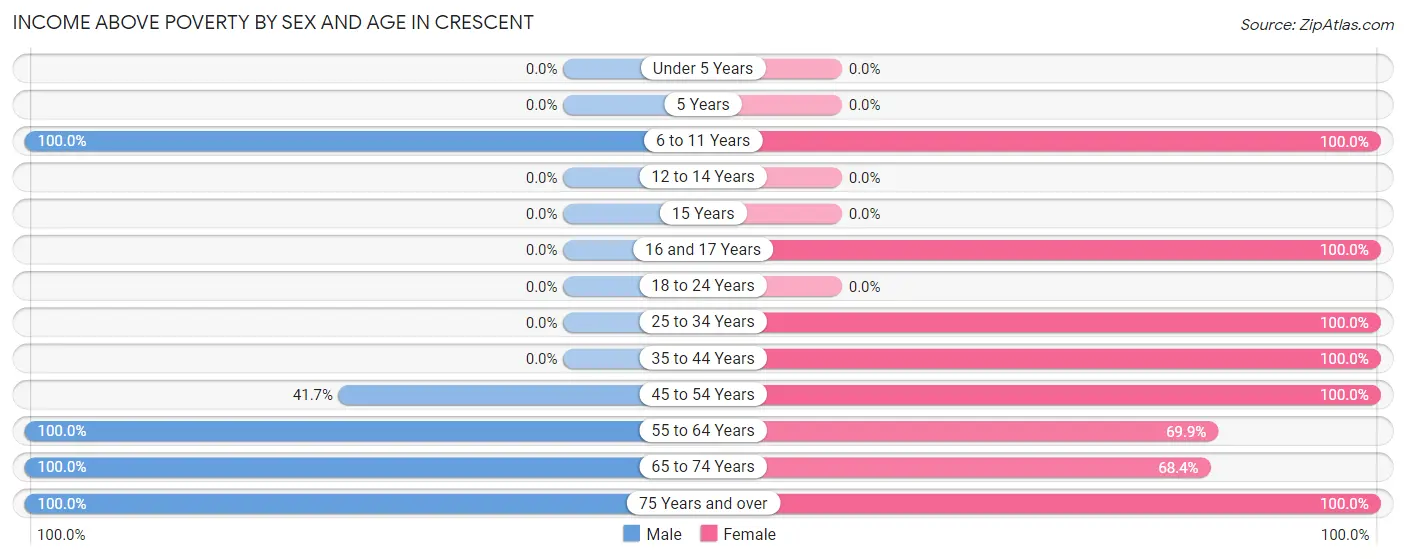
| Age Bracket | Male | Female |
| Under 5 Years | 0 (0.0%) | 0 (0.0%) |
| 5 Years | 0 (0.0%) | 0 (0.0%) |
| 6 to 11 Years | 135 (100.0%) | 154 (100.0%) |
| 12 to 14 Years | 0 (0.0%) | 0 (0.0%) |
| 15 Years | 0 (0.0%) | 0 (0.0%) |
| 16 and 17 Years | 0 (0.0%) | 48 (100.0%) |
| 18 to 24 Years | 0 (0.0%) | 0 (0.0%) |
| 25 to 34 Years | 0 (0.0%) | 97 (100.0%) |
| 35 to 44 Years | 0 (0.0%) | 74 (100.0%) |
| 45 to 54 Years | 15 (41.7%) | 50 (100.0%) |
| 55 to 64 Years | 104 (100.0%) | 51 (69.9%) |
| 65 to 74 Years | 18 (100.0%) | 39 (68.4%) |
| 75 Years and over | 23 (100.0%) | 60 (100.0%) |
| Total | 295 (88.6%) | 573 (93.5%) |
Income Below Poverty Among Married-Couple Families in Crescent
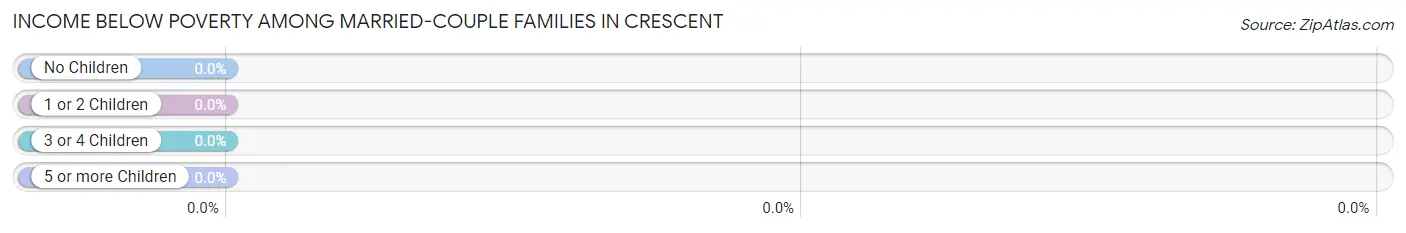
| Children | Above Poverty | Below Poverty |
| No Children | 43 (100.0%) | 0 (0.0%) |
| 1 or 2 Children | 58 (100.0%) | 0 (0.0%) |
| 3 or 4 Children | 0 (0.0%) | 0 (0.0%) |
| 5 or more Children | 0 (0.0%) | 0 (0.0%) |
| Total | 101 (100.0%) | 0 (0.0%) |
Income Below Poverty Among Single-Parent Households in Crescent
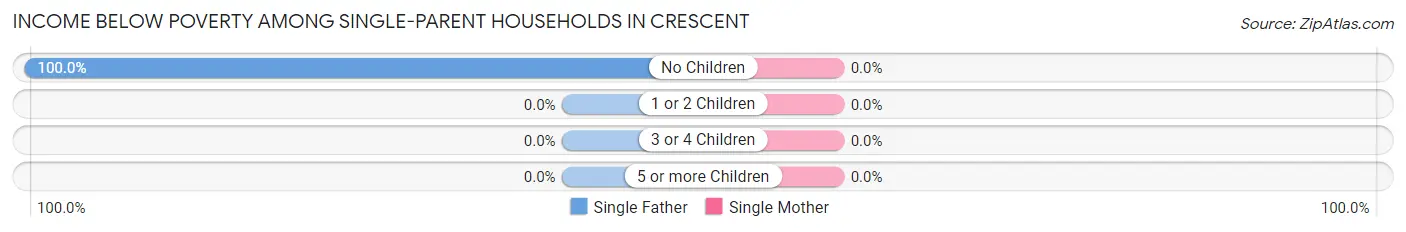
| Children | Single Father | Single Mother |
| No Children | 21 (100.0%) | 0 (0.0%) |
| 1 or 2 Children | 0 (0.0%) | 0 (0.0%) |
| 3 or 4 Children | 0 (0.0%) | 0 (0.0%) |
| 5 or more Children | 0 (0.0%) | 0 (0.0%) |
| Total | 21 (100.0%) | 0 (0.0%) |
Income Below Poverty Among Married-Couple vs Single-Parent Households in Crescent
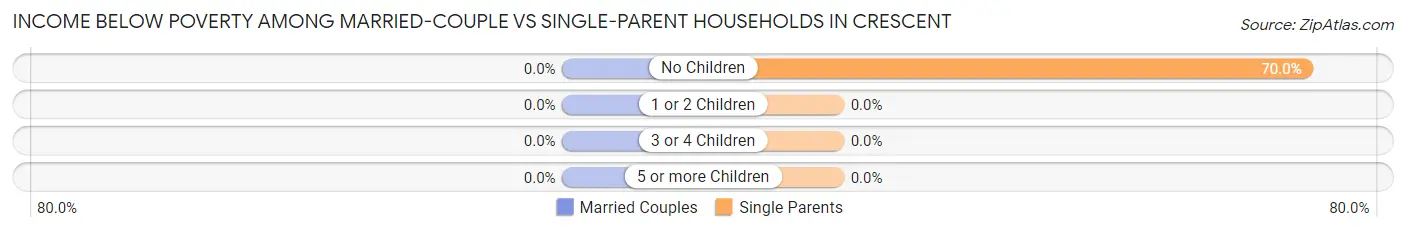
| Children | Married-Couple Families | Single-Parent Households |
| No Children | 0 (0.0%) | 21 (70.0%) |
| 1 or 2 Children | 0 (0.0%) | 0 (0.0%) |
| 3 or 4 Children | 0 (0.0%) | 0 (0.0%) |
| 5 or more Children | 0 (0.0%) | 0 (0.0%) |
| Total | 0 (0.0%) | 21 (9.2%) |
Race in Crescent
The most populous races in Crescent are White / Caucasian (760 | 80.3%), Black / African American (156 | 16.5%), and Hispanic or Latino (143 | 15.1%).
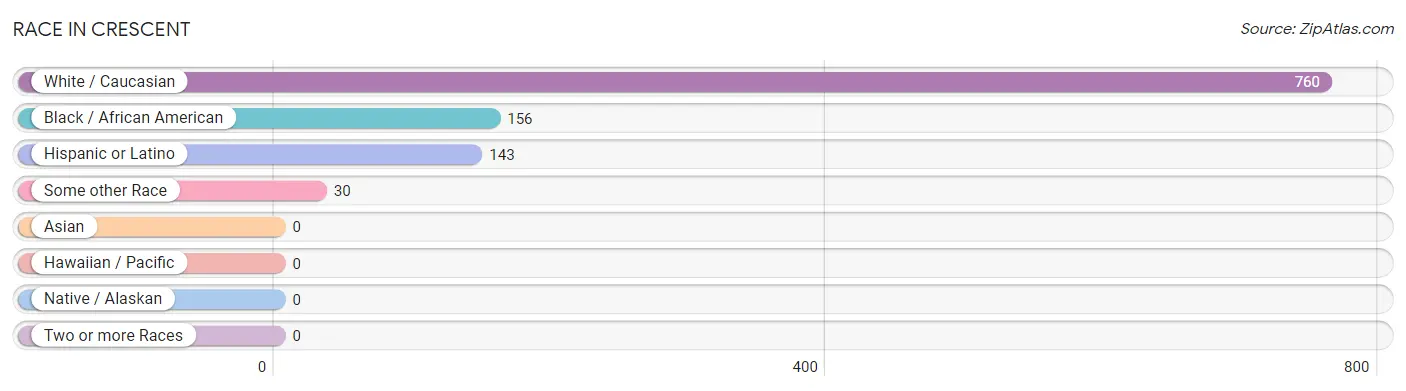
| Race | # Population | % Population |
| Asian | 0 | 0.0% |
| Black / African American | 156 | 16.5% |
| Hawaiian / Pacific | 0 | 0.0% |
| Hispanic or Latino | 143 | 15.1% |
| Native / Alaskan | 0 | 0.0% |
| White / Caucasian | 760 | 80.3% |
| Two or more Races | 0 | 0.0% |
| Some other Race | 30 | 3.2% |
| Total | 946 | 100.0% |
Ancestry in Crescent
The most populous ancestries reported in Crescent are American (269 | 28.4%), French (215 | 22.7%), Irish (112 | 11.8%), Mexican (77 | 8.1%), and Spaniard (66 | 7.0%), together accounting for 78.1% of all Crescent residents.
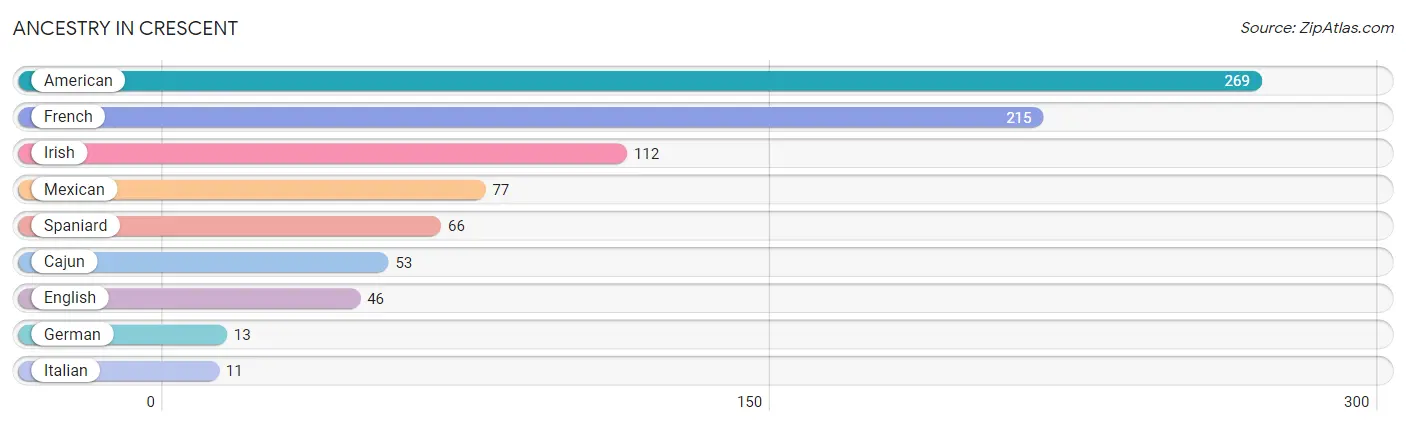
| Ancestry | # Population | % Population |
| American | 269 | 28.4% |
| Cajun | 53 | 5.6% |
| English | 46 | 4.9% |
| French | 215 | 22.7% |
| German | 13 | 1.4% |
| Irish | 112 | 11.8% |
| Italian | 11 | 1.2% |
| Mexican | 77 | 8.1% |
| Spaniard | 66 | 7.0% | View All 9 Rows |
Immigrants in Crescent

| Immigration Origin | # Population | % Population | View All 0 Rows |
Sex and Age in Crescent
Sex and Age in Crescent
The most populous age groups in Crescent are 5 to 9 Years (110 | 33.0%) for men and 25 to 29 Years (97 | 15.8%) for women.
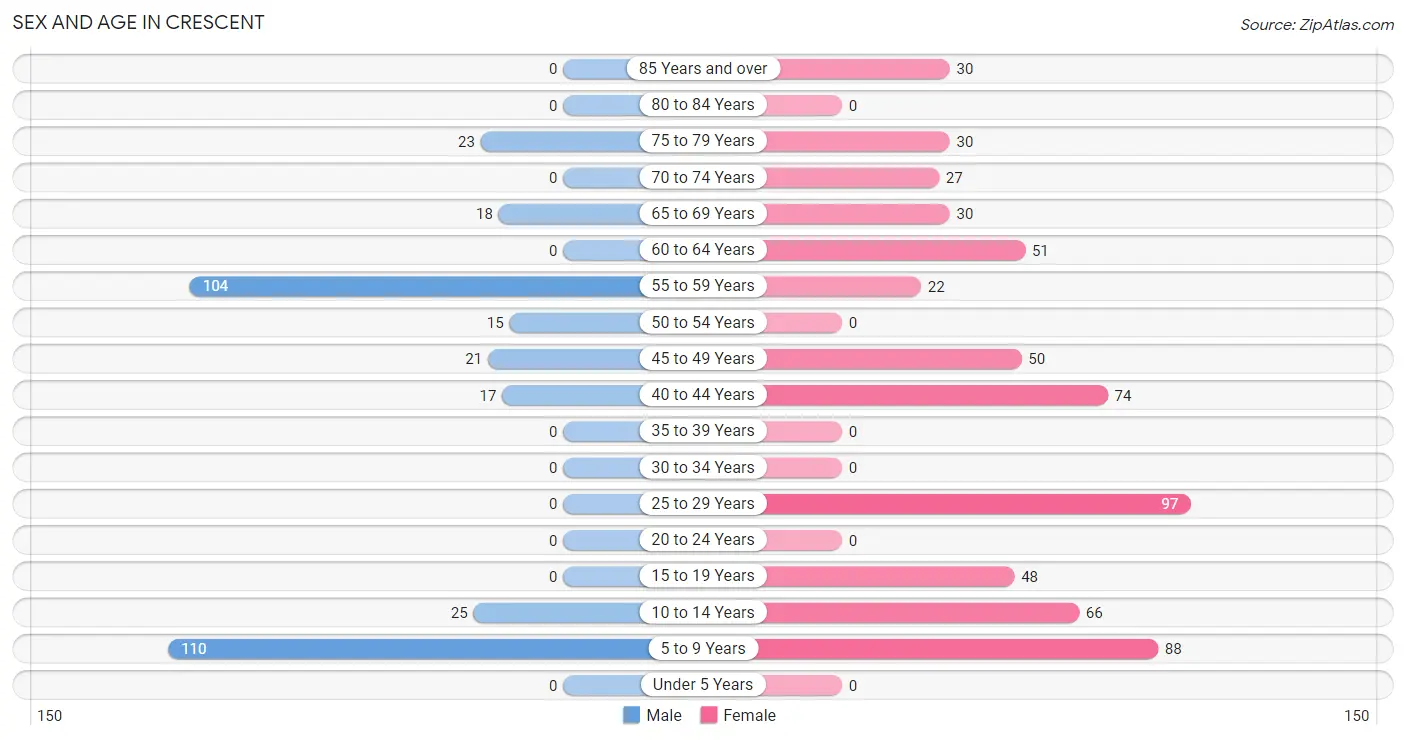
| Age Bracket | Male | Female |
| Under 5 Years | 0 (0.0%) | 0 (0.0%) |
| 5 to 9 Years | 110 (33.0%) | 88 (14.4%) |
| 10 to 14 Years | 25 (7.5%) | 66 (10.8%) |
| 15 to 19 Years | 0 (0.0%) | 48 (7.8%) |
| 20 to 24 Years | 0 (0.0%) | 0 (0.0%) |
| 25 to 29 Years | 0 (0.0%) | 97 (15.8%) |
| 30 to 34 Years | 0 (0.0%) | 0 (0.0%) |
| 35 to 39 Years | 0 (0.0%) | 0 (0.0%) |
| 40 to 44 Years | 17 (5.1%) | 74 (12.1%) |
| 45 to 49 Years | 21 (6.3%) | 50 (8.2%) |
| 50 to 54 Years | 15 (4.5%) | 0 (0.0%) |
| 55 to 59 Years | 104 (31.2%) | 22 (3.6%) |
| 60 to 64 Years | 0 (0.0%) | 51 (8.3%) |
| 65 to 69 Years | 18 (5.4%) | 30 (4.9%) |
| 70 to 74 Years | 0 (0.0%) | 27 (4.4%) |
| 75 to 79 Years | 23 (6.9%) | 30 (4.9%) |
| 80 to 84 Years | 0 (0.0%) | 0 (0.0%) |
| 85 Years and over | 0 (0.0%) | 30 (4.9%) |
| Total | 333 (100.0%) | 613 (100.0%) |
Families and Households in Crescent
Median Family Size in Crescent
The median family size in Crescent is 2.66 persons per family, with single female/mother families (206 | 62.8%) accounting for the largest median family size of 2.79 persons per family. On the other hand, single male/father families (21 | 6.4%) represent the smallest median family size with 1.81 persons per family.
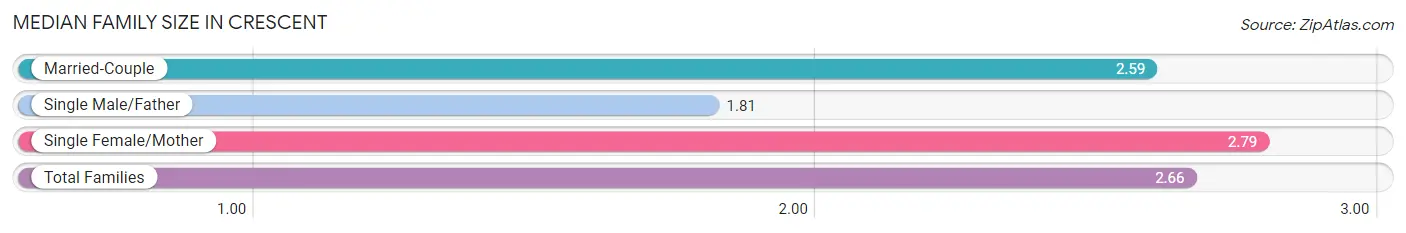
| Family Type | # Families | Family Size |
| Married-Couple | 101 (30.8%) | 2.59 |
| Single Male/Father | 21 (6.4%) | 1.81 |
| Single Female/Mother | 206 (62.8%) | 2.79 |
| Total Families | 328 (100.0%) | 2.66 |
Median Household Size in Crescent
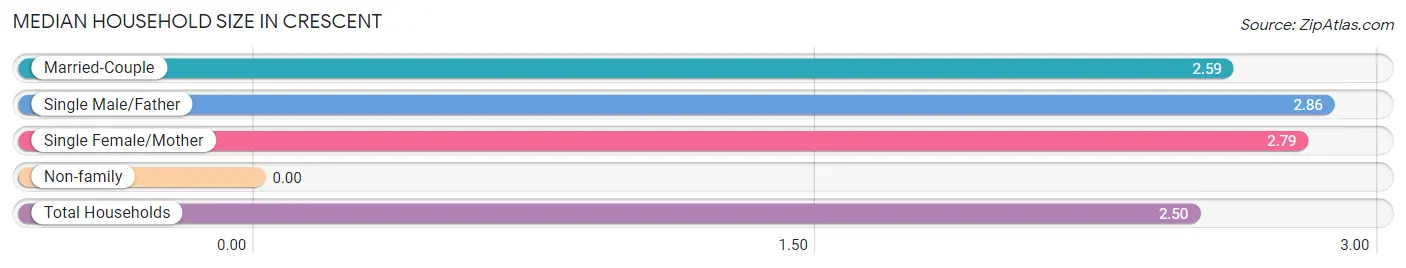
| Household Type | # Households | Household Size |
| Married-Couple | 101 (26.7%) | 2.59 |
| Single Male/Father | 21 (5.6%) | 2.86 |
| Single Female/Mother | 206 (54.5%) | 2.79 |
| Non-family | 50 (13.2%) | - |
| Total Households | 378 (100.0%) | 2.50 |
Household Size by Marriage Status in Crescent
Out of a total of 378 households in Crescent, 328 (86.8%) are family households, while 50 (13.2%) are nonfamily households. The most numerous type of family households are 2-person households, comprising 107, and the most common type of nonfamily households are 1-person households, comprising 50.
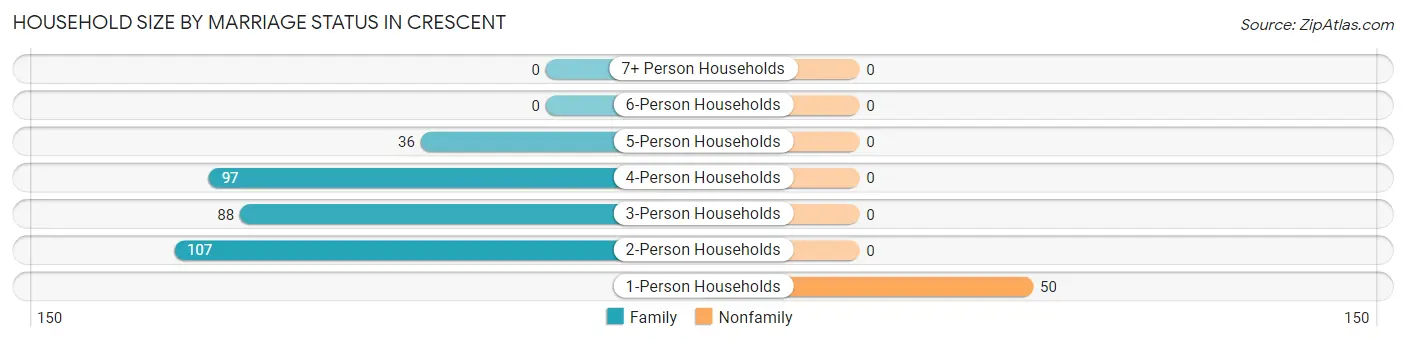
| Household Size | Family Households | Nonfamily Households |
| 1-Person Households | - | 50 (13.2%) |
| 2-Person Households | 107 (28.3%) | 0 (0.0%) |
| 3-Person Households | 88 (23.3%) | 0 (0.0%) |
| 4-Person Households | 97 (25.7%) | 0 (0.0%) |
| 5-Person Households | 36 (9.5%) | 0 (0.0%) |
| 6-Person Households | 0 (0.0%) | 0 (0.0%) |
| 7+ Person Households | 0 (0.0%) | 0 (0.0%) |
| Total | 328 (86.8%) | 50 (13.2%) |
Female Fertility in Crescent
Fertility by Age in Crescent
| Age Bracket | Women with Births | Births / 1,000 Women |
| 15 to 19 years | 0 (0.0%) | 0.0 |
| 20 to 34 years | 0 (0.0%) | 0.0 |
| 35 to 50 years | 0 (0.0%) | 0.0 |
| Total | 0 (0.0%) | 0.0 |
Fertility by Age by Marriage Status in Crescent
| Age Bracket | Married | Unmarried |
| 15 to 19 years | 0 (0.0%) | 0 (0.0%) |
| 20 to 34 years | 0 (0.0%) | 0 (0.0%) |
| 35 to 50 years | 0 (0.0%) | 0 (0.0%) |
| Total | 0 (0.0%) | 0 (0.0%) |
Fertility by Education in Crescent
| Educational Attainment | Women with Births | Births / 1,000 Women |
| Less than High School | 0 (0.0%) | 0.0 |
| High School Diploma | 0 (0.0%) | 0.0 |
| College or Associate's Degree | 0 (0.0%) | 0.0 |
| Bachelor's Degree | 0 (0.0%) | 0.0 |
| Graduate Degree | 0 (0.0%) | 0.0 |
| Total | 0 (0.0%) | 0.0 |
Fertility by Education by Marriage Status in Crescent
| Educational Attainment | Married | Unmarried |
| Less than High School | 0 (0.0%) | 0 (0.0%) |
| High School Diploma | 0 (0.0%) | 0 (0.0%) |
| College or Associate's Degree | 0 (0.0%) | 0 (0.0%) |
| Bachelor's Degree | 0 (0.0%) | 0 (0.0%) |
| Graduate Degree | 0 (0.0%) | 0 (0.0%) |
| Total | 0 (0.0%) | 0 (0.0%) |
Employment Characteristics in Crescent
Employment by Class of Employer in Crescent
Among the 301 employed individuals in Crescent, local government employees (143 | 47.5%), private company employees (94 | 31.2%), and state government employees (64 | 21.3%) make up the most common classes of employment.
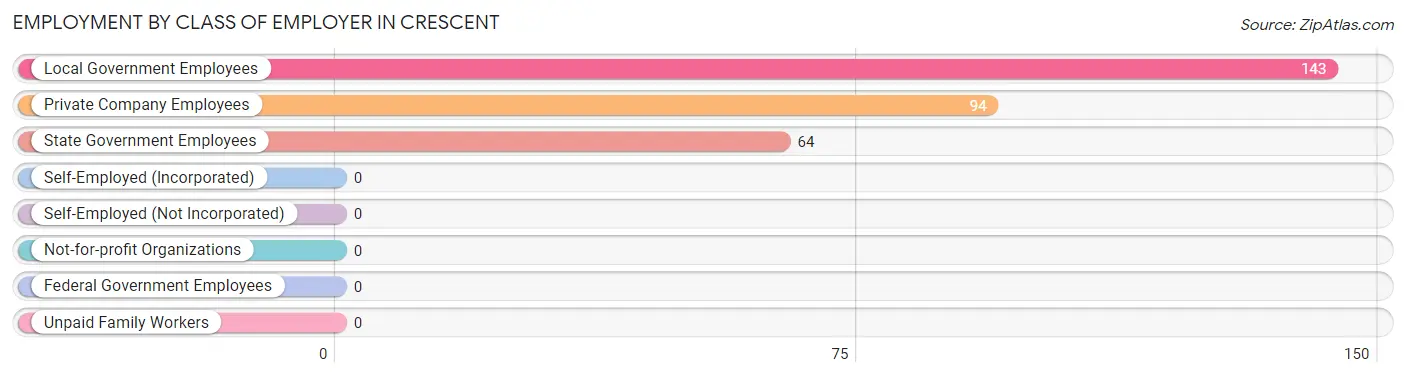
| Employer Class | # Employees | % Employees |
| Private Company Employees | 94 | 31.2% |
| Self-Employed (Incorporated) | 0 | 0.0% |
| Self-Employed (Not Incorporated) | 0 | 0.0% |
| Not-for-profit Organizations | 0 | 0.0% |
| Local Government Employees | 143 | 47.5% |
| State Government Employees | 64 | 21.3% |
| Federal Government Employees | 0 | 0.0% |
| Unpaid Family Workers | 0 | 0.0% |
| Total | 301 | 100.0% |
Employment Status by Age in Crescent
According to the labor force statistics for Crescent, out of the total population over 16 years of age (657), 50.7% or 333 individuals are in the labor force, with 5.1% or 17 of them unemployed. The age group with the highest labor force participation rate is 25 to 29 years, with 100.0% or 97 individuals in the labor force. Within the labor force, the 35 to 44 years age range has the highest percentage of unemployed individuals, with 18.7% or 17 of them being unemployed.
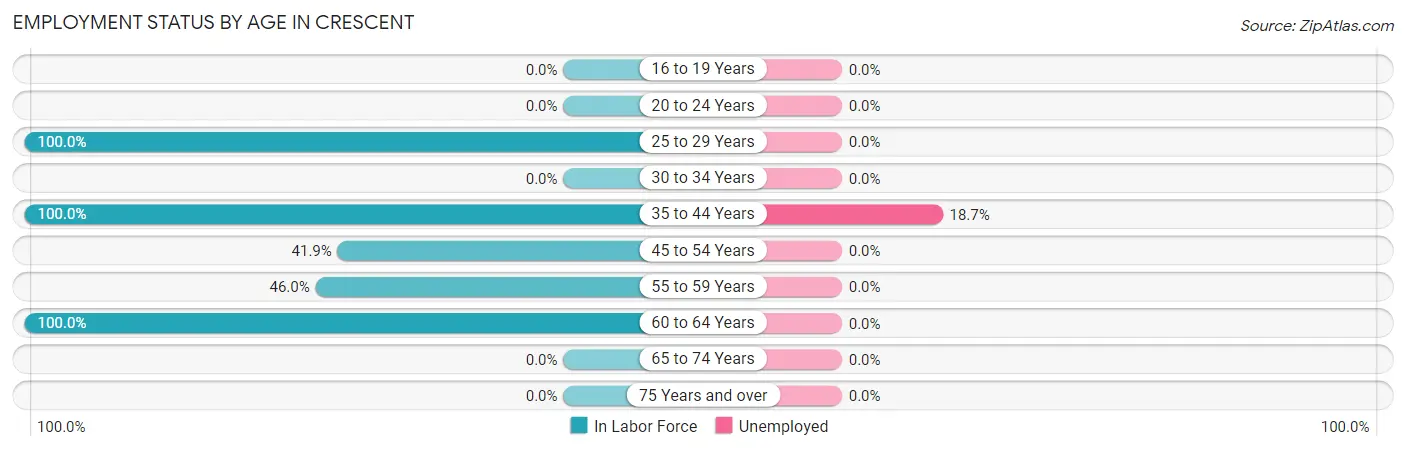
| Age Bracket | In Labor Force | Unemployed |
| 16 to 19 Years | 0 (0.0%) | 0 (0.0%) |
| 20 to 24 Years | 0 (0.0%) | 0 (0.0%) |
| 25 to 29 Years | 97 (100.0%) | 0 (0.0%) |
| 30 to 34 Years | 0 (0.0%) | 0 (0.0%) |
| 35 to 44 Years | 91 (100.0%) | 17 (18.7%) |
| 45 to 54 Years | 36 (41.9%) | 0 (0.0%) |
| 55 to 59 Years | 58 (46.0%) | 0 (0.0%) |
| 60 to 64 Years | 51 (100.0%) | 0 (0.0%) |
| 65 to 74 Years | 0 (0.0%) | 0 (0.0%) |
| 75 Years and over | 0 (0.0%) | 0 (0.0%) |
| Total | 333 (50.7%) | 17 (5.1%) |
Employment Status by Educational Attainment in Crescent
According to labor force statistics for Crescent, 73.8% of individuals (333) out of the total population between 25 and 64 years of age (451) are in the labor force, with 5.1% or 17 of them being unemployed. The group with the highest labor force participation rate are those with the educational attainment of high school diploma, with 100.0% or 169 individuals in the labor force. Within the labor force, individuals with less than high school education have the highest percentage of unemployment, with 100.0% or 17 of them being unemployed.
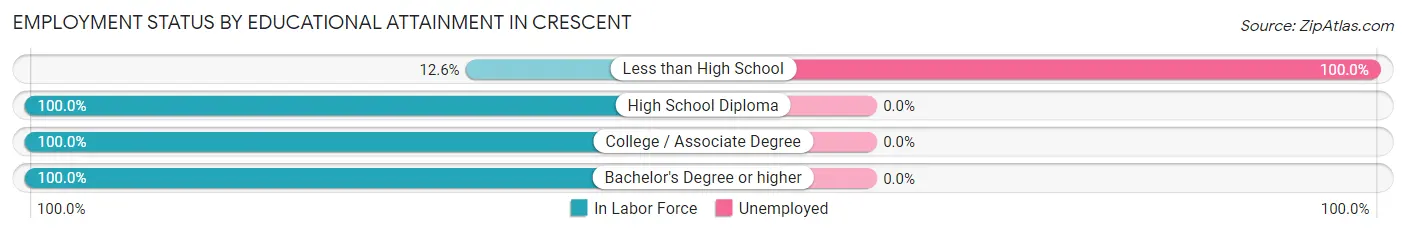
| Educational Attainment | In Labor Force | Unemployed |
| Less than High School | 17 (12.6%) | 135 (100.0%) |
| High School Diploma | 169 (100.0%) | 0 (0.0%) |
| College / Associate Degree | 73 (100.0%) | 0 (0.0%) |
| Bachelor's Degree or higher | 74 (100.0%) | 0 (0.0%) |
| Total | 333 (73.8%) | 23 (5.1%) |
Employment Occupations by Sex in Crescent
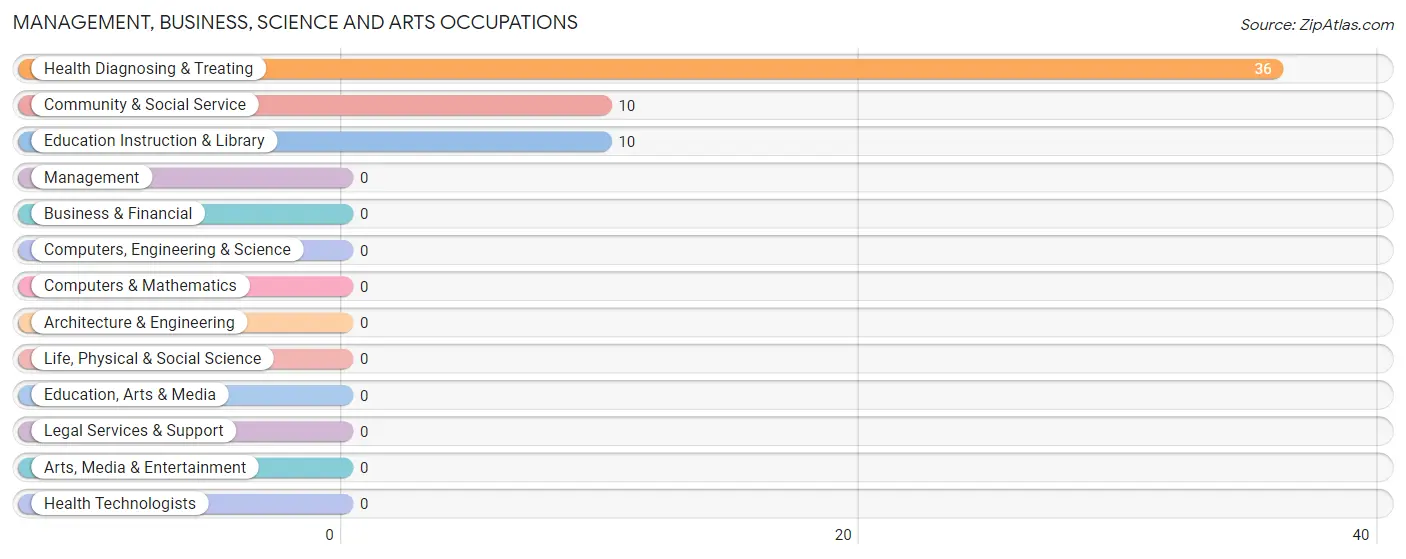
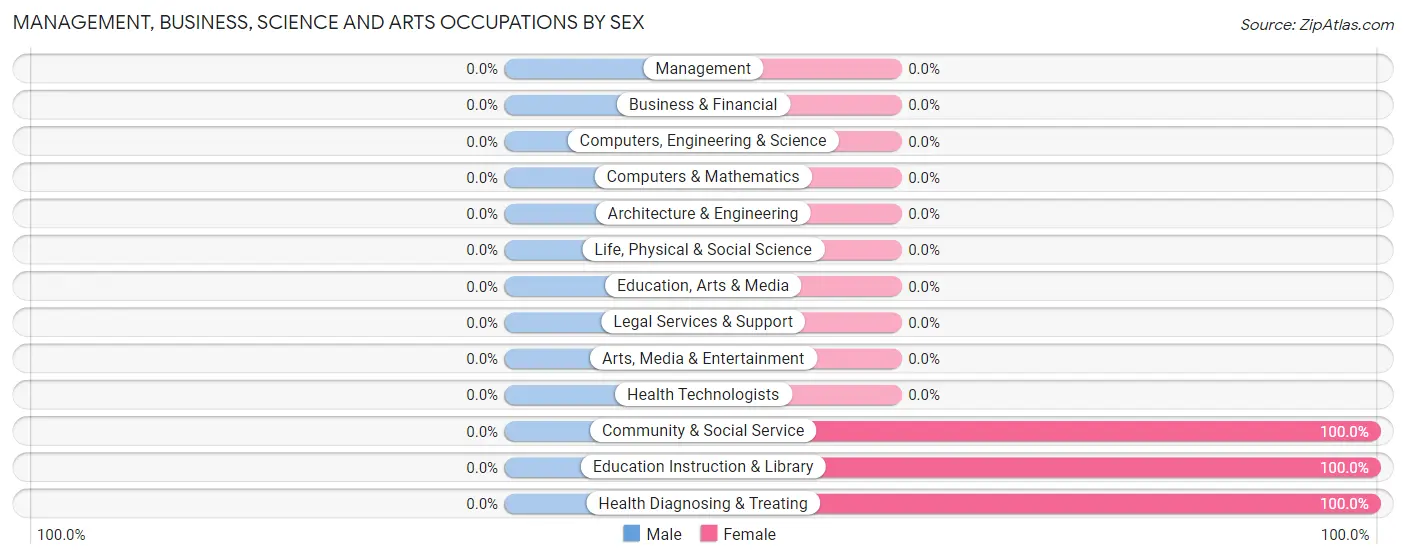
Management, Business, Science and Arts Occupations
The most common Management, Business, Science and Arts occupations in Crescent are Health Diagnosing & Treating (36 | 11.4%), Community & Social Service (10 | 3.2%), and Education Instruction & Library (10 | 3.2%).
Management, Business, Science and Arts Occupations by Sex
| Occupation | Male | Female |
| Management | 0 (0.0%) | 0 (0.0%) |
| Business & Financial | 0 (0.0%) | 0 (0.0%) |
| Computers, Engineering & Science | 0 (0.0%) | 0 (0.0%) |
| Computers & Mathematics | 0 (0.0%) | 0 (0.0%) |
| Architecture & Engineering | 0 (0.0%) | 0 (0.0%) |
| Life, Physical & Social Science | 0 (0.0%) | 0 (0.0%) |
| Community & Social Service | 0 (0.0%) | 10 (100.0%) |
| Education, Arts & Media | 0 (0.0%) | 0 (0.0%) |
| Legal Services & Support | 0 (0.0%) | 0 (0.0%) |
| Education Instruction & Library | 0 (0.0%) | 10 (100.0%) |
| Arts, Media & Entertainment | 0 (0.0%) | 0 (0.0%) |
| Health Diagnosing & Treating | 0 (0.0%) | 36 (100.0%) |
| Health Technologists | 0 (0.0%) | 0 (0.0%) |
| Total (Category) | 0 (0.0%) | 46 (100.0%) |
| Total (Overall) | 94 (29.7%) | 222 (70.3%) |
Services Occupations
Services Occupations by Sex
| Occupation | Male | Female |
| Healthcare Support | 0 (0.0%) | 0 (0.0%) |
| Security & Protection | 0 (0.0%) | 0 (0.0%) |
| Firefighting & Prevention | 0 (0.0%) | 0 (0.0%) |
| Law Enforcement | 0 (0.0%) | 0 (0.0%) |
| Food Preparation & Serving | 0 (0.0%) | 0 (0.0%) |
| Cleaning & Maintenance | 0 (0.0%) | 0 (0.0%) |
| Personal Care & Service | 0 (0.0%) | 0 (0.0%) |
| Total (Category) | 0 (0.0%) | 0 (0.0%) |
| Total (Overall) | 94 (29.7%) | 222 (70.3%) |
Sales and Office Occupations
The most common Sales and Office occupations in Crescent are , and Office & Administration (176 | 55.7%).
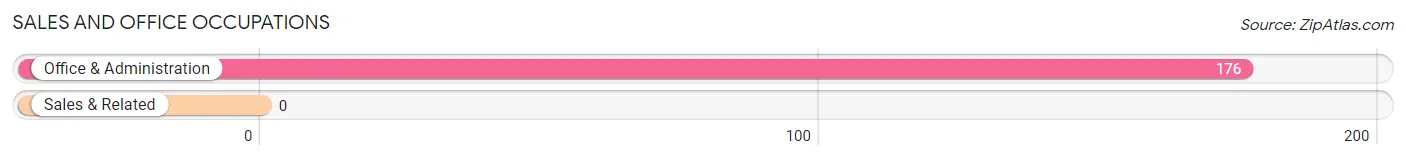
Sales and Office Occupations by Sex
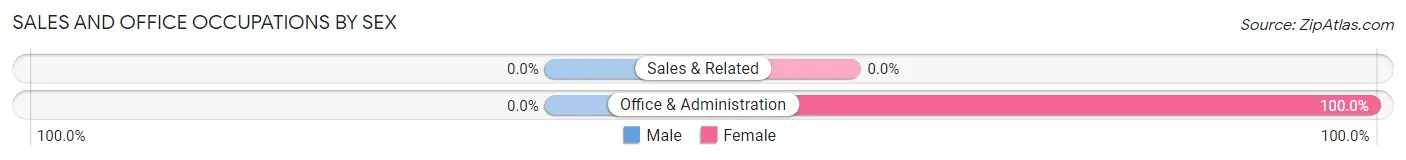
| Occupation | Male | Female |
| Sales & Related | 0 (0.0%) | 0 (0.0%) |
| Office & Administration | 0 (0.0%) | 176 (100.0%) |
| Total (Category) | 0 (0.0%) | 176 (100.0%) |
| Total (Overall) | 94 (29.7%) | 222 (70.3%) |
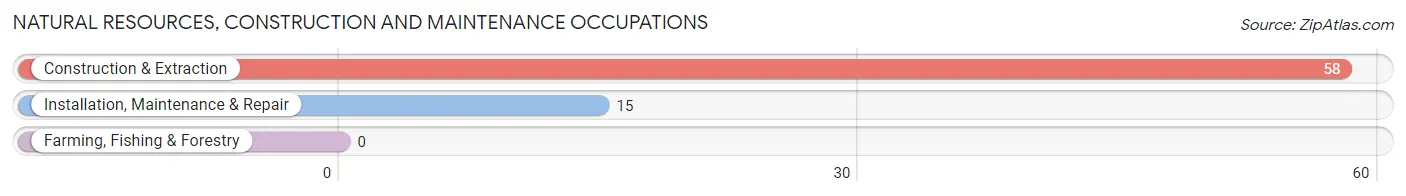
Natural Resources, Construction and Maintenance Occupations
The most common Natural Resources, Construction and Maintenance occupations in Crescent are Construction & Extraction (58 | 18.3%), and Installation, Maintenance & Repair (15 | 4.8%).
Natural Resources, Construction and Maintenance Occupations by Sex
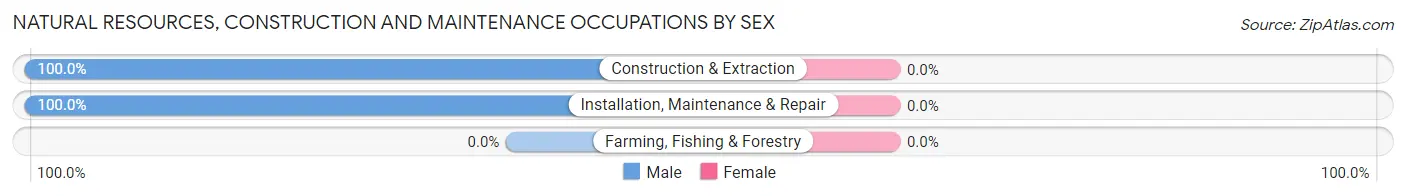
| Occupation | Male | Female |
| Farming, Fishing & Forestry | 0 (0.0%) | 0 (0.0%) |
| Construction & Extraction | 58 (100.0%) | 0 (0.0%) |
| Installation, Maintenance & Repair | 15 (100.0%) | 0 (0.0%) |
| Total (Category) | 73 (100.0%) | 0 (0.0%) |
| Total (Overall) | 94 (29.7%) | 222 (70.3%) |
Production, Transportation and Moving Occupations
The most common Production, Transportation and Moving occupations in Crescent are , and Material Moving (21 | 6.7%).
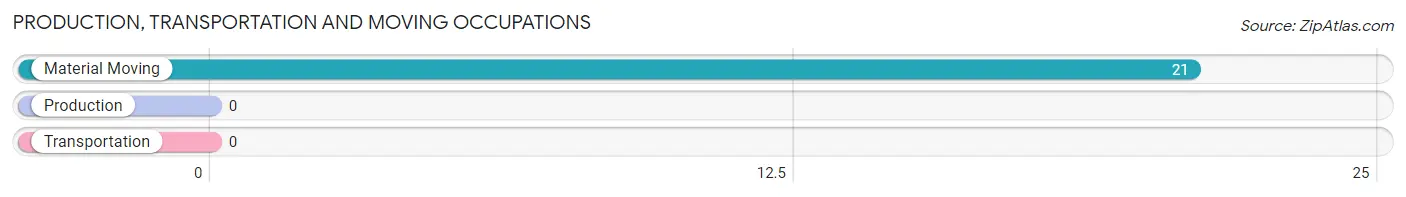
Production, Transportation and Moving Occupations by Sex
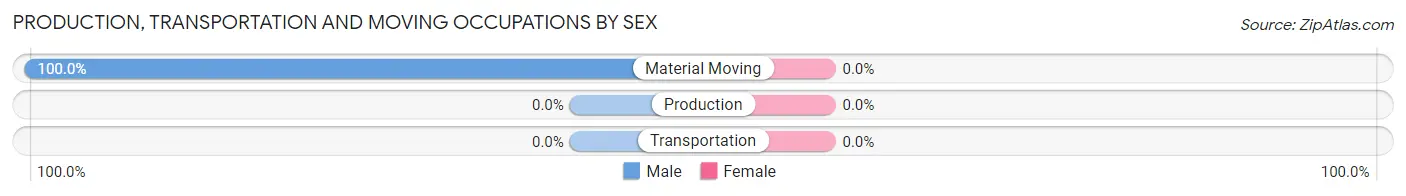
| Occupation | Male | Female |
| Production | 0 (0.0%) | 0 (0.0%) |
| Transportation | 0 (0.0%) | 0 (0.0%) |
| Material Moving | 21 (100.0%) | 0 (0.0%) |
| Total (Category) | 21 (100.0%) | 0 (0.0%) |
| Total (Overall) | 94 (29.7%) | 222 (70.3%) |
Employment Industries by Sex in Crescent
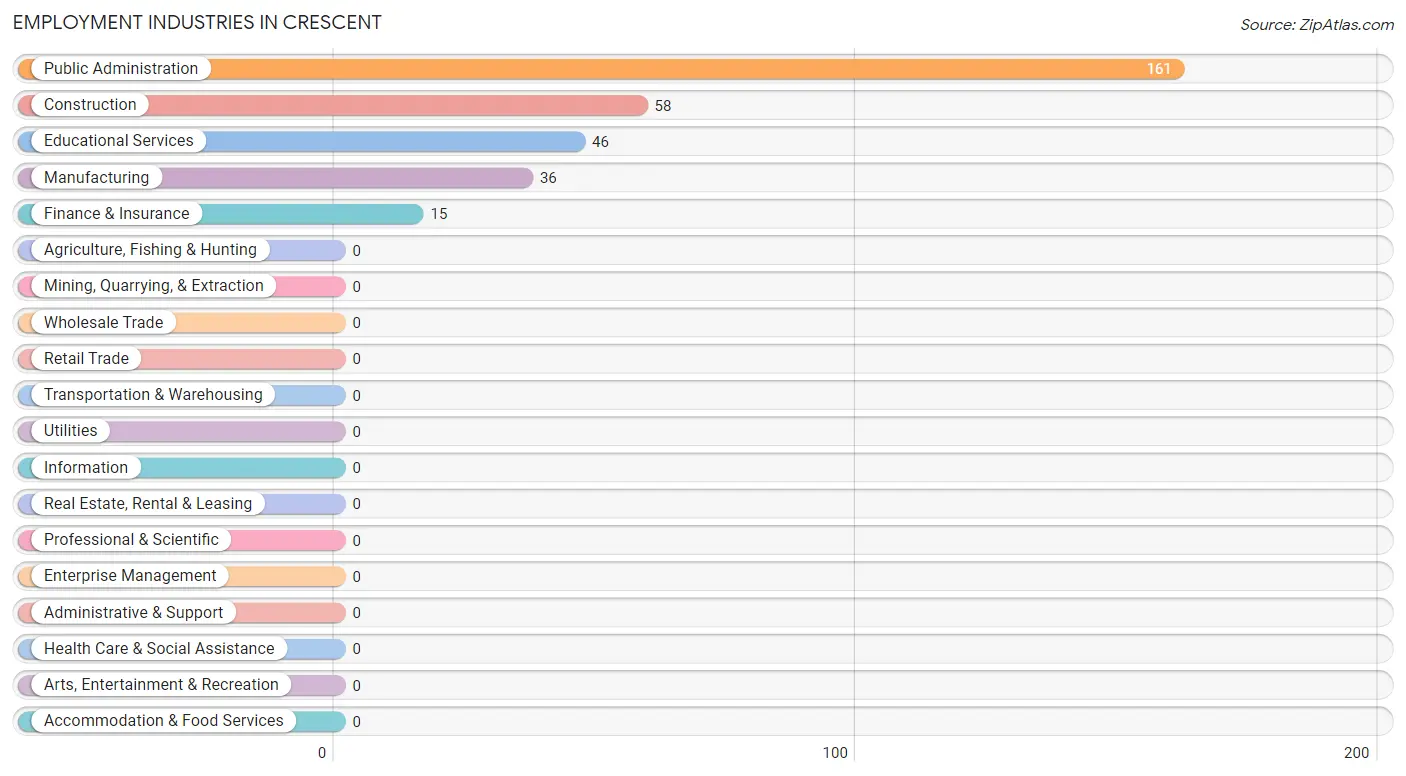
Employment Industries in Crescent
The major employment industries in Crescent include Public Administration (161 | 50.9%), Construction (58 | 18.3%), Educational Services (46 | 14.6%), Manufacturing (36 | 11.4%), and Finance & Insurance (15 | 4.8%).
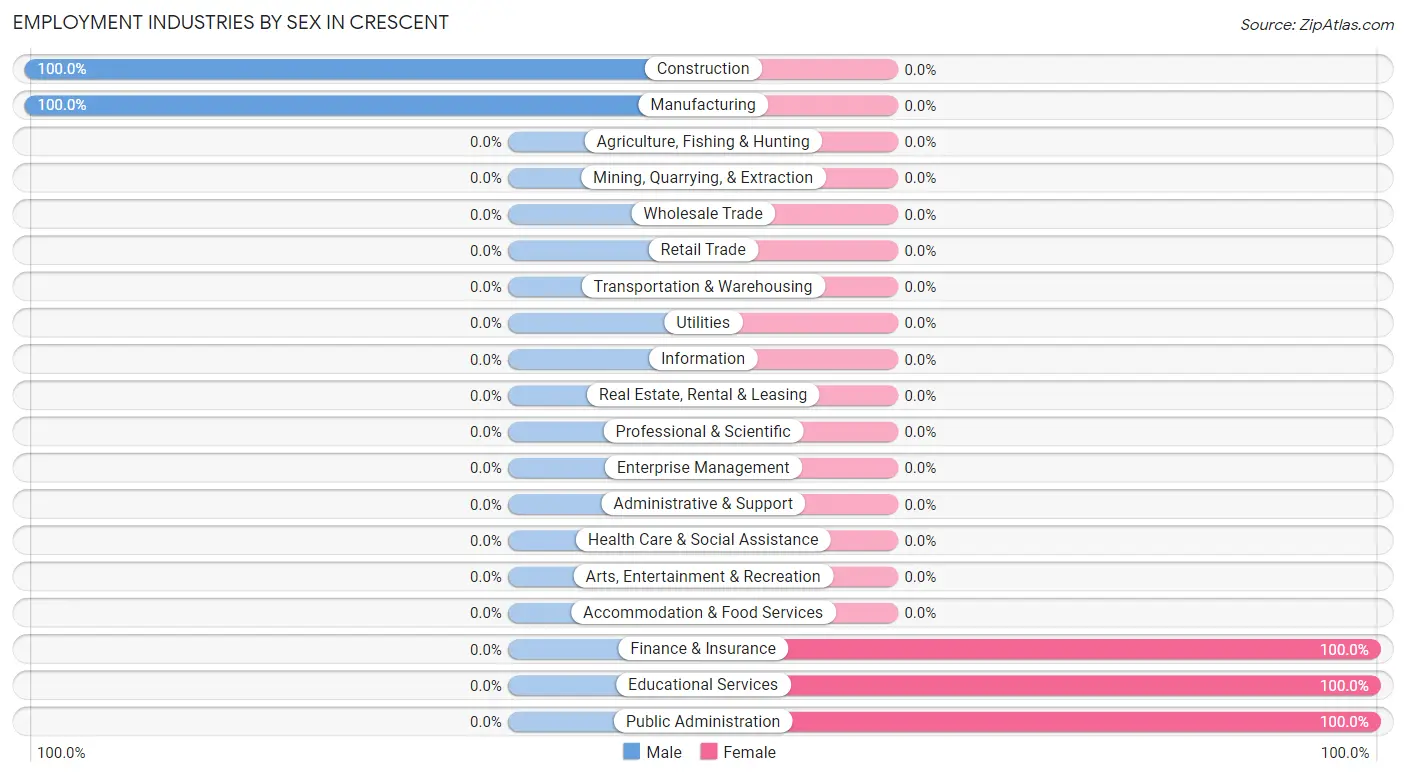
Employment Industries by Sex in Crescent
The Crescent industries that see more men than women are Construction (100.0%), and Manufacturing (100.0%), whereas the industries that tend to have a higher number of women are Finance & Insurance (100.0%), Educational Services (100.0%), and Public Administration (100.0%).
| Industry | Male | Female |
| Agriculture, Fishing & Hunting | 0 (0.0%) | 0 (0.0%) |
| Mining, Quarrying, & Extraction | 0 (0.0%) | 0 (0.0%) |
| Construction | 58 (100.0%) | 0 (0.0%) |
| Manufacturing | 36 (100.0%) | 0 (0.0%) |
| Wholesale Trade | 0 (0.0%) | 0 (0.0%) |
| Retail Trade | 0 (0.0%) | 0 (0.0%) |
| Transportation & Warehousing | 0 (0.0%) | 0 (0.0%) |
| Utilities | 0 (0.0%) | 0 (0.0%) |
| Information | 0 (0.0%) | 0 (0.0%) |
| Finance & Insurance | 0 (0.0%) | 15 (100.0%) |
| Real Estate, Rental & Leasing | 0 (0.0%) | 0 (0.0%) |
| Professional & Scientific | 0 (0.0%) | 0 (0.0%) |
| Enterprise Management | 0 (0.0%) | 0 (0.0%) |
| Administrative & Support | 0 (0.0%) | 0 (0.0%) |
| Educational Services | 0 (0.0%) | 46 (100.0%) |
| Health Care & Social Assistance | 0 (0.0%) | 0 (0.0%) |
| Arts, Entertainment & Recreation | 0 (0.0%) | 0 (0.0%) |
| Accommodation & Food Services | 0 (0.0%) | 0 (0.0%) |
| Public Administration | 0 (0.0%) | 161 (100.0%) |
| Total | 94 (29.7%) | 222 (70.3%) |
Education in Crescent
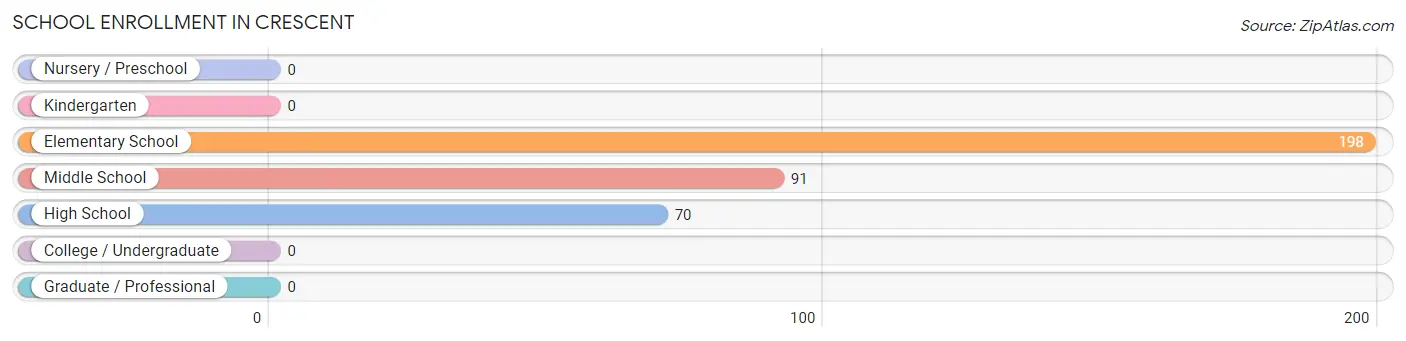
School Enrollment in Crescent
The most common levels of schooling among the 359 students in Crescent are elementary school (198 | 55.1%), middle school (91 | 25.4%), and high school (70 | 19.5%).
| School Level | # Students | % Students |
| Nursery / Preschool | 0 | 0.0% |
| Kindergarten | 0 | 0.0% |
| Elementary School | 198 | 55.1% |
| Middle School | 91 | 25.4% |
| High School | 70 | 19.5% |
| College / Undergraduate | 0 | 0.0% |
| Graduate / Professional | 0 | 0.0% |
| Total | 359 | 100.0% |
School Enrollment by Age by Funding Source in Crescent
Out of a total of 359 students who are enrolled in schools in Crescent, 84 (23.4%) attend a private institution, while the remaining 275 (76.6%) are enrolled in public schools. The age group of 35 years and over has the highest likelihood of being enrolled in private schools, with 22 (100.0% in the age bracket) enrolled. Conversely, the age group of 10 to 14 year olds has the lowest likelihood of being enrolled in a private school, with 91 (100.0% in the age bracket) attending a public institution.
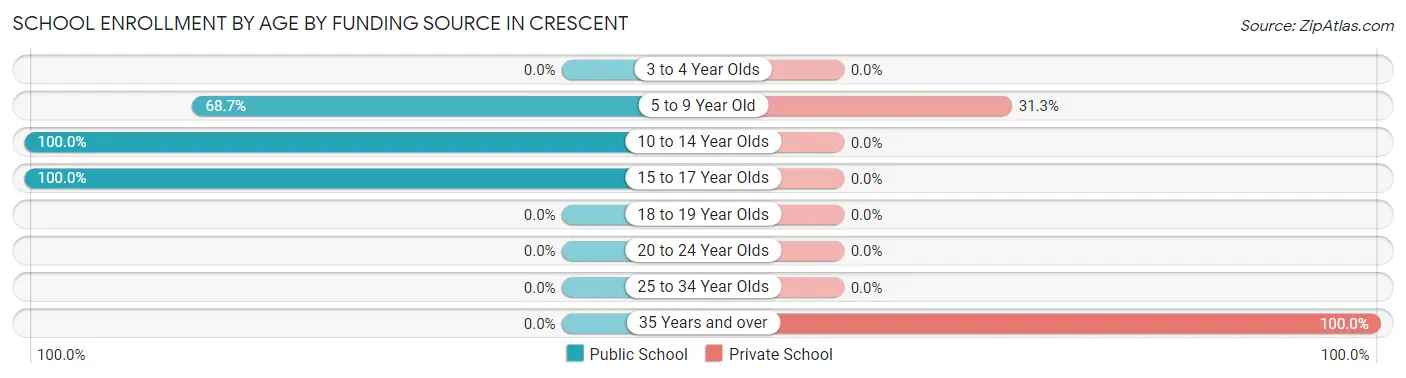
| Age Bracket | Public School | Private School |
| 3 to 4 Year Olds | 0 (0.0%) | 0 (0.0%) |
| 5 to 9 Year Old | 136 (68.7%) | 62 (31.3%) |
| 10 to 14 Year Olds | 91 (100.0%) | 0 (0.0%) |
| 15 to 17 Year Olds | 48 (100.0%) | 0 (0.0%) |
| 18 to 19 Year Olds | 0 (0.0%) | 0 (0.0%) |
| 20 to 24 Year Olds | 0 (0.0%) | 0 (0.0%) |
| 25 to 34 Year Olds | 0 (0.0%) | 0 (0.0%) |
| 35 Years and over | 0 (0.0%) | 22 (100.0%) |
| Total | 275 (76.6%) | 84 (23.4%) |
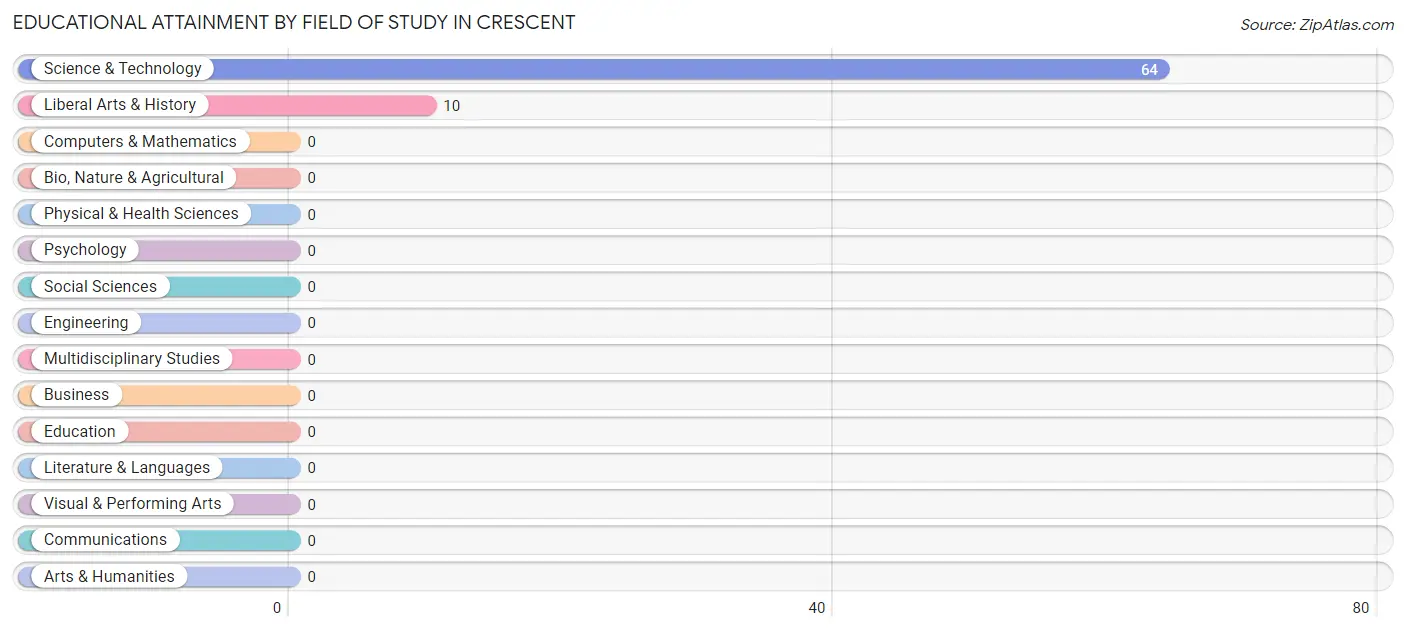
Educational Attainment by Field of Study in Crescent
Science & technology (64 | 86.5%), and liberal arts & history (10 | 13.5%) are the most common fields of study among 74 individuals in Crescent who have obtained a bachelor's degree or higher.
| Field of Study | # Graduates | % Graduates |
| Computers & Mathematics | 0 | 0.0% |
| Bio, Nature & Agricultural | 0 | 0.0% |
| Physical & Health Sciences | 0 | 0.0% |
| Psychology | 0 | 0.0% |
| Social Sciences | 0 | 0.0% |
| Engineering | 0 | 0.0% |
| Multidisciplinary Studies | 0 | 0.0% |
| Science & Technology | 64 | 86.5% |
| Business | 0 | 0.0% |
| Education | 0 | 0.0% |
| Literature & Languages | 0 | 0.0% |
| Liberal Arts & History | 10 | 13.5% |
| Visual & Performing Arts | 0 | 0.0% |
| Communications | 0 | 0.0% |
| Arts & Humanities | 0 | 0.0% |
| Total | 74 | 100.0% |
Transportation & Commute in Crescent
Vehicle Availability by Sex in Crescent
The most prevalent vehicle ownership categories in Crescent are males with 2 vehicles (79, accounting for 100.0%) and females with 2 vehicles (112, making up 35.6%).
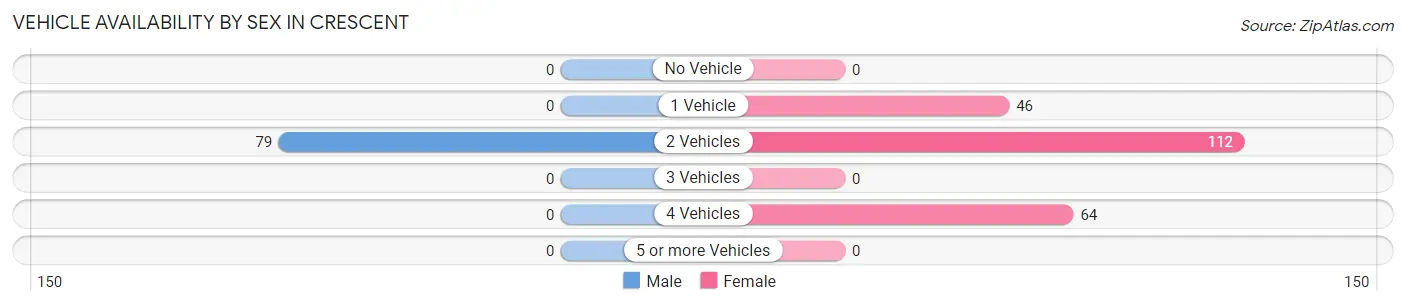
| Vehicles Available | Male | Female |
| No Vehicle | 0 (0.0%) | 0 (0.0%) |
| 1 Vehicle | 0 (0.0%) | 46 (20.7%) |
| 2 Vehicles | 79 (100.0%) | 112 (50.4%) |
| 3 Vehicles | 0 (0.0%) | 0 (0.0%) |
| 4 Vehicles | 0 (0.0%) | 64 (28.8%) |
| 5 or more Vehicles | 0 (0.0%) | 0 (0.0%) |
| Total | 79 (100.0%) | 222 (100.0%) |
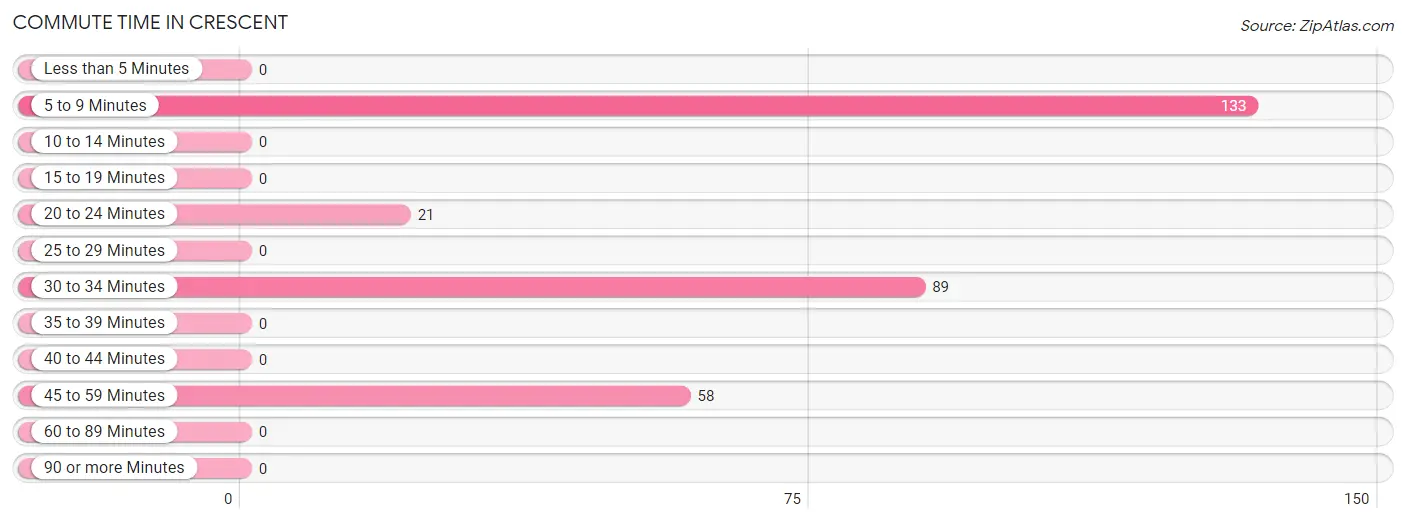
Commute Time in Crescent
The most frequently occuring commute durations in Crescent are 5 to 9 minutes (133 commuters, 44.2%), 30 to 34 minutes (89 commuters, 29.6%), and 45 to 59 minutes (58 commuters, 19.3%).
| Commute Time | # Commuters | % Commuters |
| Less than 5 Minutes | 0 | 0.0% |
| 5 to 9 Minutes | 133 | 44.2% |
| 10 to 14 Minutes | 0 | 0.0% |
| 15 to 19 Minutes | 0 | 0.0% |
| 20 to 24 Minutes | 21 | 7.0% |
| 25 to 29 Minutes | 0 | 0.0% |
| 30 to 34 Minutes | 89 | 29.6% |
| 35 to 39 Minutes | 0 | 0.0% |
| 40 to 44 Minutes | 0 | 0.0% |
| 45 to 59 Minutes | 58 | 19.3% |
| 60 to 89 Minutes | 0 | 0.0% |
| 90 or more Minutes | 0 | 0.0% |
Commute Time by Sex in Crescent
The most common commute times in Crescent are 45 to 59 minutes (58 commuters, 73.4%) for males and 5 to 9 minutes (133 commuters, 59.9%) for females.
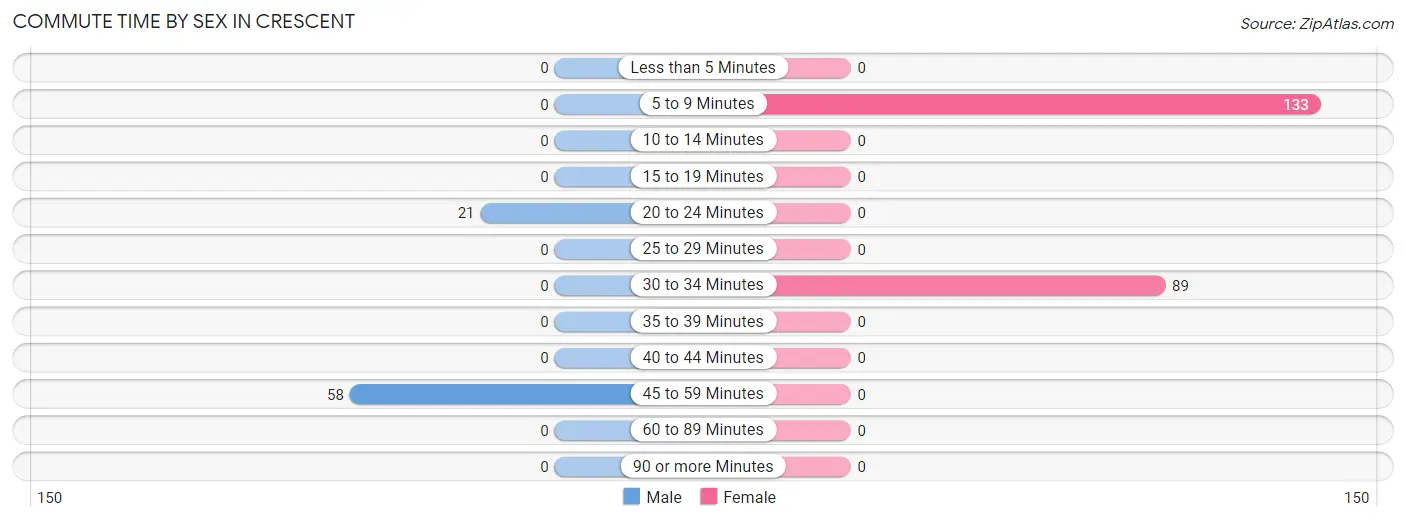
| Commute Time | Male | Female |
| Less than 5 Minutes | 0 (0.0%) | 0 (0.0%) |
| 5 to 9 Minutes | 0 (0.0%) | 133 (59.9%) |
| 10 to 14 Minutes | 0 (0.0%) | 0 (0.0%) |
| 15 to 19 Minutes | 0 (0.0%) | 0 (0.0%) |
| 20 to 24 Minutes | 21 (26.6%) | 0 (0.0%) |
| 25 to 29 Minutes | 0 (0.0%) | 0 (0.0%) |
| 30 to 34 Minutes | 0 (0.0%) | 89 (40.1%) |
| 35 to 39 Minutes | 0 (0.0%) | 0 (0.0%) |
| 40 to 44 Minutes | 0 (0.0%) | 0 (0.0%) |
| 45 to 59 Minutes | 58 (73.4%) | 0 (0.0%) |
| 60 to 89 Minutes | 0 (0.0%) | 0 (0.0%) |
| 90 or more Minutes | 0 (0.0%) | 0 (0.0%) |
Time of Departure to Work by Sex in Crescent
The most frequent times of departure to work in Crescent are 5:30 AM to 5:59 AM (58, 73.4%) for males and 7:30 AM to 7:59 AM (97, 43.7%) for females.
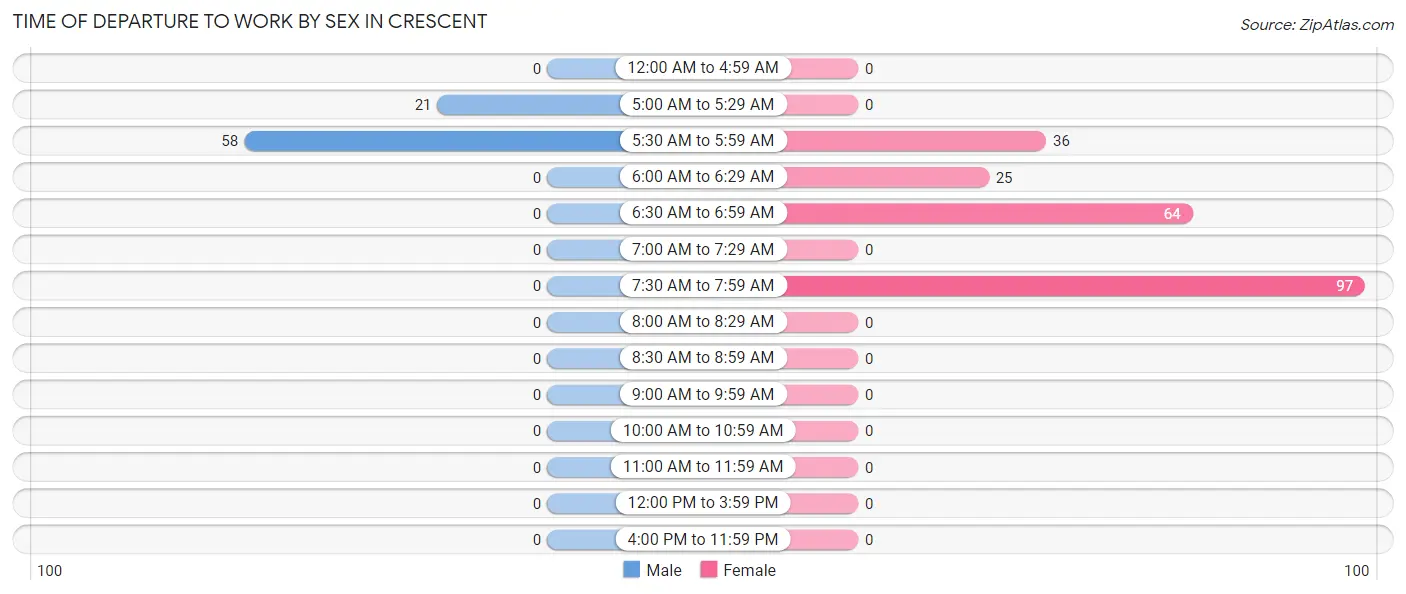
| Time of Departure | Male | Female |
| 12:00 AM to 4:59 AM | 0 (0.0%) | 0 (0.0%) |
| 5:00 AM to 5:29 AM | 21 (26.6%) | 0 (0.0%) |
| 5:30 AM to 5:59 AM | 58 (73.4%) | 36 (16.2%) |
| 6:00 AM to 6:29 AM | 0 (0.0%) | 25 (11.3%) |
| 6:30 AM to 6:59 AM | 0 (0.0%) | 64 (28.8%) |
| 7:00 AM to 7:29 AM | 0 (0.0%) | 0 (0.0%) |
| 7:30 AM to 7:59 AM | 0 (0.0%) | 97 (43.7%) |
| 8:00 AM to 8:29 AM | 0 (0.0%) | 0 (0.0%) |
| 8:30 AM to 8:59 AM | 0 (0.0%) | 0 (0.0%) |
| 9:00 AM to 9:59 AM | 0 (0.0%) | 0 (0.0%) |
| 10:00 AM to 10:59 AM | 0 (0.0%) | 0 (0.0%) |
| 11:00 AM to 11:59 AM | 0 (0.0%) | 0 (0.0%) |
| 12:00 PM to 3:59 PM | 0 (0.0%) | 0 (0.0%) |
| 4:00 PM to 11:59 PM | 0 (0.0%) | 0 (0.0%) |
| Total | 79 (100.0%) | 222 (100.0%) |
Housing Occupancy in Crescent
Occupancy by Ownership in Crescent
Of the total 378 dwellings in Crescent, owner-occupied units account for 278 (73.5%), while renter-occupied units make up 100 (26.5%).
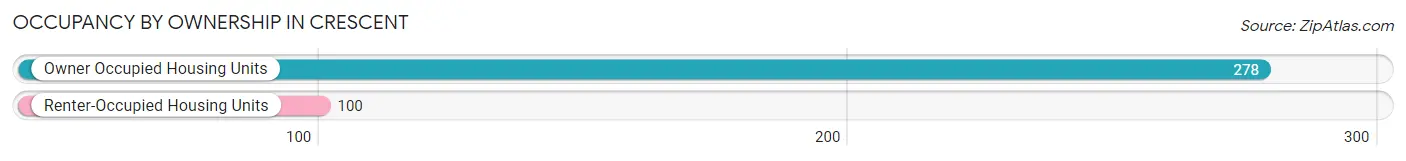
| Occupancy | # Housing Units | % Housing Units |
| Owner Occupied Housing Units | 278 | 73.5% |
| Renter-Occupied Housing Units | 100 | 26.5% |
| Total Occupied Housing Units | 378 | 100.0% |
Occupancy by Household Size in Crescent
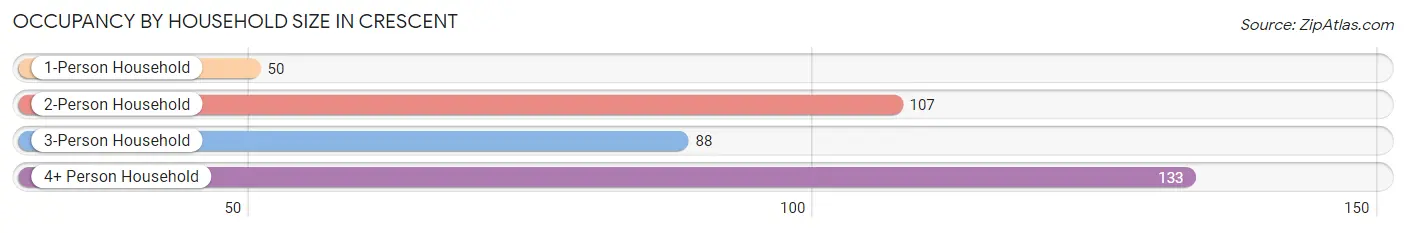
| Household Size | # Housing Units | % Housing Units |
| 1-Person Household | 50 | 13.2% |
| 2-Person Household | 107 | 28.3% |
| 3-Person Household | 88 | 23.3% |
| 4+ Person Household | 133 | 35.2% |
| Total Housing Units | 378 | 100.0% |
Occupancy by Ownership by Household Size in Crescent
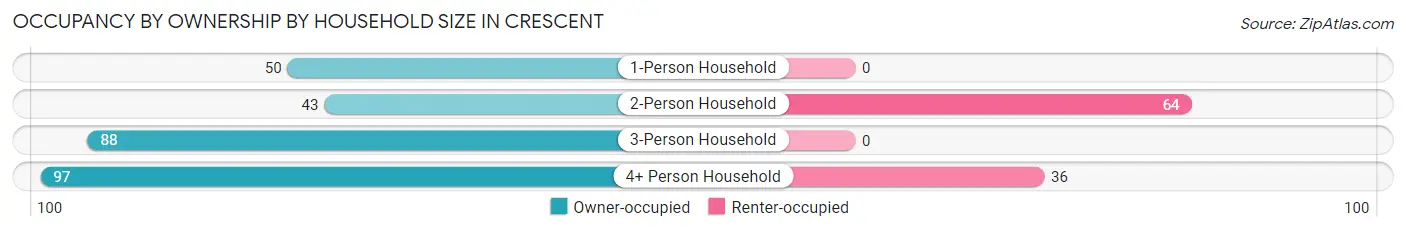
| Household Size | Owner-occupied | Renter-occupied |
| 1-Person Household | 50 (100.0%) | 0 (0.0%) |
| 2-Person Household | 43 (40.2%) | 64 (59.8%) |
| 3-Person Household | 88 (100.0%) | 0 (0.0%) |
| 4+ Person Household | 97 (72.9%) | 36 (27.1%) |
| Total Housing Units | 278 (73.5%) | 100 (26.5%) |
Occupancy by Educational Attainment in Crescent
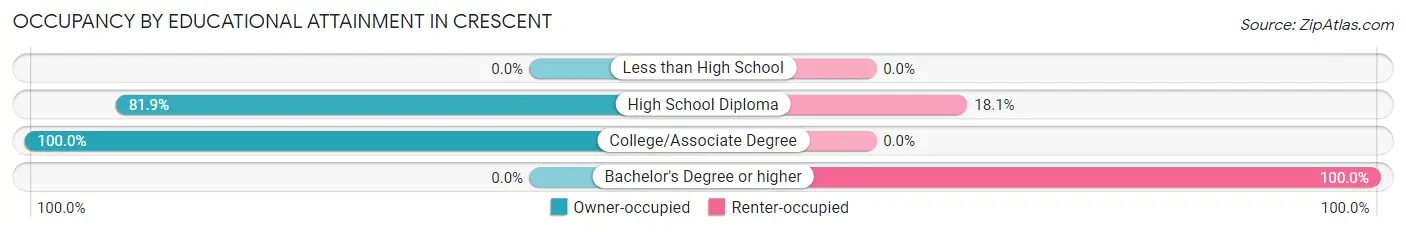
| Household Size | Owner-occupied | Renter-occupied |
| Less than High School | 0 (0.0%) | 0 (0.0%) |
| High School Diploma | 163 (81.9%) | 36 (18.1%) |
| College/Associate Degree | 115 (100.0%) | 0 (0.0%) |
| Bachelor's Degree or higher | 0 (0.0%) | 64 (100.0%) |
Occupancy by Age of Householder in Crescent
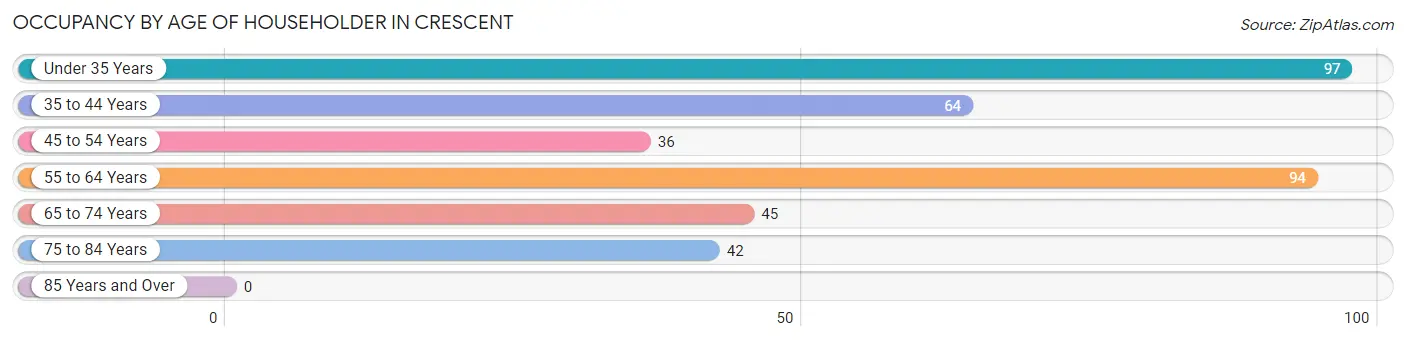
| Age Bracket | # Households | % Households |
| Under 35 Years | 97 | 25.7% |
| 35 to 44 Years | 64 | 16.9% |
| 45 to 54 Years | 36 | 9.5% |
| 55 to 64 Years | 94 | 24.9% |
| 65 to 74 Years | 45 | 11.9% |
| 75 to 84 Years | 42 | 11.1% |
| 85 Years and Over | 0 | 0.0% |
| Total | 378 | 100.0% |
Housing Finances in Crescent
Median Income by Occupancy in Crescent
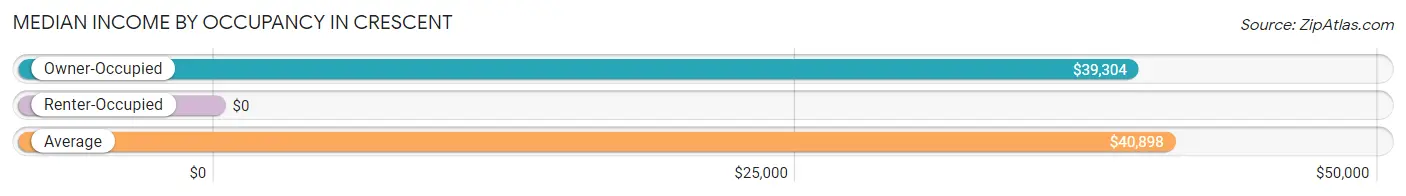
| Occupancy Type | # Households | Median Income |
| Owner-Occupied | 278 (73.5%) | $39,304 |
| Renter-Occupied | 100 (26.5%) | $0 |
| Average | 378 (100.0%) | $40,898 |
Occupancy by Householder Income Bracket in Crescent
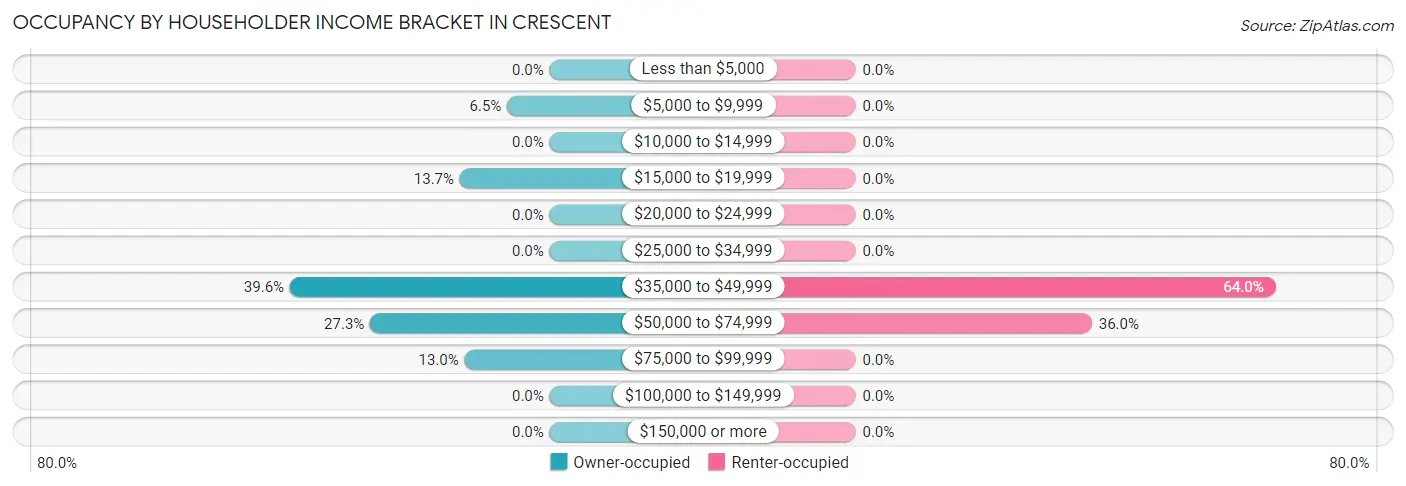
| Income Bracket | Owner-occupied | Renter-occupied |
| Less than $5,000 | 0 (0.0%) | 0 (0.0%) |
| $5,000 to $9,999 | 18 (6.5%) | 0 (0.0%) |
| $10,000 to $14,999 | 0 (0.0%) | 0 (0.0%) |
| $15,000 to $19,999 | 38 (13.7%) | 0 (0.0%) |
| $20,000 to $24,999 | 0 (0.0%) | 0 (0.0%) |
| $25,000 to $34,999 | 0 (0.0%) | 0 (0.0%) |
| $35,000 to $49,999 | 110 (39.6%) | 64 (64.0%) |
| $50,000 to $74,999 | 76 (27.3%) | 36 (36.0%) |
| $75,000 to $99,999 | 36 (13.0%) | 0 (0.0%) |
| $100,000 to $149,999 | 0 (0.0%) | 0 (0.0%) |
| $150,000 or more | 0 (0.0%) | 0 (0.0%) |
| Total | 278 (100.0%) | 100 (100.0%) |
Monthly Housing Cost Tiers in Crescent
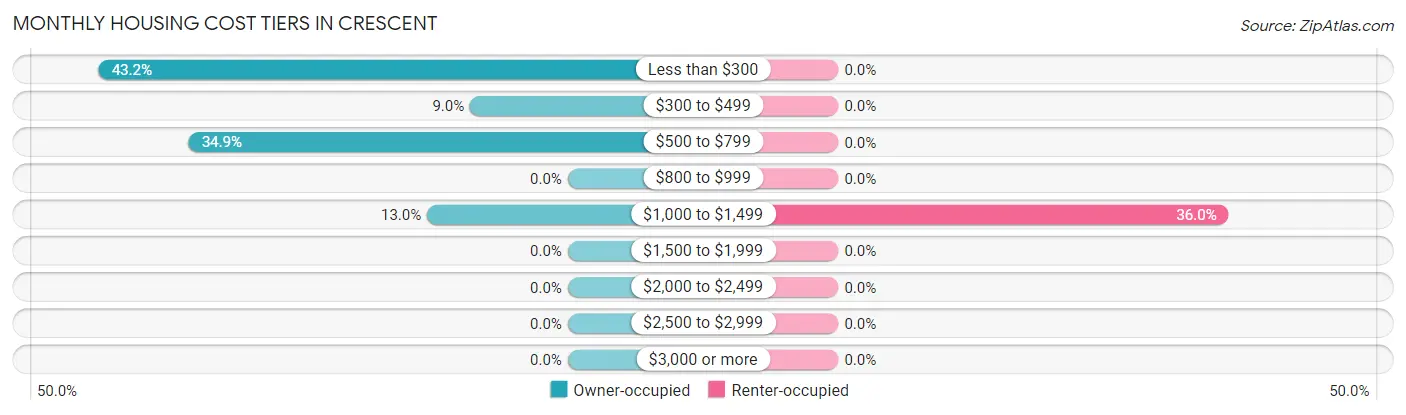
| Monthly Cost | Owner-occupied | Renter-occupied |
| Less than $300 | 120 (43.2%) | 0 (0.0%) |
| $300 to $499 | 25 (9.0%) | 0 (0.0%) |
| $500 to $799 | 97 (34.9%) | 0 (0.0%) |
| $800 to $999 | 0 (0.0%) | 0 (0.0%) |
| $1,000 to $1,499 | 36 (13.0%) | 36 (36.0%) |
| $1,500 to $1,999 | 0 (0.0%) | 0 (0.0%) |
| $2,000 to $2,499 | 0 (0.0%) | 0 (0.0%) |
| $2,500 to $2,999 | 0 (0.0%) | 0 (0.0%) |
| $3,000 or more | 0 (0.0%) | 0 (0.0%) |
| Total | 278 (100.0%) | 100 (100.0%) |
Physical Housing Characteristics in Crescent
Housing Structures in Crescent
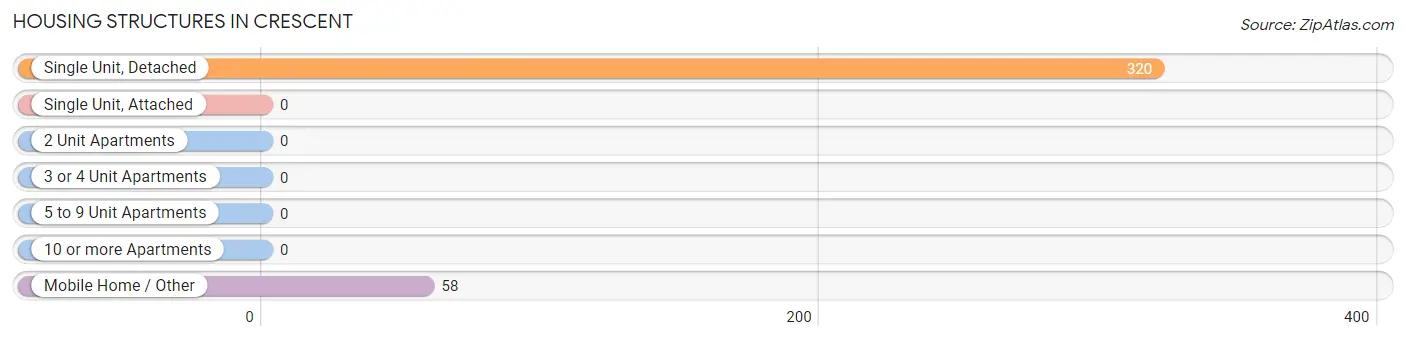
| Structure Type | # Housing Units | % Housing Units |
| Single Unit, Detached | 320 | 84.7% |
| Single Unit, Attached | 0 | 0.0% |
| 2 Unit Apartments | 0 | 0.0% |
| 3 or 4 Unit Apartments | 0 | 0.0% |
| 5 to 9 Unit Apartments | 0 | 0.0% |
| 10 or more Apartments | 0 | 0.0% |
| Mobile Home / Other | 58 | 15.3% |
| Total | 378 | 100.0% |
Housing Structures by Occupancy in Crescent
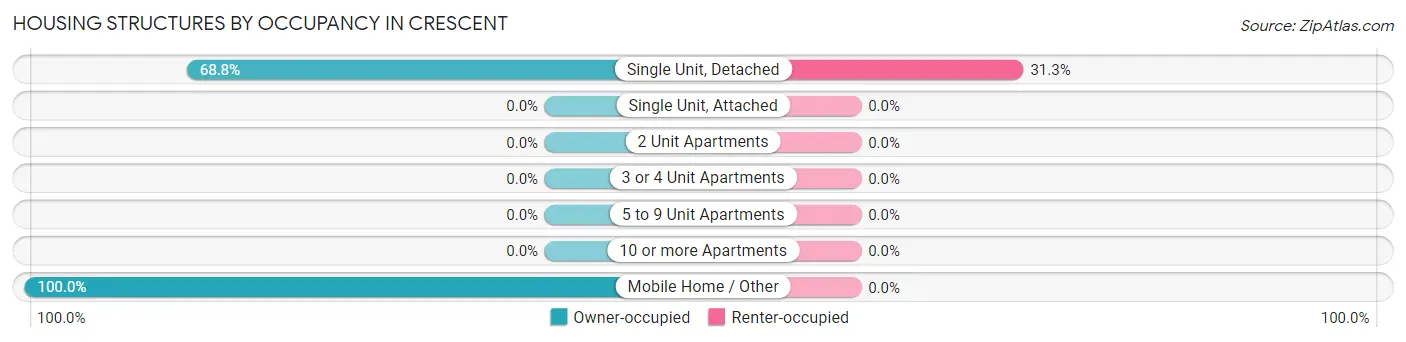
| Structure Type | Owner-occupied | Renter-occupied |
| Single Unit, Detached | 220 (68.8%) | 100 (31.2%) |
| Single Unit, Attached | 0 (0.0%) | 0 (0.0%) |
| 2 Unit Apartments | 0 (0.0%) | 0 (0.0%) |
| 3 or 4 Unit Apartments | 0 (0.0%) | 0 (0.0%) |
| 5 to 9 Unit Apartments | 0 (0.0%) | 0 (0.0%) |
| 10 or more Apartments | 0 (0.0%) | 0 (0.0%) |
| Mobile Home / Other | 58 (100.0%) | 0 (0.0%) |
| Total | 278 (73.5%) | 100 (26.5%) |
Housing Structures by Number of Rooms in Crescent
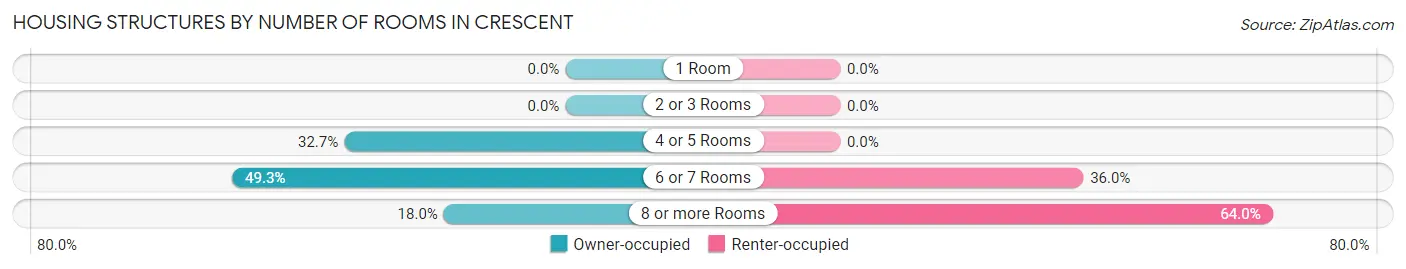
| Number of Rooms | Owner-occupied | Renter-occupied |
| 1 Room | 0 (0.0%) | 0 (0.0%) |
| 2 or 3 Rooms | 0 (0.0%) | 0 (0.0%) |
| 4 or 5 Rooms | 91 (32.7%) | 0 (0.0%) |
| 6 or 7 Rooms | 137 (49.3%) | 36 (36.0%) |
| 8 or more Rooms | 50 (18.0%) | 64 (64.0%) |
| Total | 278 (100.0%) | 100 (100.0%) |
Housing Structure by Heating Type in Crescent
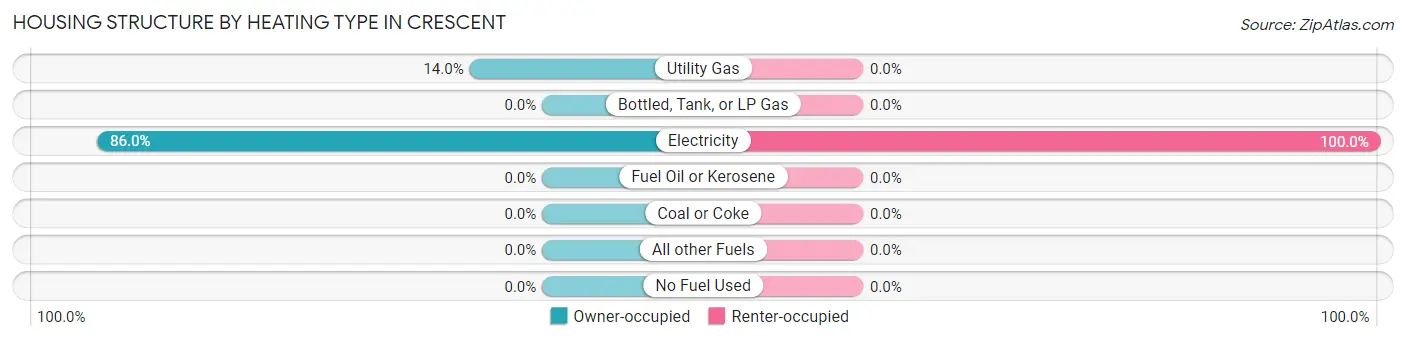
| Heating Type | Owner-occupied | Renter-occupied |
| Utility Gas | 39 (14.0%) | 0 (0.0%) |
| Bottled, Tank, or LP Gas | 0 (0.0%) | 0 (0.0%) |
| Electricity | 239 (86.0%) | 100 (100.0%) |
| Fuel Oil or Kerosene | 0 (0.0%) | 0 (0.0%) |
| Coal or Coke | 0 (0.0%) | 0 (0.0%) |
| All other Fuels | 0 (0.0%) | 0 (0.0%) |
| No Fuel Used | 0 (0.0%) | 0 (0.0%) |
| Total | 278 (100.0%) | 100 (100.0%) |
Household Vehicle Usage in Crescent
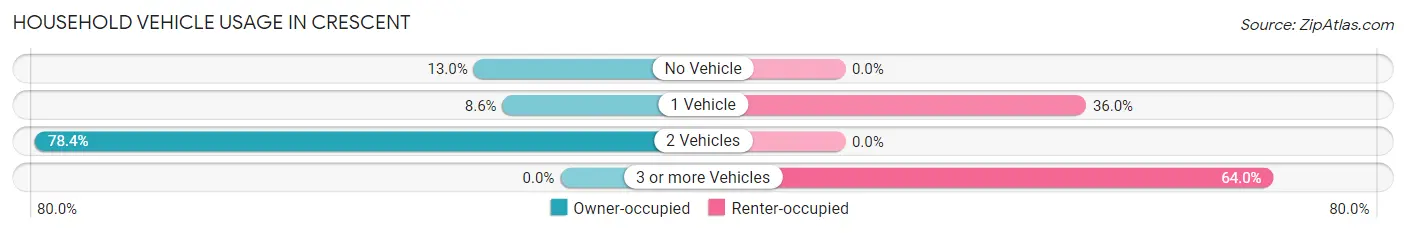
| Vehicles per Household | Owner-occupied | Renter-occupied |
| No Vehicle | 36 (13.0%) | 0 (0.0%) |
| 1 Vehicle | 24 (8.6%) | 36 (36.0%) |
| 2 Vehicles | 218 (78.4%) | 0 (0.0%) |
| 3 or more Vehicles | 0 (0.0%) | 64 (64.0%) |
| Total | 278 (100.0%) | 100 (100.0%) |
Real Estate & Mortgages in Crescent
Real Estate and Mortgage Overview in Crescent
| Characteristic | Without Mortgage | With Mortgage |
| Housing Units | 145 | 133 |
| Median Property Value | $110,100 | $0 |
| Median Household Income | $58,556 | $0 |
| Monthly Housing Costs | $172 | $0 |
| Real Estate Taxes | - | - |
Property Value by Mortgage Status in Crescent
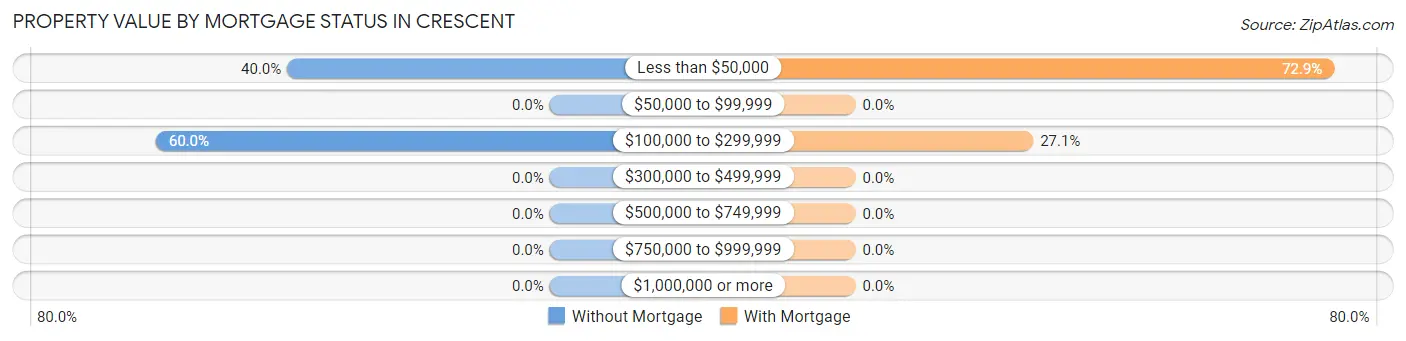
| Property Value | Without Mortgage | With Mortgage |
| Less than $50,000 | 58 (40.0%) | 97 (72.9%) |
| $50,000 to $99,999 | 0 (0.0%) | 0 (0.0%) |
| $100,000 to $299,999 | 87 (60.0%) | 36 (27.1%) |
| $300,000 to $499,999 | 0 (0.0%) | 0 (0.0%) |
| $500,000 to $749,999 | 0 (0.0%) | 0 (0.0%) |
| $750,000 to $999,999 | 0 (0.0%) | 0 (0.0%) |
| $1,000,000 or more | 0 (0.0%) | 0 (0.0%) |
| Total | 145 (100.0%) | 133 (100.0%) |
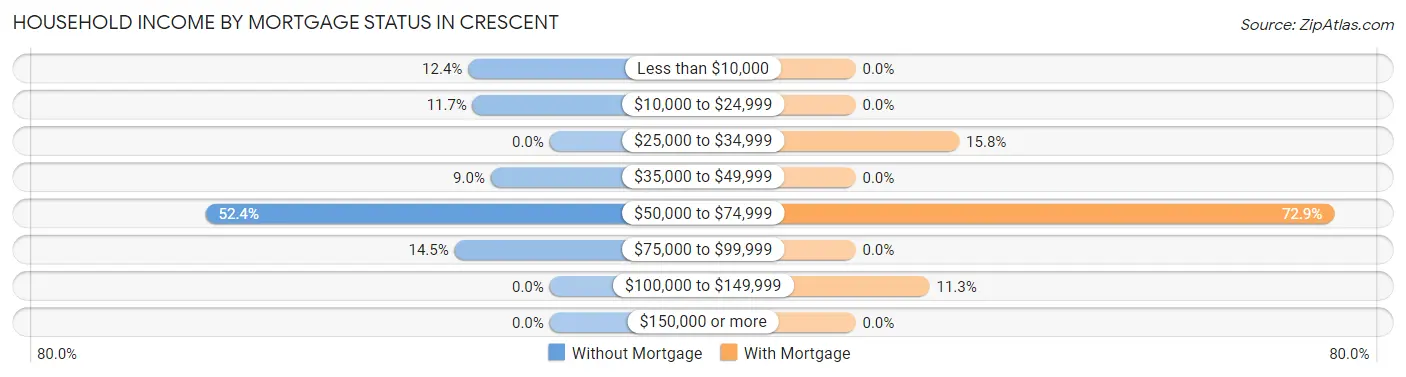
Household Income by Mortgage Status in Crescent
| Household Income | Without Mortgage | With Mortgage |
| Less than $10,000 | 18 (12.4%) | 0 (0.0%) |
| $10,000 to $24,999 | 17 (11.7%) | 0 (0.0%) |
| $25,000 to $34,999 | 0 (0.0%) | 21 (15.8%) |
| $35,000 to $49,999 | 13 (9.0%) | 0 (0.0%) |
| $50,000 to $74,999 | 76 (52.4%) | 97 (72.9%) |
| $75,000 to $99,999 | 21 (14.5%) | 0 (0.0%) |
| $100,000 to $149,999 | 0 (0.0%) | 15 (11.3%) |
| $150,000 or more | 0 (0.0%) | 0 (0.0%) |
| Total | 145 (100.0%) | 133 (100.0%) |
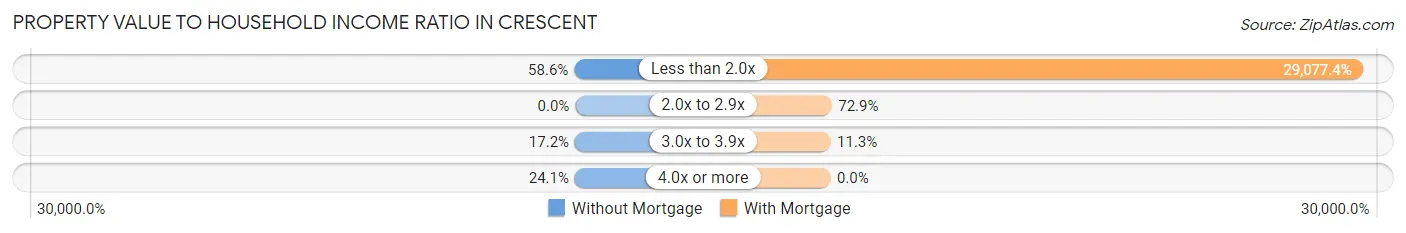
Property Value to Household Income Ratio in Crescent
| Value-to-Income Ratio | Without Mortgage | With Mortgage |
| Less than 2.0x | 85 (58.6%) | 38,673 (29,077.4%) |
| 2.0x to 2.9x | 0 (0.0%) | 97 (72.9%) |
| 3.0x to 3.9x | 25 (17.2%) | 15 (11.3%) |
| 4.0x or more | 35 (24.1%) | 0 (0.0%) |
| Total | 145 (100.0%) | 133 (100.0%) |
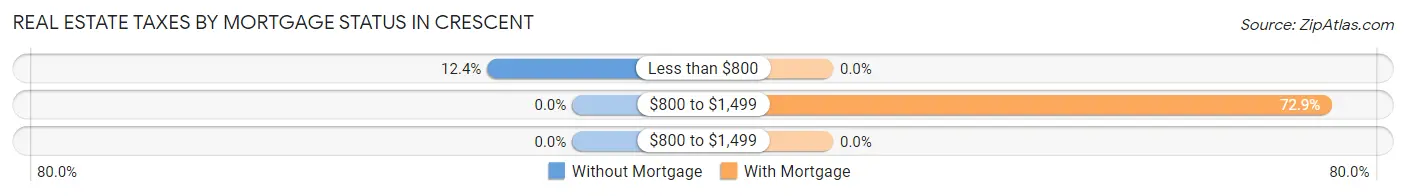
Real Estate Taxes by Mortgage Status in Crescent
| Property Taxes | Without Mortgage | With Mortgage |
| Less than $800 | 18 (12.4%) | 0 (0.0%) |
| $800 to $1,499 | 0 (0.0%) | 97 (72.9%) |
| $800 to $1,499 | 0 (0.0%) | 0 (0.0%) |
| Total | 145 (100.0%) | 133 (100.0%) |
Health & Disability in Crescent
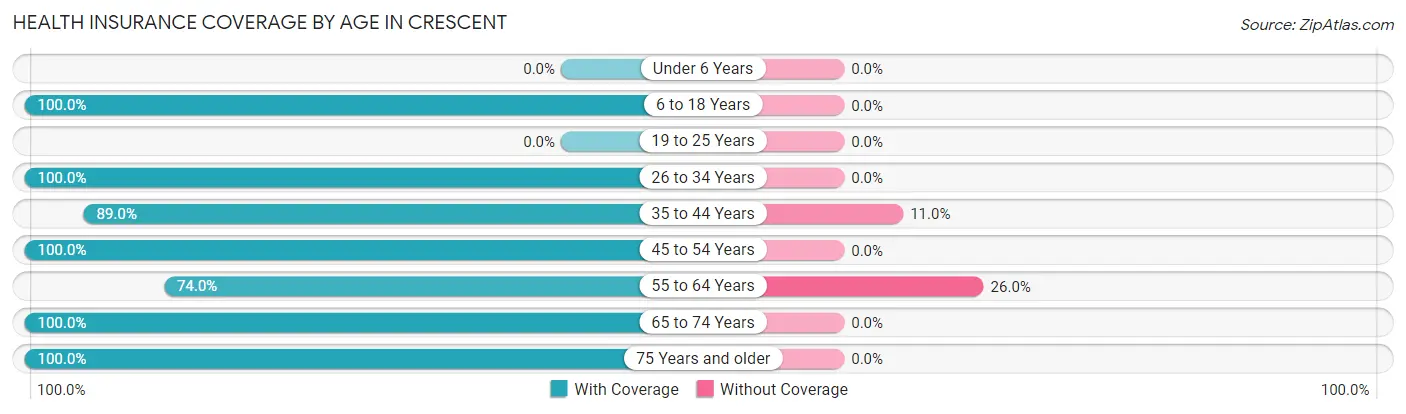
Health Insurance Coverage by Age in Crescent
| Age Bracket | With Coverage | Without Coverage |
| Under 6 Years | 0 (0.0%) | 0 (0.0%) |
| 6 to 18 Years | 337 (100.0%) | 0 (0.0%) |
| 19 to 25 Years | 0 (0.0%) | 0 (0.0%) |
| 26 to 34 Years | 97 (100.0%) | 0 (0.0%) |
| 35 to 44 Years | 81 (89.0%) | 10 (11.0%) |
| 45 to 54 Years | 86 (100.0%) | 0 (0.0%) |
| 55 to 64 Years | 131 (74.0%) | 46 (26.0%) |
| 65 to 74 Years | 75 (100.0%) | 0 (0.0%) |
| 75 Years and older | 83 (100.0%) | 0 (0.0%) |
| Total | 890 (94.1%) | 56 (5.9%) |
Health Insurance Coverage by Citizenship Status in Crescent
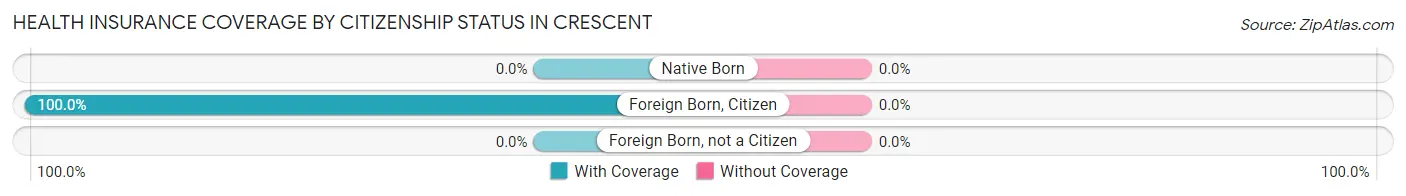
| Citizenship Status | With Coverage | Without Coverage |
| Native Born | 0 (0.0%) | 0 (0.0%) |
| Foreign Born, Citizen | 337 (100.0%) | 0 (0.0%) |
| Foreign Born, not a Citizen | 0 (0.0%) | 0 (0.0%) |
Health Insurance Coverage by Household Income in Crescent
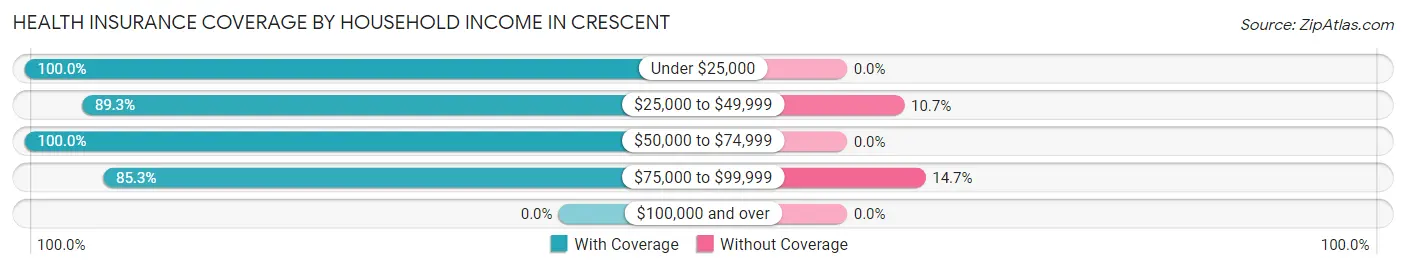
| Household Income | With Coverage | Without Coverage |
| Under $25,000 | 95 (100.0%) | 0 (0.0%) |
| $25,000 to $49,999 | 383 (89.3%) | 46 (10.7%) |
| $50,000 to $74,999 | 354 (100.0%) | 0 (0.0%) |
| $75,000 to $99,999 | 58 (85.3%) | 10 (14.7%) |
| $100,000 and over | 0 (0.0%) | 0 (0.0%) |
Public vs Private Health Insurance Coverage by Age in Crescent
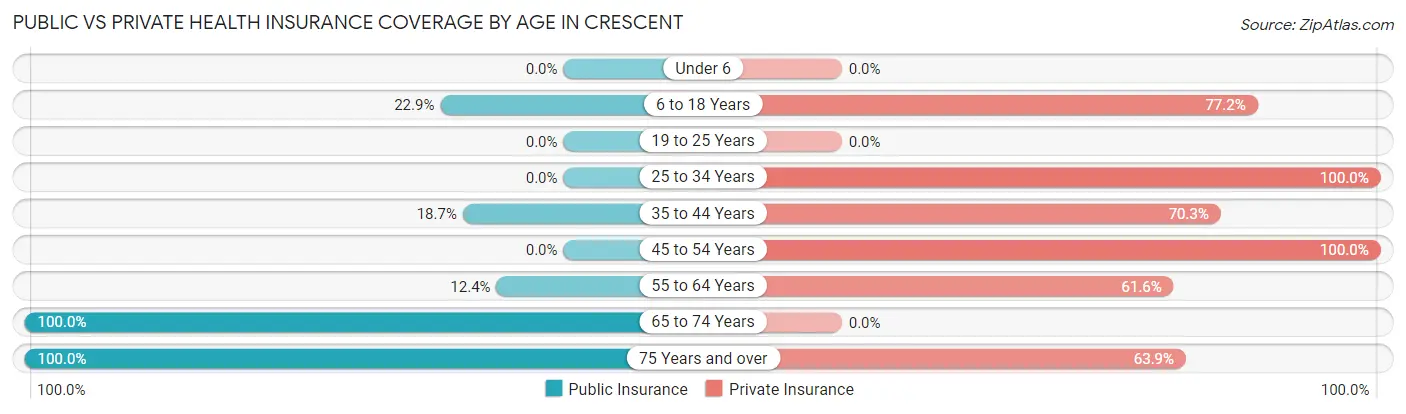
| Age Bracket | Public Insurance | Private Insurance |
| Under 6 | 0 (0.0%) | 0 (0.0%) |
| 6 to 18 Years | 77 (22.9%) | 260 (77.1%) |
| 19 to 25 Years | 0 (0.0%) | 0 (0.0%) |
| 25 to 34 Years | 0 (0.0%) | 97 (100.0%) |
| 35 to 44 Years | 17 (18.7%) | 64 (70.3%) |
| 45 to 54 Years | 0 (0.0%) | 86 (100.0%) |
| 55 to 64 Years | 22 (12.4%) | 109 (61.6%) |
| 65 to 74 Years | 75 (100.0%) | 0 (0.0%) |
| 75 Years and over | 83 (100.0%) | 53 (63.9%) |
| Total | 274 (29.0%) | 669 (70.7%) |
Disability Status by Sex by Age in Crescent
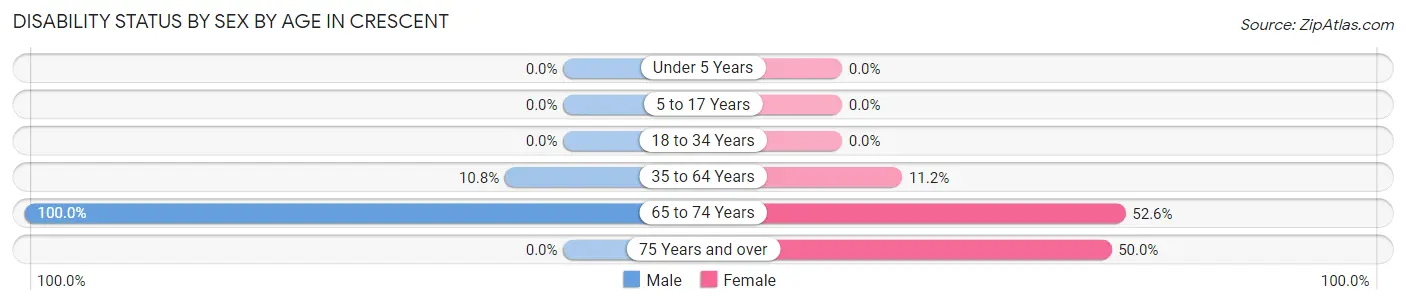
| Age Bracket | Male | Female |
| Under 5 Years | 0 (0.0%) | 0 (0.0%) |
| 5 to 17 Years | 0 (0.0%) | 0 (0.0%) |
| 18 to 34 Years | 0 (0.0%) | 0 (0.0%) |
| 35 to 64 Years | 17 (10.8%) | 22 (11.2%) |
| 65 to 74 Years | 18 (100.0%) | 30 (52.6%) |
| 75 Years and over | 0 (0.0%) | 30 (50.0%) |
Disability Class by Sex by Age in Crescent
Disability Class: Hearing Difficulty
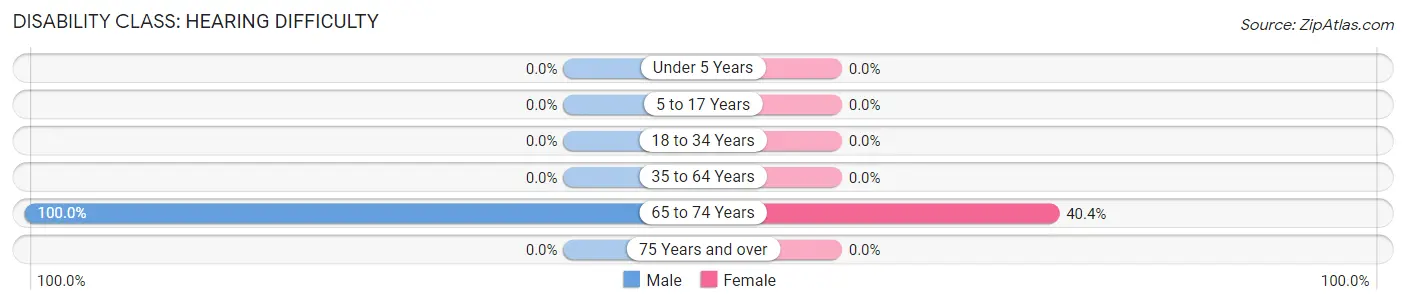
| Age Bracket | Male | Female |
| Under 5 Years | 0 (0.0%) | 0 (0.0%) |
| 5 to 17 Years | 0 (0.0%) | 0 (0.0%) |
| 18 to 34 Years | 0 (0.0%) | 0 (0.0%) |
| 35 to 64 Years | 0 (0.0%) | 0 (0.0%) |
| 65 to 74 Years | 18 (100.0%) | 23 (40.4%) |
| 75 Years and over | 0 (0.0%) | 0 (0.0%) |
Disability Class: Vision Difficulty
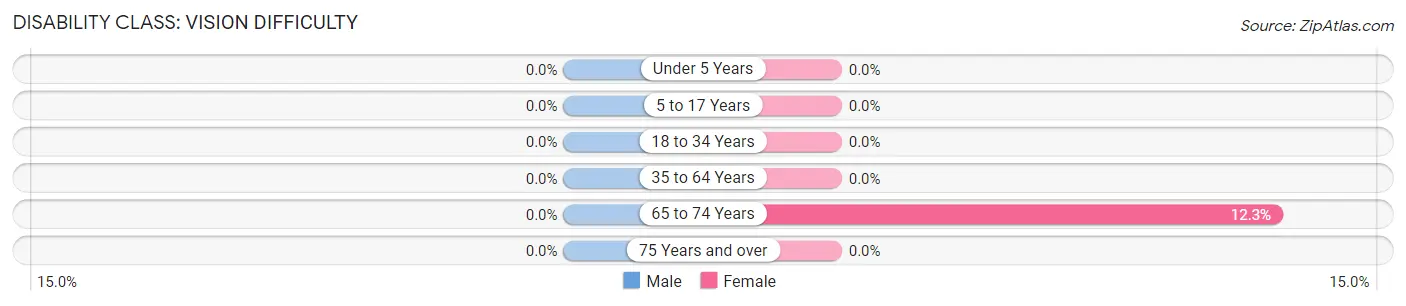
| Age Bracket | Male | Female |
| Under 5 Years | 0 (0.0%) | 0 (0.0%) |
| 5 to 17 Years | 0 (0.0%) | 0 (0.0%) |
| 18 to 34 Years | 0 (0.0%) | 0 (0.0%) |
| 35 to 64 Years | 0 (0.0%) | 0 (0.0%) |
| 65 to 74 Years | 0 (0.0%) | 7 (12.3%) |
| 75 Years and over | 0 (0.0%) | 0 (0.0%) |
Disability Class: Cognitive Difficulty
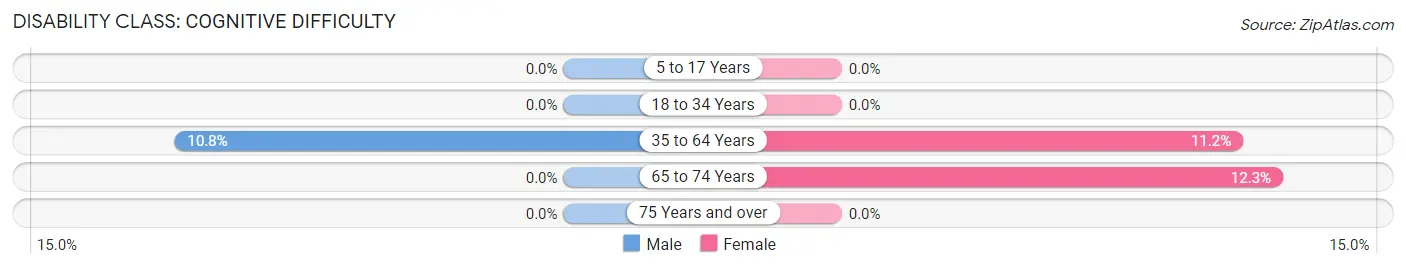
| Age Bracket | Male | Female |
| 5 to 17 Years | 0 (0.0%) | 0 (0.0%) |
| 18 to 34 Years | 0 (0.0%) | 0 (0.0%) |
| 35 to 64 Years | 17 (10.8%) | 22 (11.2%) |
| 65 to 74 Years | 0 (0.0%) | 7 (12.3%) |
| 75 Years and over | 0 (0.0%) | 0 (0.0%) |
Disability Class: Ambulatory Difficulty
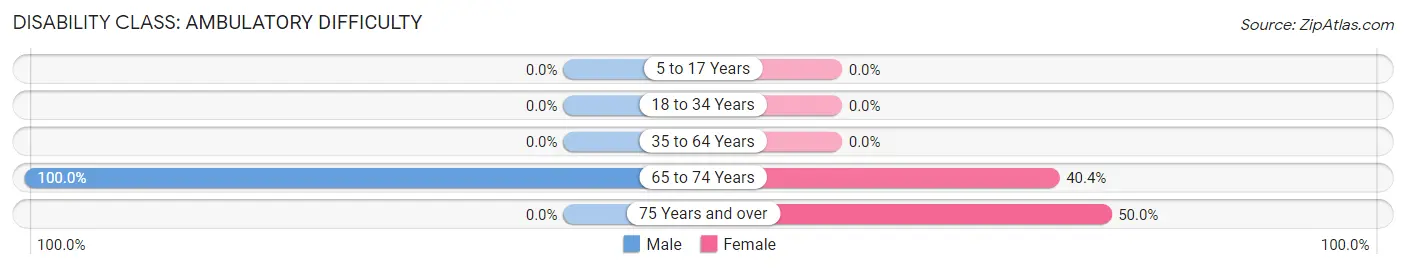
| Age Bracket | Male | Female |
| 5 to 17 Years | 0 (0.0%) | 0 (0.0%) |
| 18 to 34 Years | 0 (0.0%) | 0 (0.0%) |
| 35 to 64 Years | 0 (0.0%) | 0 (0.0%) |
| 65 to 74 Years | 18 (100.0%) | 23 (40.4%) |
| 75 Years and over | 0 (0.0%) | 30 (50.0%) |
Disability Class: Self-Care Difficulty
| Age Bracket | Male | Female |
| 5 to 17 Years | 0 (0.0%) | 0 (0.0%) |
| 18 to 34 Years | 0 (0.0%) | 0 (0.0%) |
| 35 to 64 Years | 0 (0.0%) | 0 (0.0%) |
| 65 to 74 Years | 0 (0.0%) | 0 (0.0%) |
| 75 Years and over | 0 (0.0%) | 0 (0.0%) |
Technology Access in Crescent
Computing Device Access in Crescent
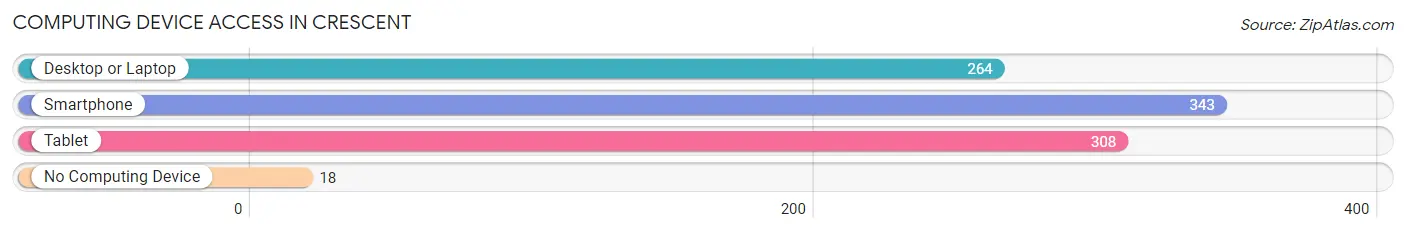
| Device Type | # Households | % Households |
| Desktop or Laptop | 264 | 69.8% |
| Smartphone | 343 | 90.7% |
| Tablet | 308 | 81.5% |
| No Computing Device | 18 | 4.8% |
| Total | 378 | 100.0% |
Internet Access in Crescent
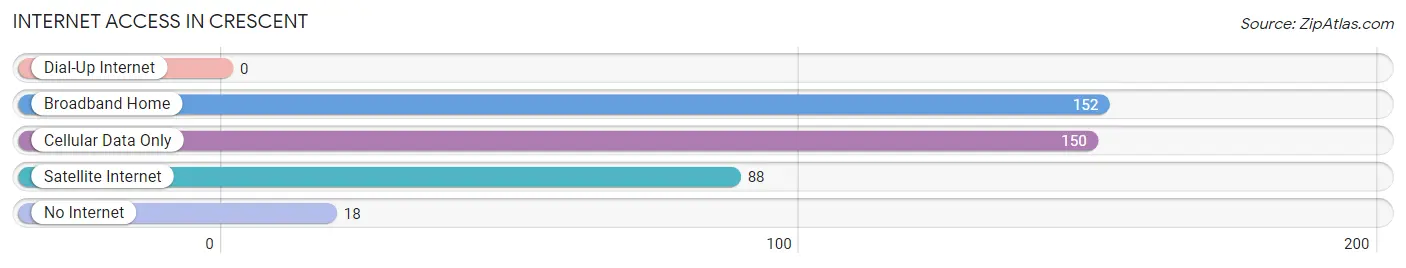
| Internet Type | # Households | % Households |
| Dial-Up Internet | 0 | 0.0% |
| Broadband Home | 152 | 40.2% |
| Cellular Data Only | 150 | 39.7% |
| Satellite Internet | 88 | 23.3% |
| No Internet | 18 | 4.8% |
| Total | 378 | 100.0% |
Crescent Summary
Crescent, Louisiana is a small town located in the southeastern corner of the state, in Iberia Parish. It is situated on the banks of the Bayou Teche, and is part of the Acadiana region of Louisiana. The town has a population of just over 1,000 people, and is known for its rich cultural heritage and its unique blend of French and Spanish influences.
Geography
Crescent is located in the southeastern corner of Louisiana, in Iberia Parish. It is situated on the banks of the Bayou Teche, and is part of the Acadiana region of Louisiana. The town is located about 30 miles south of Lafayette, and is bordered by the towns of Jeanerette, Loreauville, and New Iberia. The town is situated on a flat plain, and is surrounded by marshland and swamps. The climate in Crescent is humid subtropical, with hot, humid summers and mild winters.
Economy
Crescent’s economy is largely based on agriculture and fishing. The town is home to several large farms, and the surrounding area is known for its production of sugar cane, rice, and crawfish. Fishing is also an important part of the local economy, with many of the town’s residents relying on the Bayou Teche for their livelihood. In addition to agriculture and fishing, Crescent is also home to several small businesses, including restaurants, convenience stores, and gas stations.
Demographics
As of the 2010 census, Crescent had a population of 1,072 people. The racial makeup of the town was 79.3% White, 17.2% African American, 0.7% Native American, 0.3% Asian, 0.1% Pacific Islander, and 2.4% from two or more races. The median household income in Crescent was $30,938, and the median family income was $37,917. The per capita income in Crescent was $15,845.
Crescent is a small town with a rich cultural heritage and a unique blend of French and Spanish influences. The town’s economy is largely based on agriculture and fishing, and its residents are proud of their heritage and their way of life. Crescent is a great place to visit, and its unique culture and history make it a great place to live.
Common Questions
What is Per Capita Income in Crescent?
Per Capita income in Crescent is $18,236.
What is the Median Family Income in Crescent?
Median Family Income in Crescent is $41,289.
What is the Median Household income in Crescent?
Median Household Income in Crescent is $40,898.
What is Inequality or Gini Index in Crescent?
Inequality or Gini Index in Crescent is 0.22.
What is the Total Population of Crescent?
Total Population of Crescent is 946.
What is the Total Male Population of Crescent?
Total Male Population of Crescent is 333.
What is the Total Female Population of Crescent?
Total Female Population of Crescent is 613.
What is the Ratio of Males per 100 Females in Crescent?
There are 54.32 Males per 100 Females in Crescent.
What is the Ratio of Females per 100 Males in Crescent?
There are 184.08 Females per 100 Males in Crescent.
What is the Median Population Age in Crescent?
Median Population Age in Crescent is 43.2 Years.
What is the Average Family Size in Crescent
Average Family Size in Crescent is 2.7 People.
What is the Average Household Size in Crescent
Average Household Size in Crescent is 2.5 People.
How Large is the Labor Force in Crescent?
There are 333 People in the Labor Forcein in Crescent.
What is the Percentage of People in the Labor Force in Crescent?
50.7% of People are in the Labor Force in Crescent.
What is the Unemployment Rate in Crescent?
Unemployment Rate in Crescent is 5.1%.