Zip Codes with the Lowest Unemployment Rate Amomg Seniors Over the Age of 65 in Kansas
RELATED REPORTS & OPTIONS
Lowest Unemployment | Senior > 65
Kansas
Compare Zip Codes
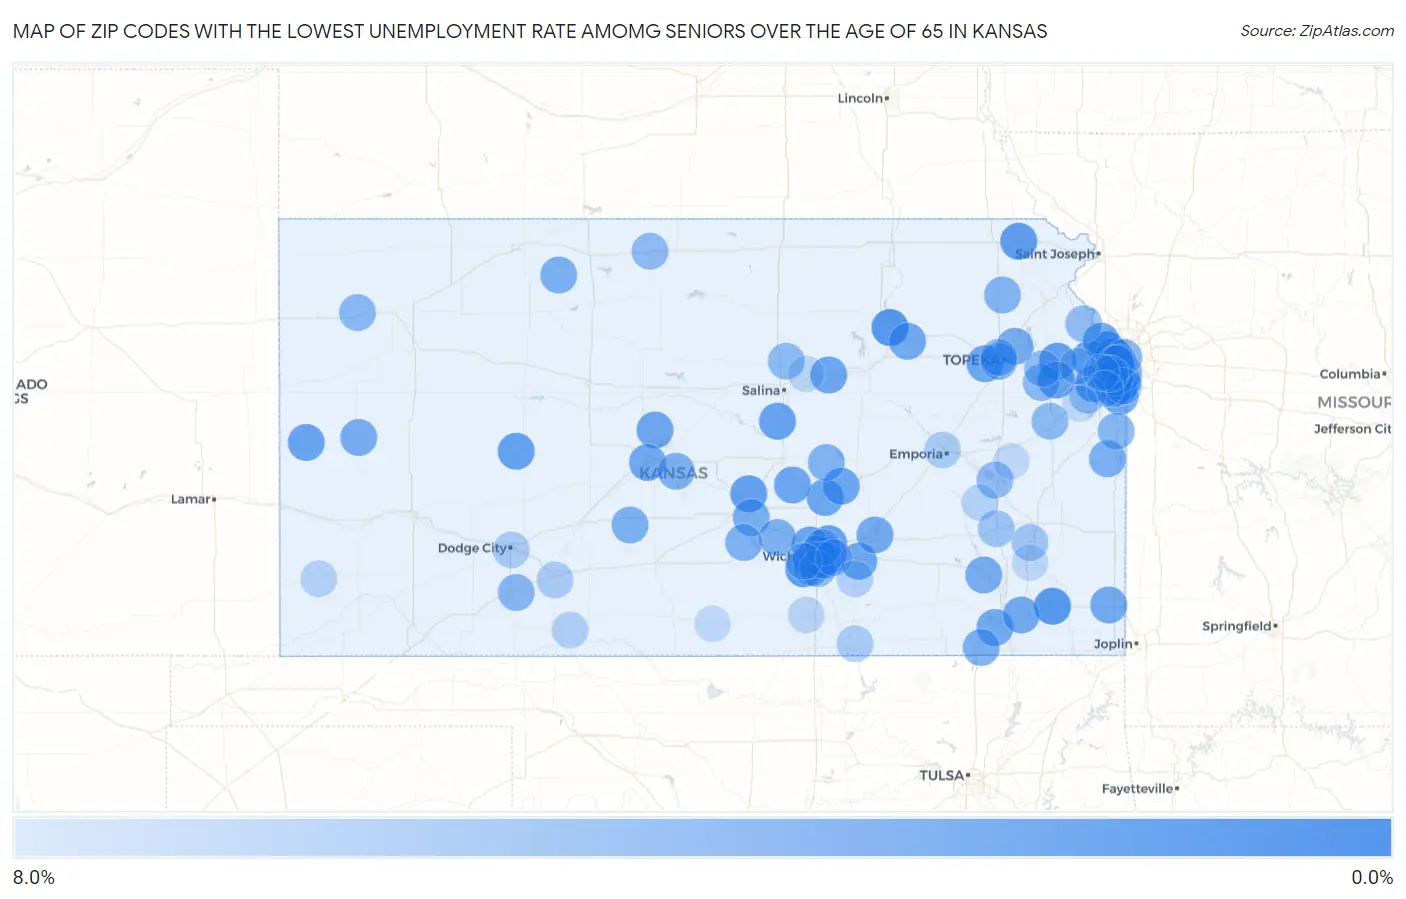
Map of Zip Codes with the Lowest Unemployment Rate Amomg Seniors Over the Age of 65 in Kansas
8.0%
0.0%
Zip Codes with the Lowest Unemployment Rate Amomg Seniors Over the Age of 65 in Kansas
| Zip Code | Senior Unemployment | vs State | vs National | |
| 1. | 66503 | 0.10% | 1.9%(-1.80)#1 | 3.9%(-3.80)#24 |
| 2. | 67357 | 0.10% | 1.9%(-1.80)#2 | 3.9%(-3.80)#28 |
| 3. | 66112 | 0.30% | 1.9%(-1.60)#3 | 3.9%(-3.60)#102 |
| 4. | 67215 | 0.40% | 1.9%(-1.50)#4 | 3.9%(-3.50)#187 |
| 5. | 66044 | 0.60% | 1.9%(-1.30)#5 | 3.9%(-3.30)#328 |
| 6. | 66209 | 0.60% | 1.9%(-1.30)#6 | 3.9%(-3.30)#349 |
| 7. | 66434 | 0.60% | 1.9%(-1.30)#7 | 3.9%(-3.30)#386 |
| 8. | 67502 | 0.80% | 1.9%(-1.10)#8 | 3.9%(-3.10)#555 |
| 9. | 66061 | 0.90% | 1.9%(-1.000)#9 | 3.9%(-3.00)#639 |
| 10. | 66213 | 1.0% | 1.9%(-0.900)#10 | 3.9%(-2.90)#806 |
| 11. | 67226 | 1.0% | 1.9%(-0.900)#11 | 3.9%(-2.90)#832 |
| 12. | 66046 | 1.0% | 1.9%(-0.900)#12 | 3.9%(-2.90)#842 |
| 13. | 67560 | 1.0% | 1.9%(-0.900)#13 | 3.9%(-2.90)#891 |
| 14. | 66012 | 1.1% | 1.9%(-0.800)#14 | 3.9%(-2.80)#980 |
| 15. | 67456 | 1.1% | 1.9%(-0.800)#15 | 3.9%(-2.80)#998 |
| 16. | 66106 | 1.2% | 1.9%(-0.700)#16 | 3.9%(-2.70)#1,082 |
| 17. | 67204 | 1.2% | 1.9%(-0.700)#17 | 3.9%(-2.70)#1,083 |
| 18. | 67879 | 1.2% | 1.9%(-0.700)#18 | 3.9%(-2.70)#1,153 |
| 19. | 66614 | 1.3% | 1.9%(-0.600)#19 | 3.9%(-2.60)#1,214 |
| 20. | 67114 | 1.3% | 1.9%(-0.600)#20 | 3.9%(-2.60)#1,244 |
| 21. | 67211 | 1.3% | 1.9%(-0.600)#21 | 3.9%(-2.60)#1,252 |
| 22. | 66866 | 1.3% | 1.9%(-0.600)#22 | 3.9%(-2.60)#1,316 |
| 23. | 66109 | 1.4% | 1.9%(-0.500)#23 | 3.9%(-2.50)#1,380 |
| 24. | 67410 | 1.4% | 1.9%(-0.500)#24 | 3.9%(-2.50)#1,444 |
| 25. | 67010 | 1.5% | 1.9%(-0.400)#25 | 3.9%(-2.40)#1,592 |
| 26. | 67544 | 1.5% | 1.9%(-0.400)#26 | 3.9%(-2.40)#1,637 |
| 27. | 67107 | 1.5% | 1.9%(-0.400)#27 | 3.9%(-2.40)#1,640 |
| 28. | 67530 | 1.6% | 1.9%(-0.300)#28 | 3.9%(-2.30)#1,747 |
| 29. | 66085 | 1.6% | 1.9%(-0.300)#29 | 3.9%(-2.30)#1,777 |
| 30. | 66502 | 1.7% | 1.9%(-0.200)#30 | 3.9%(-2.20)#1,852 |
| 31. | 66223 | 1.7% | 1.9%(-0.200)#31 | 3.9%(-2.20)#1,899 |
| 32. | 66762 | 1.7% | 1.9%(-0.200)#32 | 3.9%(-2.20)#1,900 |
| 33. | 66212 | 1.8% | 1.9%(-0.100)#33 | 3.9%(-2.10)#2,030 |
| 34. | 67301 | 1.8% | 1.9%(-0.100)#34 | 3.9%(-2.10)#2,110 |
| 35. | 67335 | 1.8% | 1.9%(-0.100)#35 | 3.9%(-2.10)#2,152 |
| 36. | 67206 | 1.9% | 1.9%(=0.000)#36 | 3.9%(-2.00)#2,257 |
| 37. | 67042 | 1.9% | 1.9%(=0.000)#37 | 3.9%(-2.00)#2,258 |
| 38. | 66617 | 2.0% | 1.9%(+0.100)#38 | 3.9%(-1.90)#2,472 |
| 39. | 66736 | 2.0% | 1.9%(+0.100)#39 | 3.9%(-1.90)#2,502 |
| 40. | 67861 | 2.0% | 1.9%(+0.100)#40 | 3.9%(-1.90)#2,515 |
| 41. | 67501 | 2.2% | 1.9%(+0.300)#41 | 3.9%(-1.70)#2,770 |
| 42. | 66040 | 2.2% | 1.9%(+0.300)#42 | 3.9%(-1.70)#2,863 |
| 43. | 67333 | 2.2% | 1.9%(+0.300)#43 | 3.9%(-1.70)#2,873 |
| 44. | 67646 | 2.2% | 1.9%(+0.300)#44 | 3.9%(-1.70)#2,883 |
| 45. | 67108 | 2.4% | 1.9%(+0.500)#45 | 3.9%(-1.50)#3,211 |
| 46. | 67557 | 2.4% | 1.9%(+0.500)#46 | 3.9%(-1.50)#3,221 |
| 47. | 67526 | 2.5% | 1.9%(+0.600)#47 | 3.9%(-1.40)#3,397 |
| 48. | 67570 | 2.5% | 1.9%(+0.600)#48 | 3.9%(-1.40)#3,409 |
| 49. | 67214 | 2.7% | 1.9%(+0.800)#49 | 3.9%(-1.20)#3,680 |
| 50. | 66206 | 2.7% | 1.9%(+0.800)#50 | 3.9%(-1.20)#3,695 |
| 51. | 66436 | 2.7% | 1.9%(+0.800)#51 | 3.9%(-1.20)#3,725 |
| 52. | 67063 | 2.7% | 1.9%(+0.800)#52 | 3.9%(-1.20)#3,736 |
| 53. | 67217 | 2.8% | 1.9%(+0.900)#53 | 3.9%(-1.10)#3,817 |
| 54. | 66604 | 2.8% | 1.9%(+0.900)#54 | 3.9%(-1.10)#3,850 |
| 55. | 67213 | 2.8% | 1.9%(+0.900)#55 | 3.9%(-1.10)#3,855 |
| 56. | 67207 | 2.9% | 1.9%(+1.000)#56 | 3.9%(-1.00)#4,009 |
| 57. | 66103 | 2.9% | 1.9%(+1.000)#57 | 3.9%(-1.00)#4,056 |
| 58. | 66202 | 3.0% | 1.9%(+1.10)#58 | 3.9%(-0.900)#4,196 |
| 59. | 66053 | 3.0% | 1.9%(+1.10)#59 | 3.9%(-0.900)#4,234 |
| 60. | 67865 | 3.0% | 1.9%(+1.10)#60 | 3.9%(-0.900)#4,280 |
| 61. | 66221 | 3.1% | 1.9%(+1.20)#61 | 3.9%(-0.800)#4,343 |
| 62. | 66047 | 3.1% | 1.9%(+1.20)#62 | 3.9%(-0.800)#4,357 |
| 63. | 67732 | 3.1% | 1.9%(+1.20)#63 | 3.9%(-0.800)#4,432 |
| 64. | 66067 | 3.2% | 1.9%(+1.30)#64 | 3.9%(-0.700)#4,515 |
| 65. | 67218 | 3.3% | 1.9%(+1.40)#65 | 3.9%(-0.600)#4,669 |
| 66. | 66210 | 3.3% | 1.9%(+1.40)#66 | 3.9%(-0.600)#4,679 |
| 67. | 66606 | 3.3% | 1.9%(+1.40)#67 | 3.9%(-0.600)#4,712 |
| 68. | 67422 | 3.3% | 1.9%(+1.40)#68 | 3.9%(-0.600)#4,752 |
| 69. | 66219 | 3.4% | 1.9%(+1.50)#69 | 3.9%(-0.500)#4,829 |
| 70. | 66967 | 3.4% | 1.9%(+1.50)#70 | 3.9%(-0.500)#4,876 |
| 71. | 66839 | 3.5% | 1.9%(+1.60)#71 | 3.9%(-0.400)#5,016 |
| 72. | 66048 | 3.6% | 1.9%(+1.70)#72 | 3.9%(-0.300)#5,082 |
| 73. | 66049 | 3.8% | 1.9%(+1.90)#73 | 3.9%(-0.100)#5,412 |
| 74. | 67216 | 3.9% | 1.9%(+2.00)#74 | 3.9%(=0.000)#5,573 |
| 75. | 67220 | 3.9% | 1.9%(+2.00)#75 | 3.9%(=0.000)#5,591 |
| 76. | 67209 | 4.0% | 1.9%(+2.10)#76 | 3.9%(+0.100)#5,728 |
| 77. | 66203 | 4.1% | 1.9%(+2.20)#77 | 3.9%(+0.200)#5,842 |
| 78. | 66030 | 4.2% | 1.9%(+2.30)#78 | 3.9%(+0.300)#5,954 |
| 79. | 66783 | 4.2% | 1.9%(+2.30)#79 | 3.9%(+0.300)#6,019 |
| 80. | 66748 | 4.4% | 1.9%(+2.50)#80 | 3.9%(+0.500)#6,270 |
| 81. | 67801 | 5.0% | 1.9%(+3.10)#81 | 3.9%(+1.10)#6,877 |
| 82. | 67230 | 5.0% | 1.9%(+3.10)#82 | 3.9%(+1.10)#6,918 |
| 83. | 67834 | 5.0% | 1.9%(+3.10)#83 | 3.9%(+1.10)#6,952 |
| 84. | 66801 | 5.1% | 1.9%(+3.20)#84 | 3.9%(+1.20)#6,996 |
| 85. | 67005 | 5.2% | 1.9%(+3.30)#85 | 3.9%(+1.30)#7,138 |
| 86. | 66224 | 5.2% | 1.9%(+3.30)#86 | 3.9%(+1.30)#7,144 |
| 87. | 66215 | 5.3% | 1.9%(+3.40)#87 | 3.9%(+1.40)#7,230 |
| 88. | 67127 | 5.4% | 1.9%(+3.50)#88 | 3.9%(+1.50)#7,400 |
| 89. | 67039 | 5.5% | 1.9%(+3.60)#89 | 3.9%(+1.60)#7,502 |
| 90. | 67855 | 5.5% | 1.9%(+3.60)#90 | 3.9%(+1.60)#7,505 |
| 91. | 66852 | 5.7% | 1.9%(+3.80)#91 | 3.9%(+1.80)#7,716 |
| 92. | 66052 | 5.8% | 1.9%(+3.90)#92 | 3.9%(+1.90)#7,804 |
| 93. | 67152 | 5.9% | 1.9%(+4.00)#93 | 3.9%(+2.00)#7,872 |
| 94. | 67480 | 6.1% | 1.9%(+4.20)#94 | 3.9%(+2.20)#8,063 |
| 95. | 66220 | 6.2% | 1.9%(+4.30)#95 | 3.9%(+2.30)#8,135 |
| 96. | 66720 | 6.3% | 1.9%(+4.40)#96 | 3.9%(+2.40)#8,215 |
| 97. | 66062 | 6.4% | 1.9%(+4.50)#97 | 3.9%(+2.50)#8,238 |
| 98. | 66021 | 6.4% | 1.9%(+4.50)#98 | 3.9%(+2.50)#8,318 |
| 99. | 66871 | 6.4% | 1.9%(+4.50)#99 | 3.9%(+2.50)#8,330 |
| 100. | 67009 | 6.4% | 1.9%(+4.50)#100 | 3.9%(+2.50)#8,333 |
Common Questions
What are the Top 10 Zip Codes with the Lowest Unemployment Rate Amomg Seniors Over the Age of 65 in Kansas?
Top 10 Zip Codes with the Lowest Unemployment Rate Amomg Seniors Over the Age of 65 in Kansas are:
What zip code has the Lowest Unemployment Rate Amomg Seniors Over the Age of 65 in Kansas?
66503 has the Lowest Unemployment Rate Amomg Seniors Over the Age of 65 in Kansas with 0.10%.
What is the Unemployment Rate Amomg Seniors Over the Age of 65 in the State of Kansas?
Unemployment Rate Amomg Seniors Over the Age of 65 in Kansas is 1.9%.
What is the Unemployment Rate Amomg Seniors Over the Age of 65 in the United States?
Unemployment Rate Amomg Seniors Over the Age of 65 in the United States is 3.9%.