Zip Codes with the Highest Percentage of Owner-Occupied Units in Wichita, KS

RELATED REPORTS & OPTIONS

Highest Owner-Occupied
Population
Families and Households
Female Fertility
Female Fertility (Unmarried)
Race (Community Size)
Race (Percentage)
Ancestry (Community Size)
AfricanAlaska NativeAmericanApacheArabArapahoArgentineanArmenianAustralianAustrianBangladeshiBarbadianBelgianBhutaneseBlackfeetBolivianBrazilianBritishBulgarianBurmeseCajunCanadianCelticCentral AmericanCentral American IndianCherokeeCheyenneChickasawChileanChippewaChoctawColombianComancheCosta RicanCreekCroatianCubanCzechCzechoslovakianDanishDelawareDominicanDutchDutch West IndianEastern EuropeanEcuadorianEgyptianEnglishEthiopianEuropeanFilipinoFinnishFrenchFrench American IndianFrench CanadianGermanGerman RussianGhanaianGreekGuamanian / ChamorroGuatemalanHaitianHonduranHungarianIcelanderIndian (Asian)IndonesianInupiatIranianIrishIroquoisItalianJamaicanJapaneseJordanianKenyanKiowaKoreanLaotianLebaneseLithuanianLuxembourgerMalaysianMexicanMexican American IndianMongolianMoroccanNative HawaiianNavajoNicaraguanNigerianNorthern EuropeanNorwegianOsageOttawaPakistaniPalestinianPanamanianParaguayanPennsylvania GermanPeruvianPimaPolishPortuguesePotawatomiPuebloPuerto RicanRomanianRussianSalvadoranSamoanScandinavianScotch-IrishScottishSeminoleSiouxSlavicSlovakSloveneSouth AfricanSouth AmericanSpaniardSpanishSpanish AmericanSpanish American IndianSri LankanSubsaharan AfricanSwedishSwissSyrianThaiTrinidadian and TobagonianTurkishUgandanUkrainianVenezuelanWelshWest IndianYugoslavian
Ancestry (Percentage)
AfricanAlaska NativeAmericanApacheArabArapahoArgentineanArmenianAustralianAustrianBangladeshiBarbadianBelgianBhutaneseBlackfeetBolivianBrazilianBritishBulgarianBurmeseCajunCanadianCelticCentral AmericanCentral American IndianCherokeeCheyenneChickasawChileanChippewaChoctawColombianComancheCosta RicanCreekCroatianCubanCzechCzechoslovakianDanishDelawareDominicanDutchDutch West IndianEastern EuropeanEcuadorianEgyptianEnglishEthiopianEuropeanFilipinoFinnishFrenchFrench American IndianFrench CanadianGermanGerman RussianGhanaianGreekGuamanian / ChamorroGuatemalanHaitianHonduranHungarianIcelanderIndian (Asian)IndonesianInupiatIranianIrishIroquoisItalianJamaicanJapaneseJordanianKenyanKiowaKoreanLaotianLebaneseLithuanianLuxembourgerMalaysianMexicanMexican American IndianMongolianMoroccanNative HawaiianNavajoNicaraguanNigerianNorthern EuropeanNorwegianOsageOttawaPakistaniPalestinianPanamanianParaguayanPennsylvania GermanPeruvianPimaPolishPortuguesePotawatomiPuebloPuerto RicanRomanianRussianSalvadoranSamoanScandinavianScotch-IrishScottishSeminoleSiouxSlavicSlovakSloveneSouth AfricanSouth AmericanSpaniardSpanishSpanish AmericanSpanish American IndianSri LankanSubsaharan AfricanSwedishSwissSyrianThaiTrinidadian and TobagonianTurkishUgandanUkrainianVenezuelanWelshWest IndianYugoslavian
Immigrant Origin (Total)
Immigrant Origin (Percentage)
Income
Income (Families)
Income (Households)
Poverty
Poverty (Families)
Unemployment
Employment Occupations
Employment Industries
Employer Class
Commute Time
Commute Means
School Enrollment
Education by Degree Field
Occupancy
Finances
Physical Characteristics
Wichita
Compare Zip Codes
Comparison Subject

Map of Zip Codes with the Highest Percentage of Owner-Occupied Units in Wichita

12.5%
100.0%
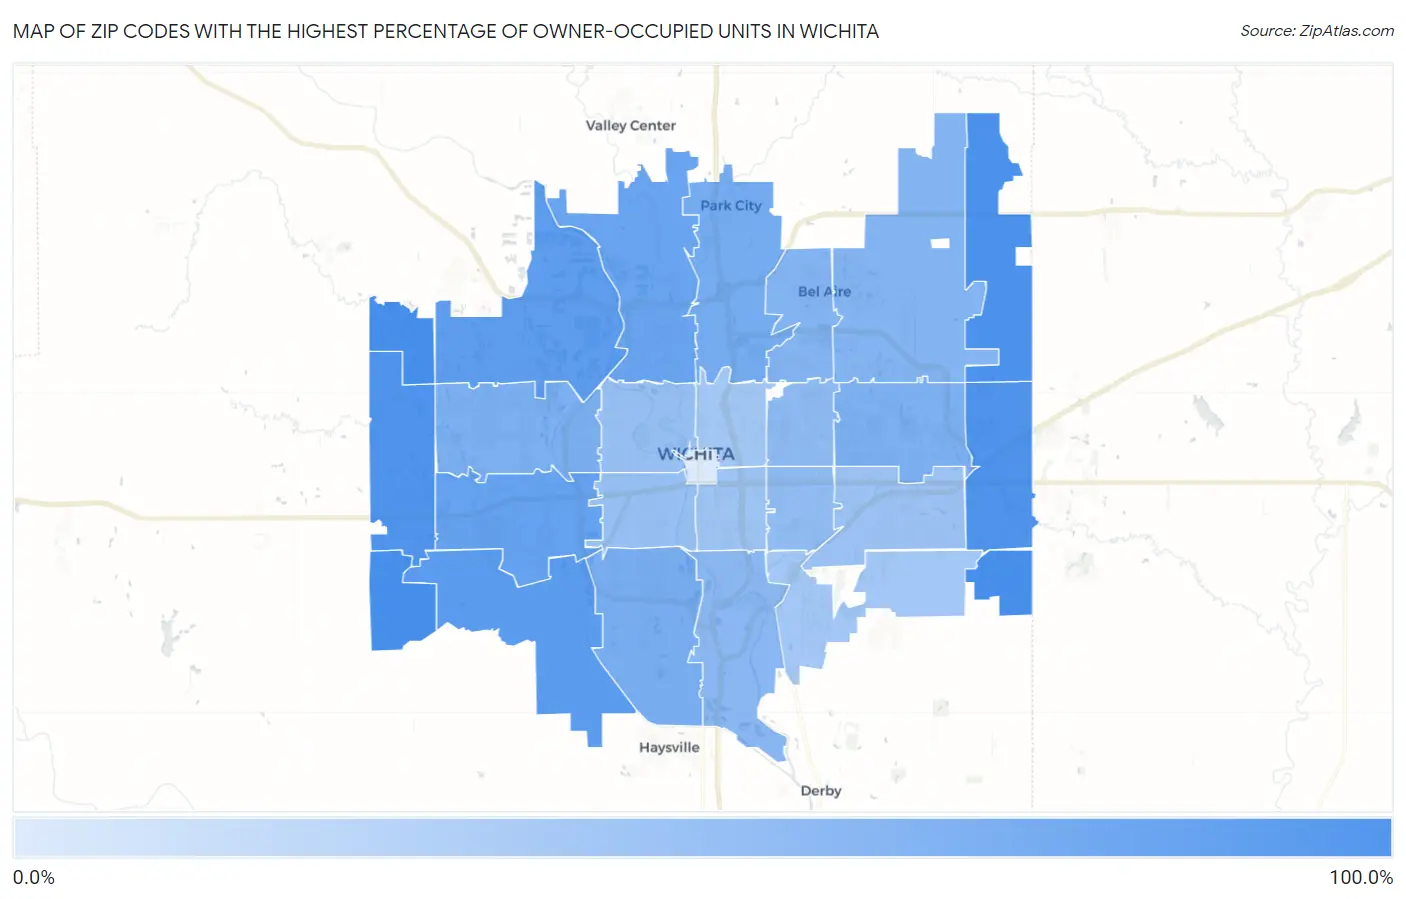
Zip Codes with the Highest Percentage of Owner-Occupied Units in Wichita Map

Zip Codes with the Highest Percentage of Owner-Occupied Units in Wichita, KS

Zip Code % Owner-Occupied vs State vs National
1. 67223 100.0% 66.9% (+33.1)#2 64.8% (+35.2)#92
2. 67232 100.0% 66.9% (+33.1)#3 64.8% (+35.2)#267
3. 67227 100.0% 66.9% (+33.1)#12 64.8% (+35.2)#574
4. 67228 96.6% 66.9% (+29.7)#46 64.8% (+31.8)#2,200
5. 67230 93.9% 66.9% (+27.0)#73 64.8% (+29.1)#3,199
6. 67235 93.9% 66.9% (+27.0)#74 64.8% (+29.1)#3,213
7. 67215 86.0% 66.9% (+19.1)#183 64.8% (+21.2)#8,757
8. 67205 83.0% 66.9% (+16.1)#260 64.8% (+18.2)#11,685
9. 67209 77.5% 66.9% (+10.7)#397 64.8% (+12.7)#16,912
10. 67204 75.0% 66.9% (+8.18)#453 64.8% (+10.2)#19,132
11. 67219 68.0% 66.9% (+1.12)#568 64.8% (+3.15)#23,989
12. 67217 65.5% 66.9% (-1.33)#594 64.8% (+0.703)#25,196
13. 67212 63.5% 66.9% (-3.40)#617 64.8% (-1.36)#26,127
14. 67206 62.7% 66.9% (-4.14)#623 64.8% (-2.11)#26,467
15. 67220 59.2% 66.9% (-7.68)#636 64.8% (-5.65)#27,652
16. 67226 58.6% 66.9% (-8.23)#639 64.8% (-6.19)#27,818
17. 67216 54.7% 66.9% (-12.2)#649 64.8% (-10.1)#28,833
18. 67208 52.4% 66.9% (-14.4)#656 64.8% (-12.4)#29,286
19. 67218 50.2% 66.9% (-16.6)#661 64.8% (-14.6)#29,682
20. 67213 47.1% 66.9% (-19.8)#665 64.8% (-17.7)#30,182
21. 67203 46.2% 66.9% (-20.6)#667 64.8% (-18.6)#30,316
22. 67207 44.5% 66.9% (-22.3)#671 64.8% (-20.3)#30,553
23. 67211 42.8% 66.9% (-24.0)#676 64.8% (-22.0)#30,736
24. 67210 39.9% 66.9% (-26.9)#681 64.8% (-24.9)#31,026
25. 67214 39.9% 66.9% (-27.0)#682 64.8% (-24.9)#31,030
26. 67202 12.5% 66.9% (-54.4)#689 64.8% (-52.3)#32,303

Common Questions

What are the Top 10 Zip Codes with the Highest Percentage of Owner-Occupied Units in Wichita, KS?
Top 10 Zip Codes with the Highest Percentage of Owner-Occupied Units in Wichita, KS are:
#1
100.0%
#2
100.0%
#3
100.0%
#4
96.6%
#5
93.9%
#6
93.9%
#7
86.0%
#8
83.0%
#9
77.5%
#10
75.0%
What zip code has the Highest Percentage of Owner-Occupied Units in Wichita, KS?
67223 has the Highest Percentage of Owner-Occupied Units in Wichita, KS with 100.0%.
What is the Percentage of Owner-Occupied Units in Wichita, KS?
Percentage of Owner-Occupied Units in Wichita is 58.5%.
What is the Percentage of Owner-Occupied Units in Kansas?
Percentage of Owner-Occupied Units in Kansas is 66.9%.
What is the Percentage of Owner-Occupied Units in the United States?
Percentage of Owner-Occupied Units in the United States is 64.8%.