Laguna Beach, FL Map & Demographics
Laguna Beach Map
Laguna Beach Overview
$62,041
PER CAPITA INCOME
$94,718
AVG FAMILY INCOME
$74,911
AVG HOUSEHOLD INCOME
24.3%
WAGE / INCOME GAP [ % ]
75.7¢/ $1
WAGE / INCOME GAP [ $ ]
$5,903
FAMILY INCOME DEFICIT
0.47
INEQUALITY / GINI INDEX
4,194
TOTAL POPULATION
2,147
MALE POPULATION
2,047
FEMALE POPULATION
104.89
MALES / 100 FEMALES
95.34
FEMALES / 100 MALES
57.6
MEDIAN AGE
2.2
AVG FAMILY SIZE
1.8
AVG HOUSEHOLD SIZE
2,194
LABOR FORCE [ PEOPLE ]
55.5%
PERCENT IN LABOR FORCE
0.1%
UNEMPLOYMENT RATE
Income in Laguna Beach
Income Overview in Laguna Beach
Per Capita Income in Laguna Beach is $62,041, while median incomes of families and households are $94,718 and $74,911 respectively.
| Characteristic | Number | Measure |
| Per Capita Income | 4,194 | $62,041 |
| Median Family Income | 1,313 | $94,718 |
| Mean Family Income | 1,313 | $151,392 |
| Median Household Income | 2,359 | $74,911 |
| Mean Household Income | 2,359 | $111,720 |
| Income Deficit | 1,313 | $5,903 |
| Wage / Income Gap (%) | 4,194 | 24.34% |
| Wage / Income Gap ($) | 4,194 | 75.66¢ per $1 |
| Gini / Inequality Index | 4,194 | 0.47 |
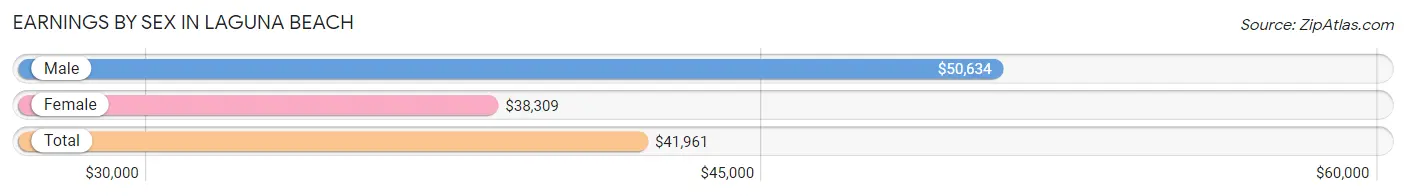
Earnings by Sex in Laguna Beach
Average Earnings in Laguna Beach are $41,961, $50,634 for men and $38,309 for women, a difference of 24.3%.
| Sex | Number | Average Earnings |
| Male | 1,321 (56.1%) | $50,634 |
| Female | 1,034 (43.9%) | $38,309 |
| Total | 2,355 (100.0%) | $41,961 |
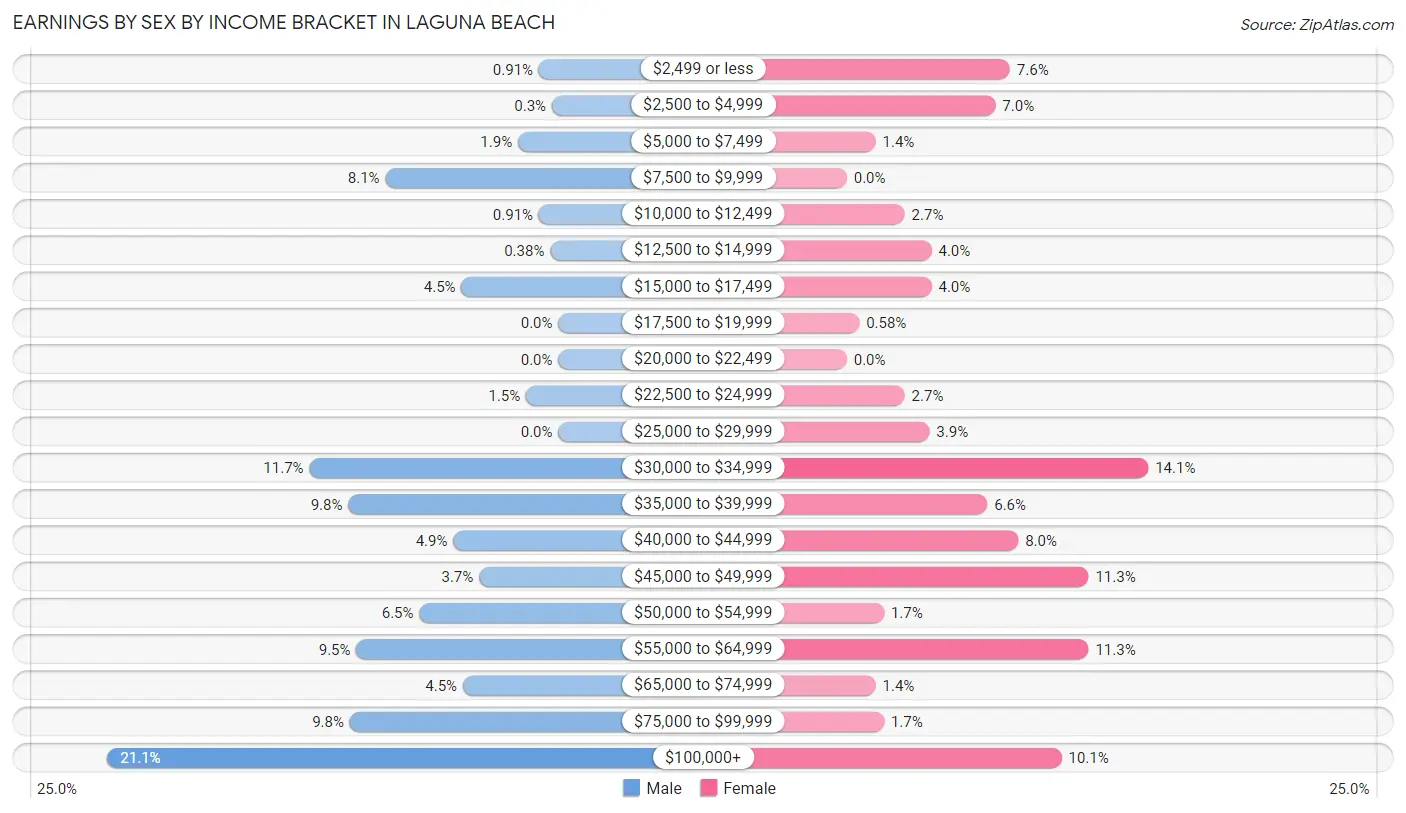
Earnings by Sex by Income Bracket in Laguna Beach
The most common earnings brackets in Laguna Beach are $100,000+ for men (279 | 21.1%) and $30,000 to $34,999 for women (146 | 14.1%).
| Income | Male | Female |
| $2,499 or less | 12 (0.9%) | 79 (7.6%) |
| $2,500 to $4,999 | 4 (0.3%) | 72 (7.0%) |
| $5,000 to $7,499 | 25 (1.9%) | 14 (1.3%) |
| $7,500 to $9,999 | 107 (8.1%) | 0 (0.0%) |
| $10,000 to $12,499 | 12 (0.9%) | 28 (2.7%) |
| $12,500 to $14,999 | 5 (0.4%) | 41 (4.0%) |
| $15,000 to $17,499 | 60 (4.5%) | 41 (4.0%) |
| $17,500 to $19,999 | 0 (0.0%) | 6 (0.6%) |
| $20,000 to $22,499 | 0 (0.0%) | 0 (0.0%) |
| $22,500 to $24,999 | 20 (1.5%) | 28 (2.7%) |
| $25,000 to $29,999 | 0 (0.0%) | 40 (3.9%) |
| $30,000 to $34,999 | 154 (11.7%) | 146 (14.1%) |
| $35,000 to $39,999 | 130 (9.8%) | 68 (6.6%) |
| $40,000 to $44,999 | 65 (4.9%) | 83 (8.0%) |
| $45,000 to $49,999 | 49 (3.7%) | 117 (11.3%) |
| $50,000 to $54,999 | 86 (6.5%) | 18 (1.7%) |
| $55,000 to $64,999 | 125 (9.5%) | 117 (11.3%) |
| $65,000 to $74,999 | 59 (4.5%) | 14 (1.3%) |
| $75,000 to $99,999 | 129 (9.8%) | 18 (1.7%) |
| $100,000+ | 279 (21.1%) | 104 (10.1%) |
| Total | 1,321 (100.0%) | 1,034 (100.0%) |
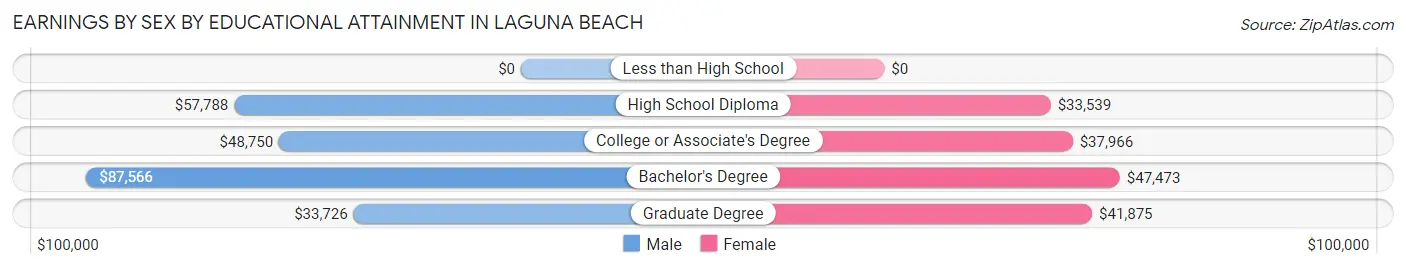
Earnings by Sex by Educational Attainment in Laguna Beach
Average earnings in Laguna Beach are $51,486 for men and $40,256 for women, a difference of 21.8%. Men with an educational attainment of bachelor's degree enjoy the highest average annual earnings of $87,566, while those with graduate degree education earn the least with $33,726. Women with an educational attainment of bachelor's degree earn the most with the average annual earnings of $47,473, while those with high school diploma education have the smallest earnings of $33,539.
| Educational Attainment | Male Income | Female Income |
| Less than High School | - | - |
| High School Diploma | $57,788 | $33,539 |
| College or Associate's Degree | $48,750 | $37,966 |
| Bachelor's Degree | $87,566 | $47,473 |
| Graduate Degree | $33,726 | $41,875 |
| Total | $51,486 | $40,256 |
Family Income in Laguna Beach
Family Income Brackets in Laguna Beach
According to the Laguna Beach family income data, there are 344 families falling into the $50,000 to $74,999 income range, which is the most common income bracket and makes up 26.2% of all families.
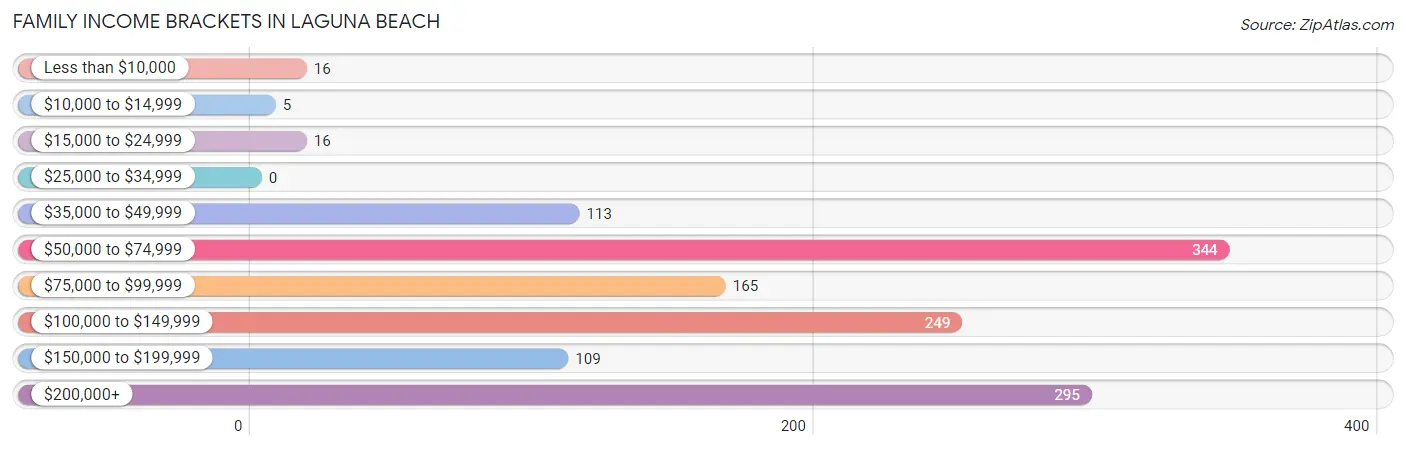
| Income Bracket | # Families | % Families |
| Less than $10,000 | 16 | 1.2% |
| $10,000 to $14,999 | 5 | 0.4% |
| $15,000 to $24,999 | 16 | 1.2% |
| $25,000 to $34,999 | 0 | 0.0% |
| $35,000 to $49,999 | 113 | 8.6% |
| $50,000 to $74,999 | 344 | 26.2% |
| $75,000 to $99,999 | 165 | 12.6% |
| $100,000 to $149,999 | 249 | 19.0% |
| $150,000 to $199,999 | 109 | 8.3% |
| $200,000+ | 295 | 22.5% |
Family Income by Famaliy Size in Laguna Beach
4-person families (111 | 8.5%) account for the highest median family income in Laguna Beach with $211,578 per family, while 2-person families (1,049 | 79.9%) have the highest median income of $54,188 per family member.
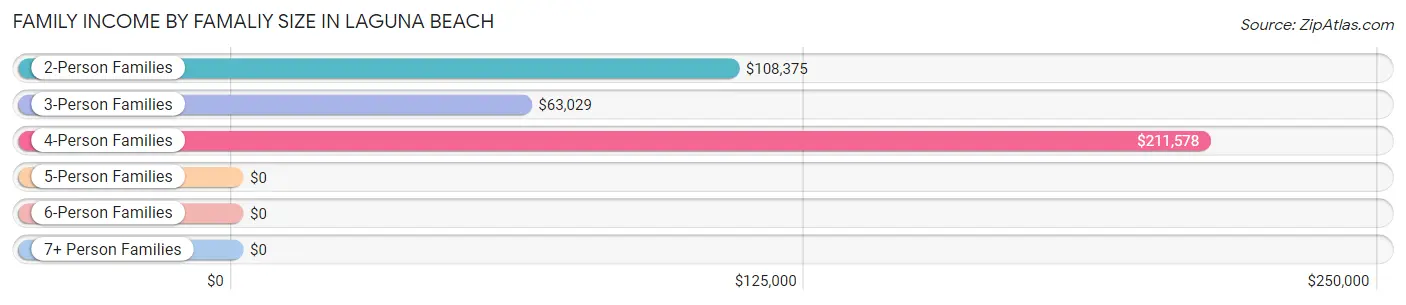
| Income Bracket | # Families | Median Income |
| 2-Person Families | 1,049 (79.9%) | $108,375 |
| 3-Person Families | 153 (11.7%) | $63,029 |
| 4-Person Families | 111 (8.5%) | $211,578 |
| 5-Person Families | 0 (0.0%) | $0 |
| 6-Person Families | 0 (0.0%) | $0 |
| 7+ Person Families | 0 (0.0%) | $0 |
| Total | 1,313 (100.0%) | $94,718 |
Family Income by Number of Earners in Laguna Beach
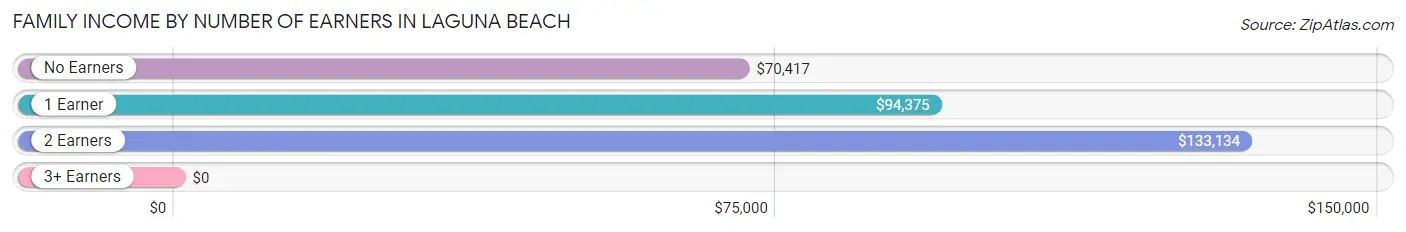
| Number of Earners | # Families | Median Income |
| No Earners | 368 (28.0%) | $70,417 |
| 1 Earner | 386 (29.4%) | $94,375 |
| 2 Earners | 496 (37.8%) | $133,134 |
| 3+ Earners | 63 (4.8%) | $0 |
| Total | 1,313 (100.0%) | $94,718 |
Household Income in Laguna Beach
Household Income Brackets in Laguna Beach
With 505 households falling in the category, the $50,000 to $74,999 income range is the most frequent in Laguna Beach, accounting for 21.4% of all households. In contrast, only 17 households (0.7%) fall into the $10,000 to $14,999 income bracket, making it the least populous group.
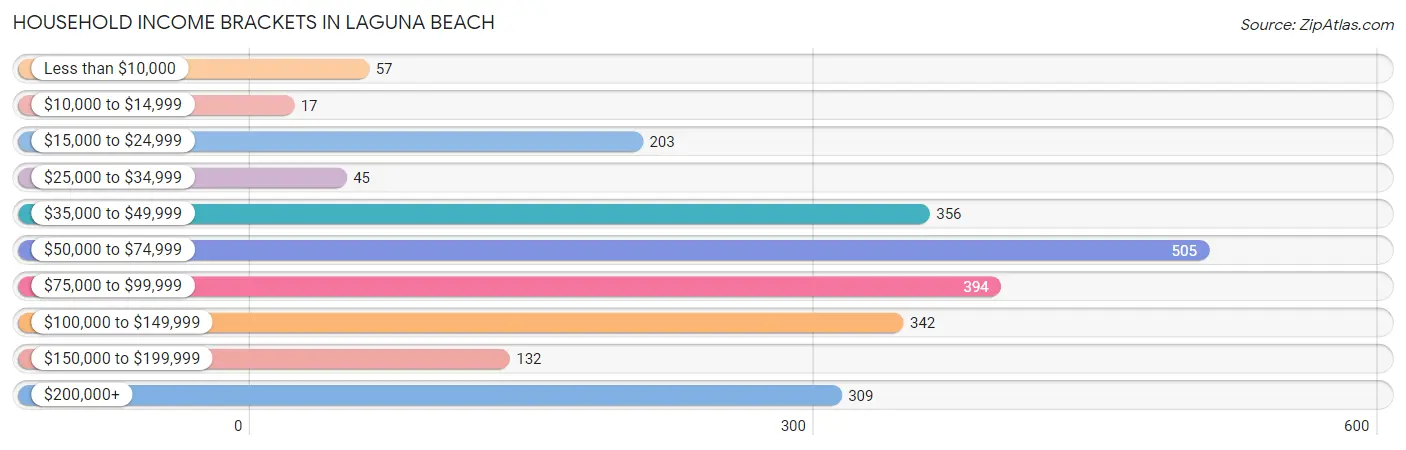
| Income Bracket | # Households | % Households |
| Less than $10,000 | 57 | 2.4% |
| $10,000 to $14,999 | 17 | 0.7% |
| $15,000 to $24,999 | 203 | 8.6% |
| $25,000 to $34,999 | 45 | 1.9% |
| $35,000 to $49,999 | 356 | 15.1% |
| $50,000 to $74,999 | 505 | 21.4% |
| $75,000 to $99,999 | 394 | 16.7% |
| $100,000 to $149,999 | 342 | 14.5% |
| $150,000 to $199,999 | 132 | 5.6% |
| $200,000+ | 309 | 13.1% |
Household Income by Householder Age in Laguna Beach
The median household income in Laguna Beach is $74,911, with the highest median household income of $88,719 found in the 25 to 44 years age bracket for the primary householder. A total of 558 households (23.6%) fall into this category.
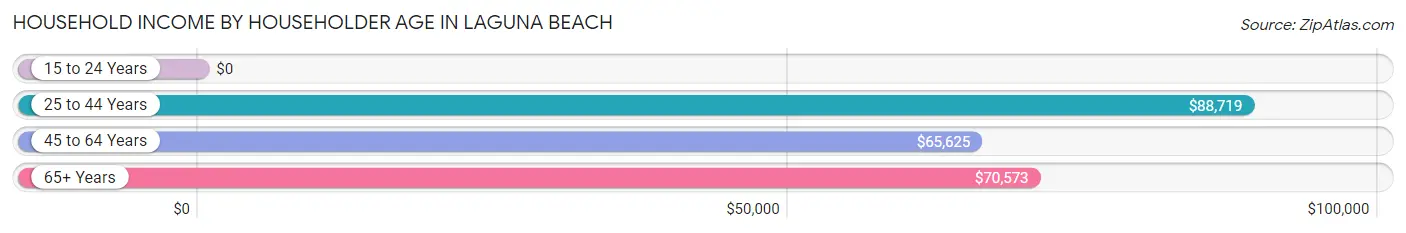
| Income Bracket | # Households | Median Income |
| 15 to 24 Years | 0 (0.0%) | $0 |
| 25 to 44 Years | 558 (23.6%) | $88,719 |
| 45 to 64 Years | 936 (39.7%) | $65,625 |
| 65+ Years | 865 (36.7%) | $70,573 |
| Total | 2,359 (100.0%) | $74,911 |
Poverty in Laguna Beach
Income Below Poverty by Sex and Age in Laguna Beach
With 2.4% poverty level for males and 4.4% for females among the residents of Laguna Beach, 45 to 54 year old males and 75 year old and over females are the most vulnerable to poverty, with 17 males (8.3%) and 21 females (9.3%) in their respective age groups living below the poverty level.
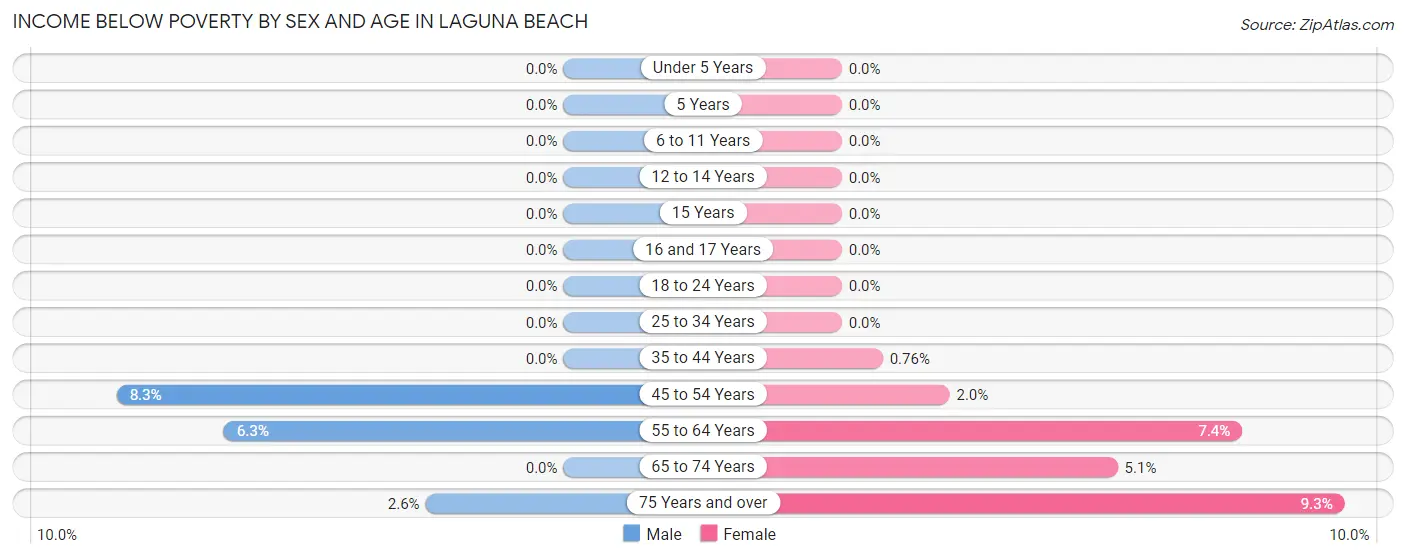
| Age Bracket | Male | Female |
| Under 5 Years | 0 (0.0%) | 0 (0.0%) |
| 5 Years | 0 (0.0%) | 0 (0.0%) |
| 6 to 11 Years | 0 (0.0%) | 0 (0.0%) |
| 12 to 14 Years | 0 (0.0%) | 0 (0.0%) |
| 15 Years | 0 (0.0%) | 0 (0.0%) |
| 16 and 17 Years | 0 (0.0%) | 0 (0.0%) |
| 18 to 24 Years | 0 (0.0%) | 0 (0.0%) |
| 25 to 34 Years | 0 (0.0%) | 0 (0.0%) |
| 35 to 44 Years | 0 (0.0%) | 2 (0.8%) |
| 45 to 54 Years | 17 (8.3%) | 7 (2.0%) |
| 55 to 64 Years | 29 (6.3%) | 40 (7.4%) |
| 65 to 74 Years | 0 (0.0%) | 20 (5.1%) |
| 75 Years and over | 5 (2.6%) | 21 (9.3%) |
| Total | 51 (2.4%) | 90 (4.4%) |
Income Above Poverty by Sex and Age in Laguna Beach
According to the poverty statistics in Laguna Beach, males aged under 5 years and females aged 6 to 11 years are the age groups that are most secure financially, with 100.0% of males and 100.0% of females in these age groups living above the poverty line.
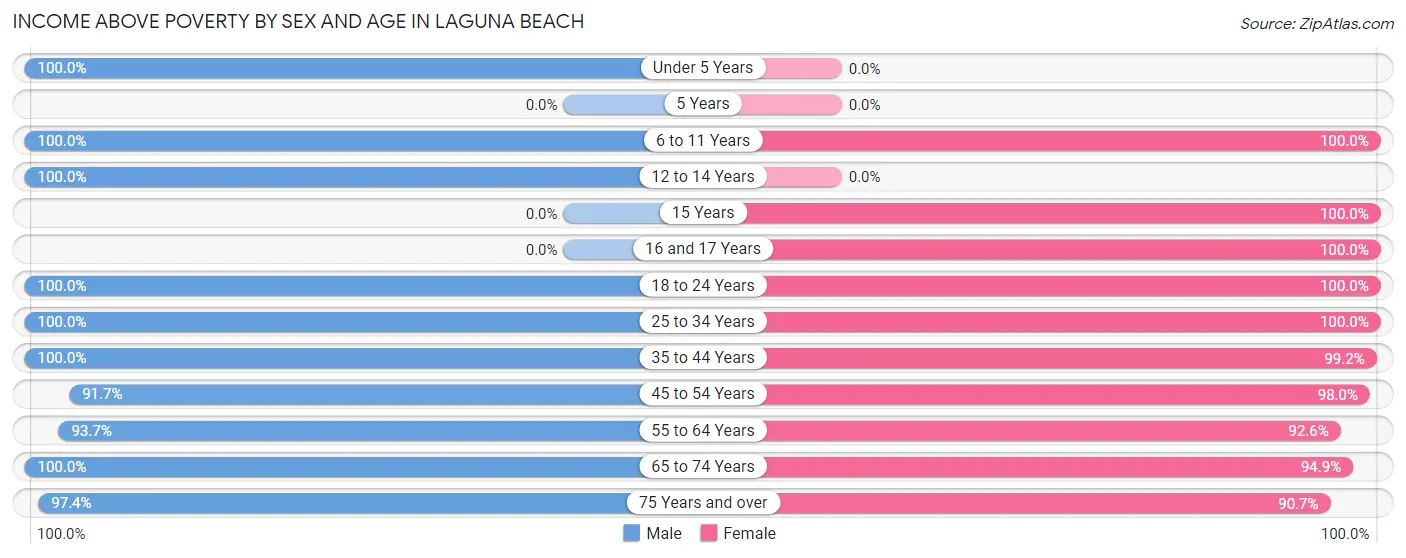
| Age Bracket | Male | Female |
| Under 5 Years | 19 (100.0%) | 0 (0.0%) |
| 5 Years | 0 (0.0%) | 0 (0.0%) |
| 6 to 11 Years | 47 (100.0%) | 135 (100.0%) |
| 12 to 14 Years | 24 (100.0%) | 0 (0.0%) |
| 15 Years | 0 (0.0%) | 15 (100.0%) |
| 16 and 17 Years | 0 (0.0%) | 60 (100.0%) |
| 18 to 24 Years | 73 (100.0%) | 41 (100.0%) |
| 25 to 34 Years | 374 (100.0%) | 29 (100.0%) |
| 35 to 44 Years | 294 (100.0%) | 261 (99.2%) |
| 45 to 54 Years | 188 (91.7%) | 343 (98.0%) |
| 55 to 64 Years | 431 (93.7%) | 498 (92.6%) |
| 65 to 74 Years | 456 (100.0%) | 371 (94.9%) |
| 75 Years and over | 190 (97.4%) | 204 (90.7%) |
| Total | 2,096 (97.6%) | 1,957 (95.6%) |
Income Below Poverty Among Married-Couple Families in Laguna Beach
The poverty statistics for married-couple families in Laguna Beach show that 3.2% or 32 of the total 1,013 families live below the poverty line. Families with no children have the highest poverty rate of 3.9%, comprising of 32 families. On the other hand, families with 1 or 2 children have the lowest poverty rate of 0.0%, which includes 0 families.
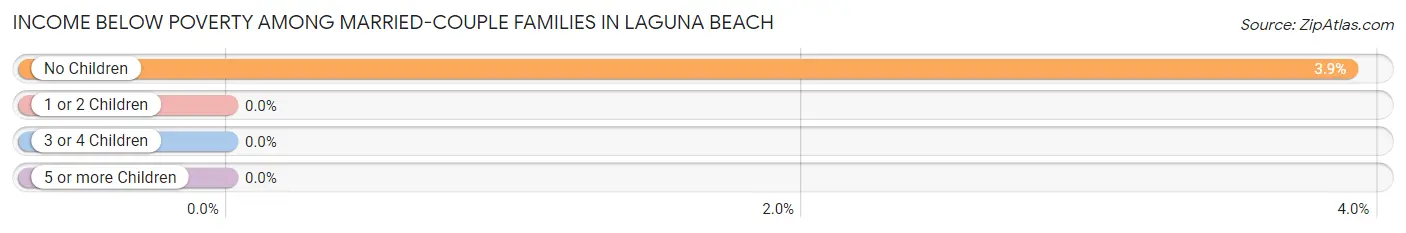
| Children | Above Poverty | Below Poverty |
| No Children | 788 (96.1%) | 32 (3.9%) |
| 1 or 2 Children | 193 (100.0%) | 0 (0.0%) |
| 3 or 4 Children | 0 (0.0%) | 0 (0.0%) |
| 5 or more Children | 0 (0.0%) | 0 (0.0%) |
| Total | 981 (96.8%) | 32 (3.2%) |
Income Below Poverty Among Single-Parent Households in Laguna Beach
| Children | Single Father | Single Mother |
| No Children | 0 (0.0%) | 0 (0.0%) |
| 1 or 2 Children | 0 (0.0%) | 0 (0.0%) |
| 3 or 4 Children | 0 (0.0%) | 0 (0.0%) |
| 5 or more Children | 0 (0.0%) | 0 (0.0%) |
| Total | 0 (0.0%) | 0 (0.0%) |
Income Below Poverty Among Married-Couple vs Single-Parent Households in Laguna Beach
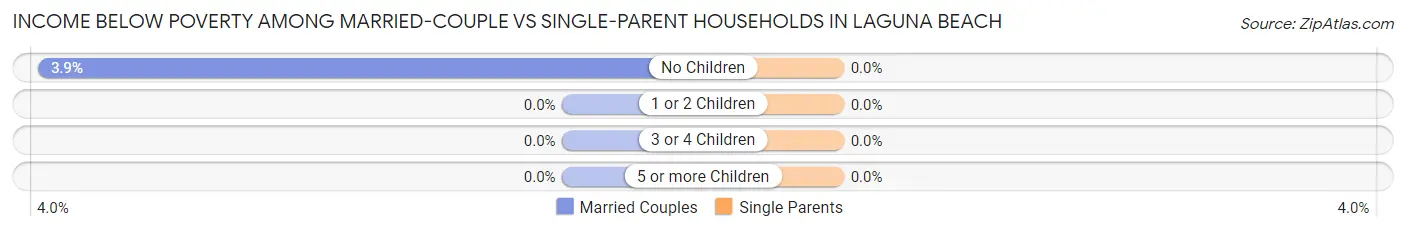
| Children | Married-Couple Families | Single-Parent Households |
| No Children | 32 (3.9%) | 0 (0.0%) |
| 1 or 2 Children | 0 (0.0%) | 0 (0.0%) |
| 3 or 4 Children | 0 (0.0%) | 0 (0.0%) |
| 5 or more Children | 0 (0.0%) | 0 (0.0%) |
| Total | 32 (3.2%) | 0 (0.0%) |
Race in Laguna Beach
The most populous races in Laguna Beach are White / Caucasian (3,950 | 94.2%), Hispanic or Latino (225 | 5.4%), and Some other Race (172 | 4.1%).
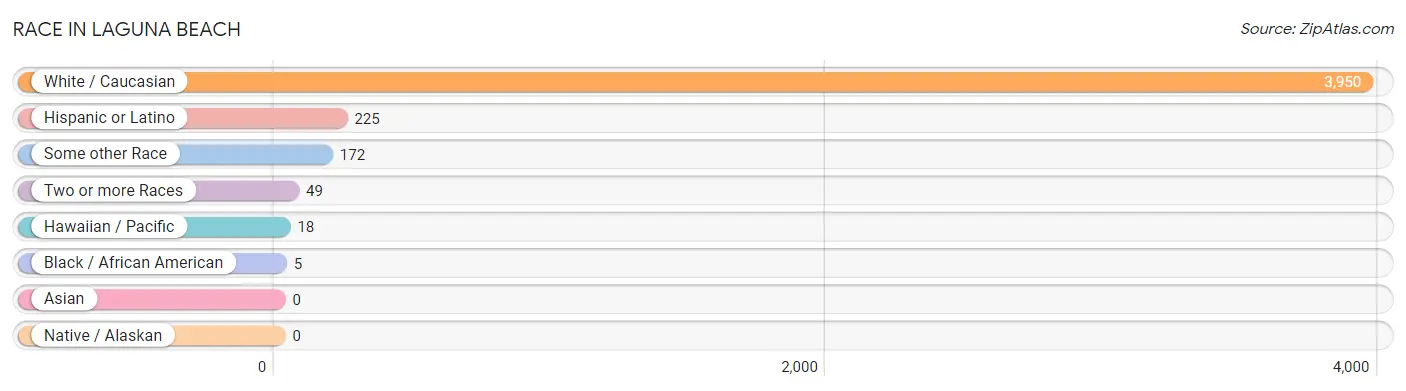
| Race | # Population | % Population |
| Asian | 0 | 0.0% |
| Black / African American | 5 | 0.1% |
| Hawaiian / Pacific | 18 | 0.4% |
| Hispanic or Latino | 225 | 5.4% |
| Native / Alaskan | 0 | 0.0% |
| White / Caucasian | 3,950 | 94.2% |
| Two or more Races | 49 | 1.2% |
| Some other Race | 172 | 4.1% |
| Total | 4,194 | 100.0% |
Ancestry in Laguna Beach
The most populous ancestries reported in Laguna Beach are Irish (634 | 15.1%), English (627 | 14.9%), American (465 | 11.1%), European (413 | 9.9%), and German (220 | 5.2%), together accounting for 56.3% of all Laguna Beach residents.
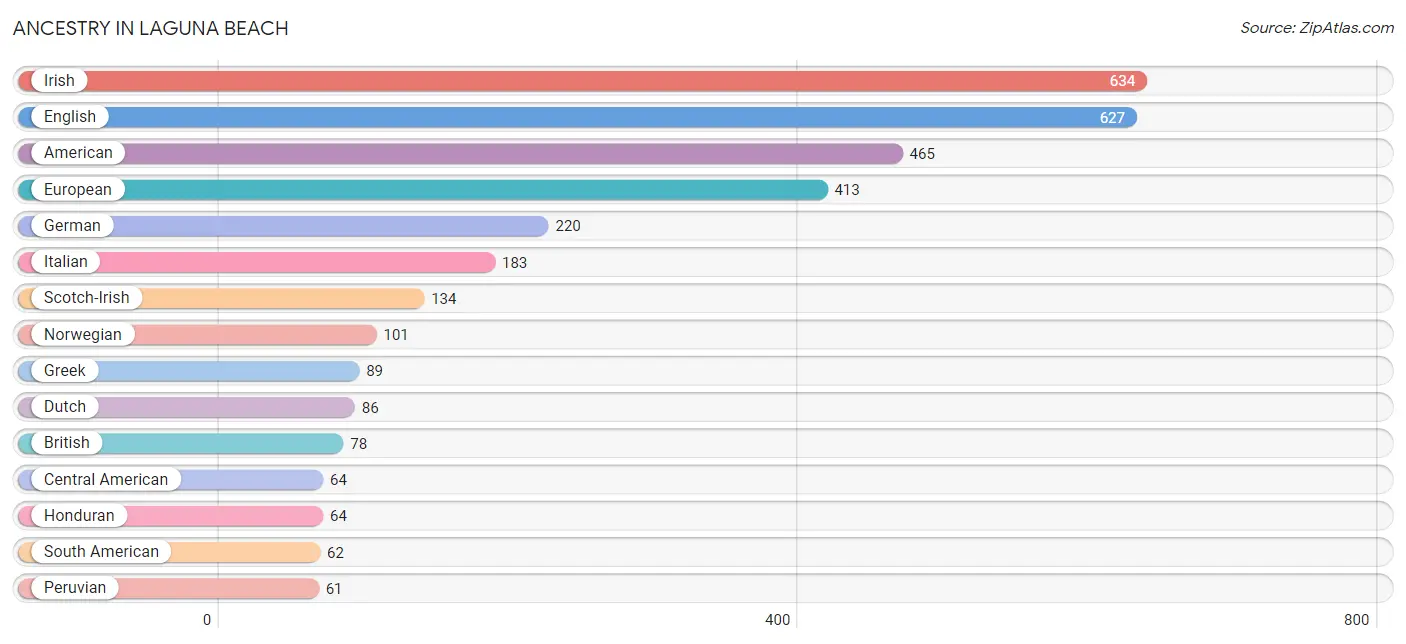
| Ancestry | # Population | % Population |
| American | 465 | 11.1% |
| Arab | 49 | 1.2% |
| British | 78 | 1.9% |
| Canadian | 22 | 0.5% |
| Central American | 64 | 1.5% |
| Cherokee | 6 | 0.1% |
| Colombian | 1 | 0.0% |
| Danish | 29 | 0.7% |
| Dutch | 86 | 2.1% |
| English | 627 | 14.9% |
| European | 413 | 9.9% |
| French | 16 | 0.4% |
| French Canadian | 57 | 1.4% |
| German | 220 | 5.2% |
| Greek | 89 | 2.1% |
| Honduran | 64 | 1.5% |
| Irish | 634 | 15.1% |
| Italian | 183 | 4.4% |
| Lebanese | 37 | 0.9% |
| Mexican | 57 | 1.4% |
| Native Hawaiian | 33 | 0.8% |
| Norwegian | 101 | 2.4% |
| Peruvian | 61 | 1.5% |
| Polish | 40 | 0.9% |
| Portuguese | 50 | 1.2% |
| Puerto Rican | 42 | 1.0% |
| Russian | 11 | 0.3% |
| Scandinavian | 18 | 0.4% |
| Scotch-Irish | 134 | 3.2% |
| Scottish | 59 | 1.4% |
| Serbian | 9 | 0.2% |
| South American | 62 | 1.5% |
| Swedish | 40 | 0.9% |
| Swiss | 29 | 0.7% |
| Syrian | 12 | 0.3% |
| Welsh | 16 | 0.4% | View All 36 Rows |
Immigrants in Laguna Beach
The most numerous immigrant groups reported in Laguna Beach came from Latin America (80 | 1.9%), Central America (57 | 1.4%), Mexico (57 | 1.4%), South America (23 | 0.5%), and Peru (22 | 0.5%), together accounting for 5.7% of all Laguna Beach residents.
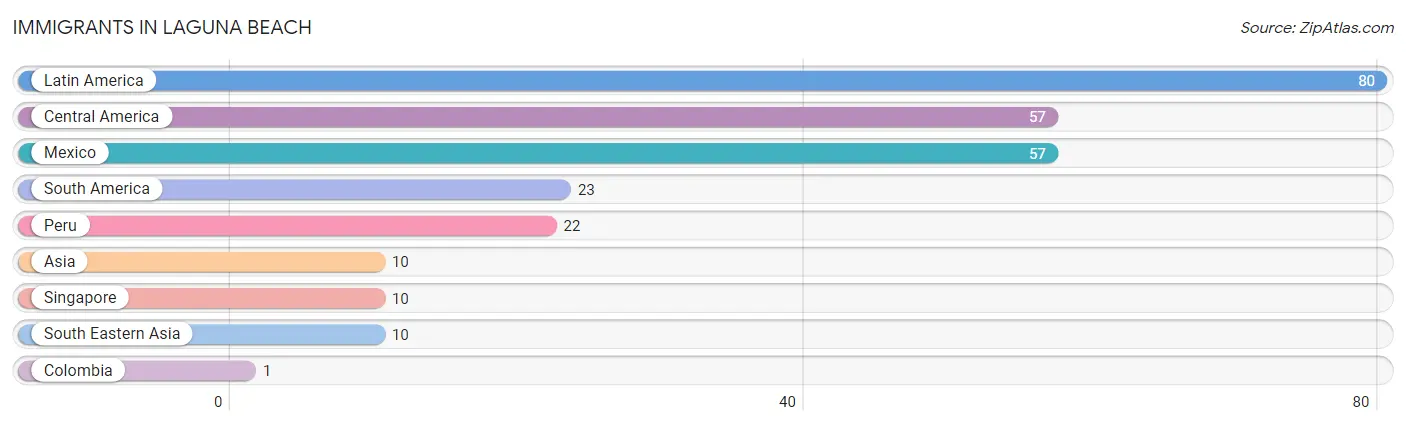
| Immigration Origin | # Population | % Population |
| Asia | 10 | 0.2% |
| Central America | 57 | 1.4% |
| Colombia | 1 | 0.0% |
| Latin America | 80 | 1.9% |
| Mexico | 57 | 1.4% |
| Peru | 22 | 0.5% |
| Singapore | 10 | 0.2% |
| South America | 23 | 0.5% |
| South Eastern Asia | 10 | 0.2% | View All 9 Rows |
Sex and Age in Laguna Beach
Sex and Age in Laguna Beach
The most populous age groups in Laguna Beach are 60 to 64 Years (334 | 15.6%) for men and 60 to 64 Years (316 | 15.4%) for women.
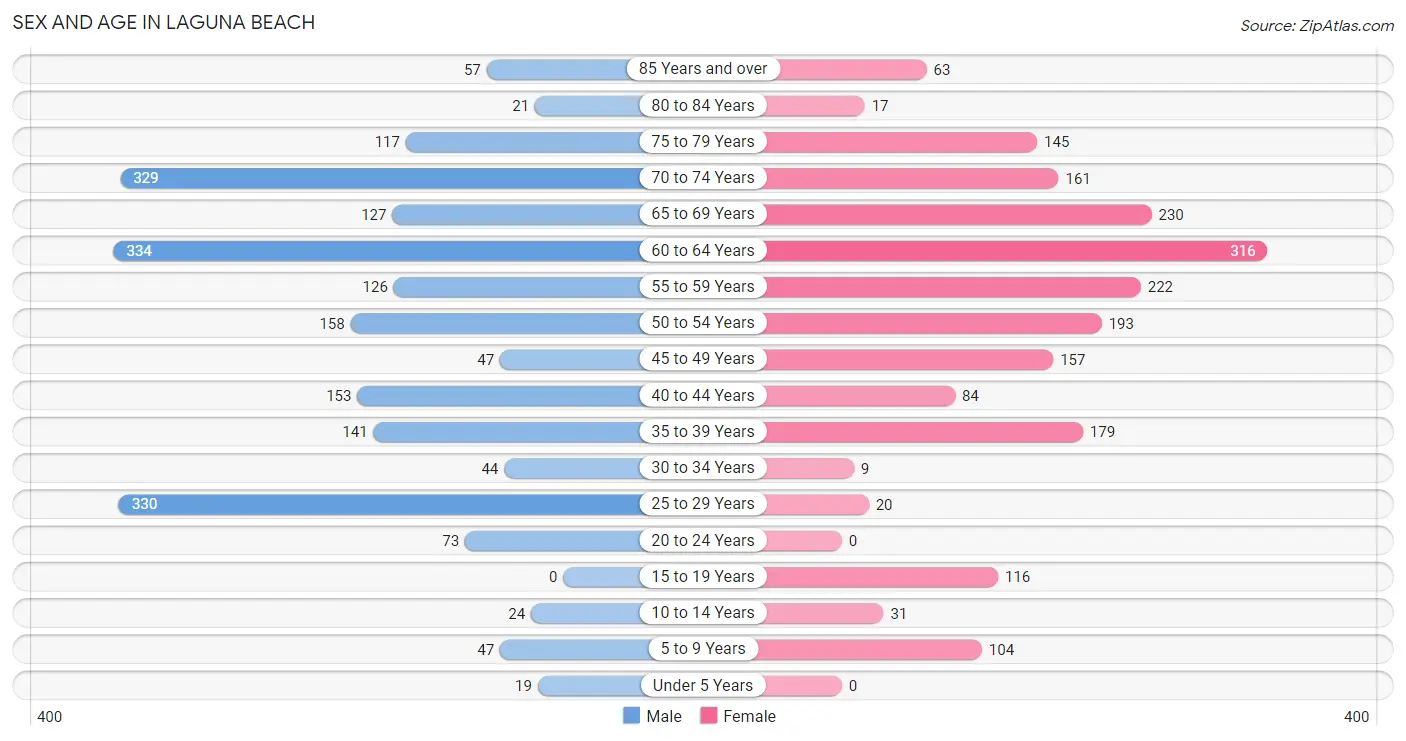
| Age Bracket | Male | Female |
| Under 5 Years | 19 (0.9%) | 0 (0.0%) |
| 5 to 9 Years | 47 (2.2%) | 104 (5.1%) |
| 10 to 14 Years | 24 (1.1%) | 31 (1.5%) |
| 15 to 19 Years | 0 (0.0%) | 116 (5.7%) |
| 20 to 24 Years | 73 (3.4%) | 0 (0.0%) |
| 25 to 29 Years | 330 (15.4%) | 20 (1.0%) |
| 30 to 34 Years | 44 (2.1%) | 9 (0.4%) |
| 35 to 39 Years | 141 (6.6%) | 179 (8.7%) |
| 40 to 44 Years | 153 (7.1%) | 84 (4.1%) |
| 45 to 49 Years | 47 (2.2%) | 157 (7.7%) |
| 50 to 54 Years | 158 (7.4%) | 193 (9.4%) |
| 55 to 59 Years | 126 (5.9%) | 222 (10.8%) |
| 60 to 64 Years | 334 (15.6%) | 316 (15.4%) |
| 65 to 69 Years | 127 (5.9%) | 230 (11.2%) |
| 70 to 74 Years | 329 (15.3%) | 161 (7.9%) |
| 75 to 79 Years | 117 (5.4%) | 145 (7.1%) |
| 80 to 84 Years | 21 (1.0%) | 17 (0.8%) |
| 85 Years and over | 57 (2.6%) | 63 (3.1%) |
| Total | 2,147 (100.0%) | 2,047 (100.0%) |
Families and Households in Laguna Beach
Median Family Size in Laguna Beach
The median family size in Laguna Beach is 2.25 persons per family, with married-couple families (1,013 | 77.1%) accounting for the largest median family size of 2.3 persons per family. On the other hand, single male/father families (130 | 9.9%) represent the smallest median family size with 1.88 persons per family.
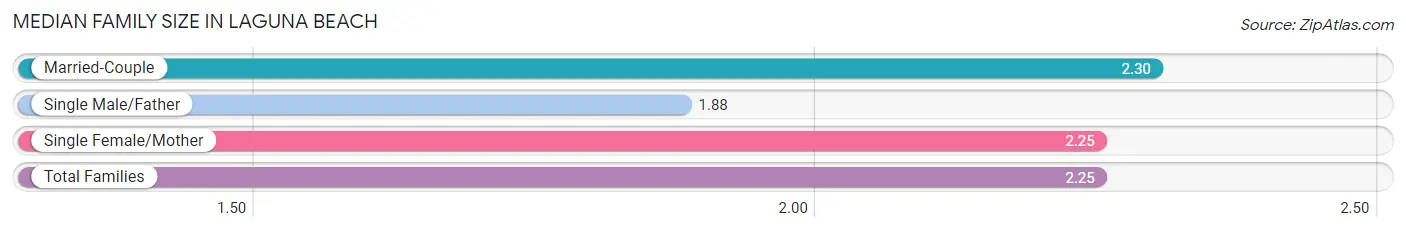
| Family Type | # Families | Family Size |
| Married-Couple | 1,013 (77.1%) | 2.30 |
| Single Male/Father | 130 (9.9%) | 1.88 |
| Single Female/Mother | 170 (13.0%) | 2.25 |
| Total Families | 1,313 (100.0%) | 2.25 |
Median Household Size in Laguna Beach
The median household size in Laguna Beach is 1.78 persons per household, with single female/mother households (170 | 7.2%) accounting for the largest median household size of 2.87 persons per household. non-family households (1,046 | 44.3%) represent the smallest median household size with 1.09 persons per household.
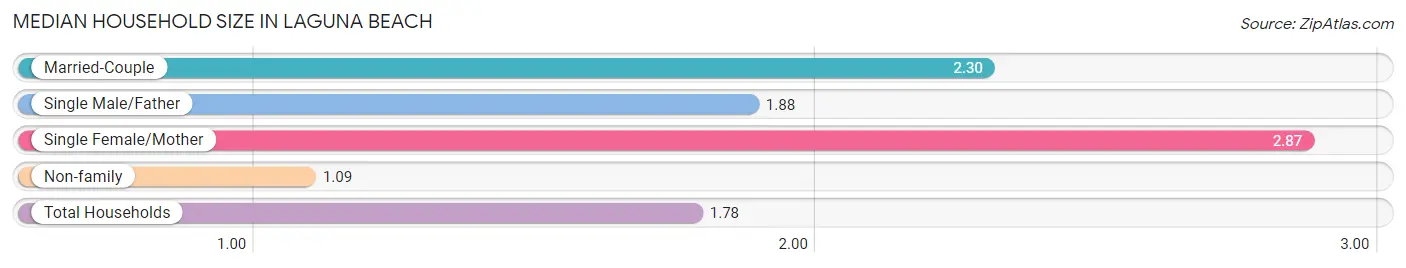
| Household Type | # Households | Household Size |
| Married-Couple | 1,013 (42.9%) | 2.30 |
| Single Male/Father | 130 (5.5%) | 1.88 |
| Single Female/Mother | 170 (7.2%) | 2.87 |
| Non-family | 1,046 (44.3%) | 1.09 |
| Total Households | 2,359 (100.0%) | 1.78 |
Household Size by Marriage Status in Laguna Beach
Out of a total of 2,359 households in Laguna Beach, 1,313 (55.7%) are family households, while 1,046 (44.3%) are nonfamily households. The most numerous type of family households are 2-person households, comprising 951, and the most common type of nonfamily households are 1-person households, comprising 959.
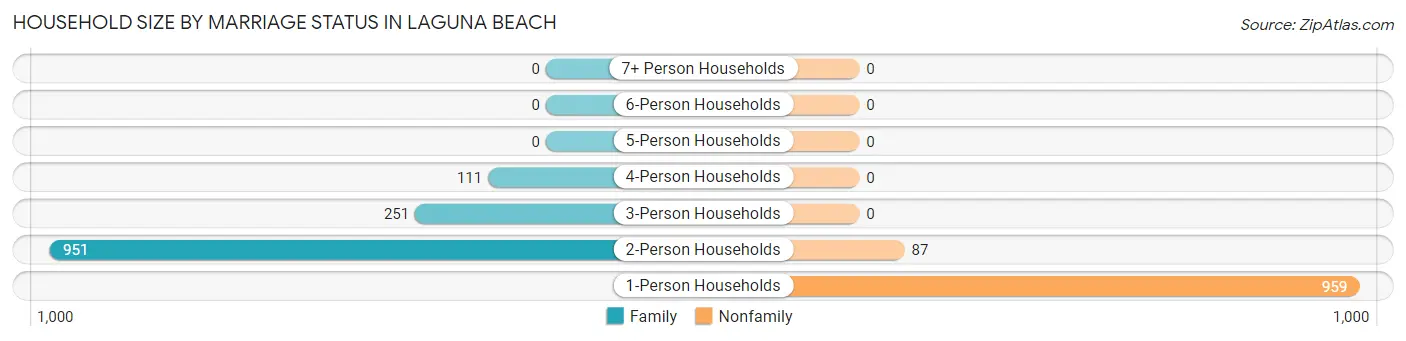
| Household Size | Family Households | Nonfamily Households |
| 1-Person Households | - | 959 (40.6%) |
| 2-Person Households | 951 (40.3%) | 87 (3.7%) |
| 3-Person Households | 251 (10.6%) | 0 (0.0%) |
| 4-Person Households | 111 (4.7%) | 0 (0.0%) |
| 5-Person Households | 0 (0.0%) | 0 (0.0%) |
| 6-Person Households | 0 (0.0%) | 0 (0.0%) |
| 7+ Person Households | 0 (0.0%) | 0 (0.0%) |
| Total | 1,313 (55.7%) | 1,046 (44.3%) |
Female Fertility in Laguna Beach
Fertility by Age in Laguna Beach
Average fertility rate in Laguna Beach is 25.0 births per 1,000 women. Women in the age bracket of 35 to 50 years have the highest fertility rate with 33.0 births per 1,000 women. Women in the age bracket of 35 to 50 years acount for 100.0% of all women with births.
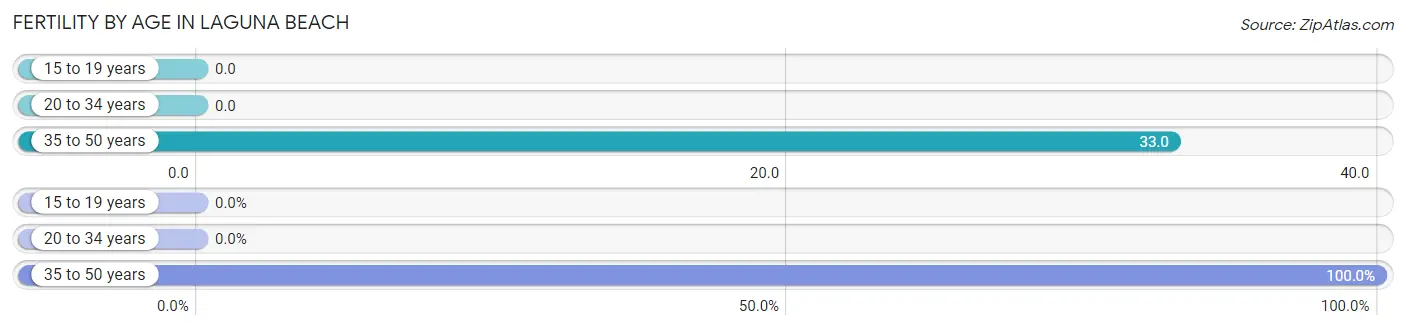
| Age Bracket | Women with Births | Births / 1,000 Women |
| 15 to 19 years | 0 (0.0%) | 0.0 |
| 20 to 34 years | 0 (0.0%) | 0.0 |
| 35 to 50 years | 14 (100.0%) | 33.0 |
| Total | 14 (100.0%) | 25.0 |
Fertility by Age by Marriage Status in Laguna Beach
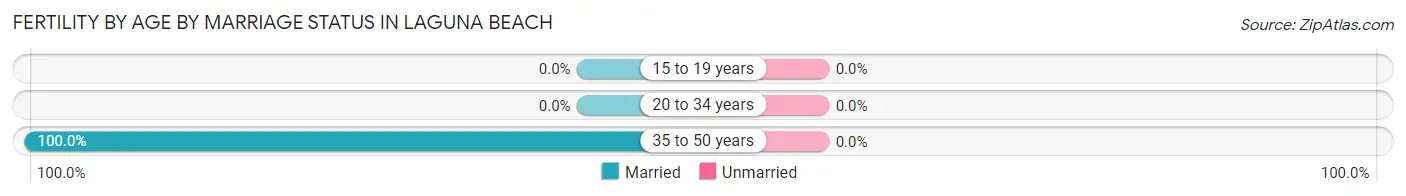
| Age Bracket | Married | Unmarried |
| 15 to 19 years | 0 (0.0%) | 0 (0.0%) |
| 20 to 34 years | 0 (0.0%) | 0 (0.0%) |
| 35 to 50 years | 14 (100.0%) | 0 (0.0%) |
| Total | 14 (100.0%) | 0 (0.0%) |
Fertility by Education in Laguna Beach
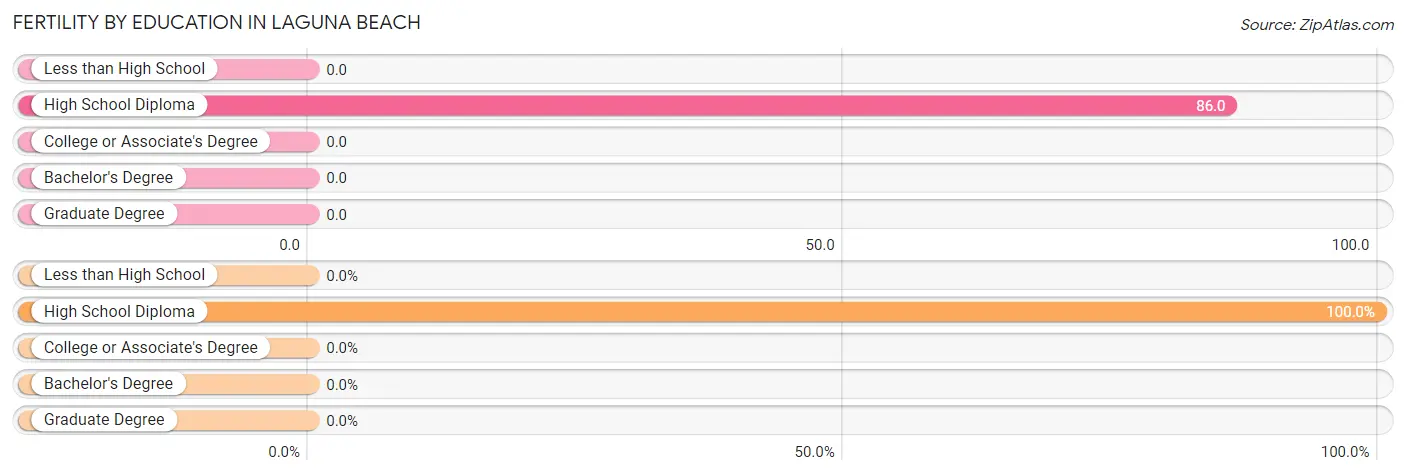
| Educational Attainment | Women with Births | Births / 1,000 Women |
| Less than High School | 0 (0.0%) | 0.0 |
| High School Diploma | 14 (100.0%) | 86.0 |
| College or Associate's Degree | 0 (0.0%) | 0.0 |
| Bachelor's Degree | 0 (0.0%) | 0.0 |
| Graduate Degree | 0 (0.0%) | 0.0 |
| Total | 14 (100.0%) | 25.0 |
Fertility by Education by Marriage Status in Laguna Beach
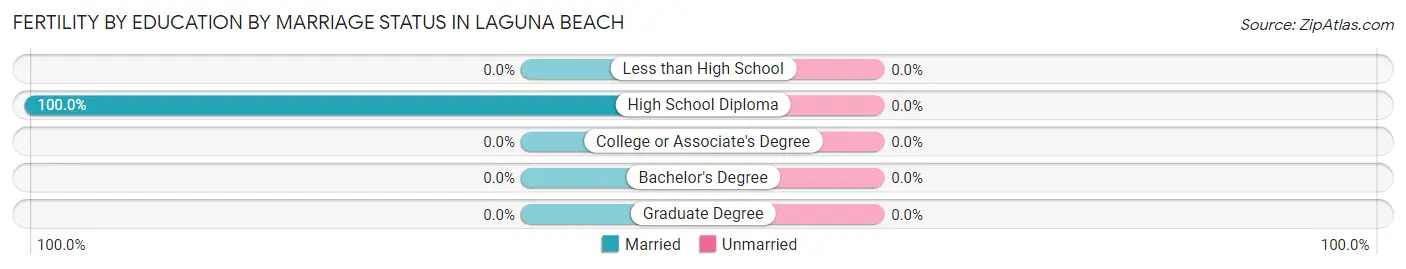
| Educational Attainment | Married | Unmarried |
| Less than High School | 0 (0.0%) | 0 (0.0%) |
| High School Diploma | 14 (100.0%) | 0 (0.0%) |
| College or Associate's Degree | 0 (0.0%) | 0 (0.0%) |
| Bachelor's Degree | 0 (0.0%) | 0 (0.0%) |
| Graduate Degree | 0 (0.0%) | 0 (0.0%) |
| Total | 14 (100.0%) | 0 (0.0%) |
Employment Characteristics in Laguna Beach
Employment by Class of Employer in Laguna Beach
Among the 2,173 employed individuals in Laguna Beach, private company employees (1,322 | 60.8%), local government employees (246 | 11.3%), and state government employees (221 | 10.2%) make up the most common classes of employment.
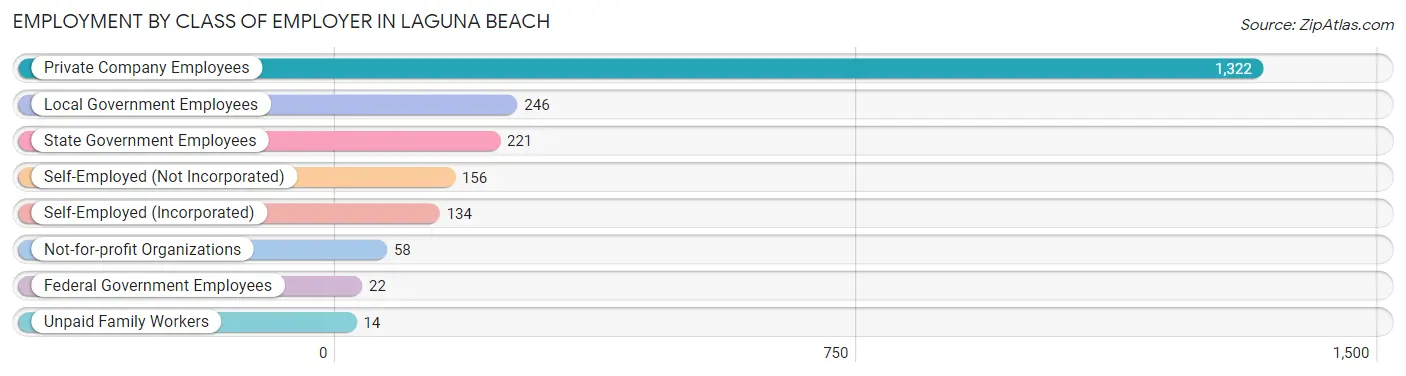
| Employer Class | # Employees | % Employees |
| Private Company Employees | 1,322 | 60.8% |
| Self-Employed (Incorporated) | 134 | 6.2% |
| Self-Employed (Not Incorporated) | 156 | 7.2% |
| Not-for-profit Organizations | 58 | 2.7% |
| Local Government Employees | 246 | 11.3% |
| State Government Employees | 221 | 10.2% |
| Federal Government Employees | 22 | 1.0% |
| Unpaid Family Workers | 14 | 0.6% |
| Total | 2,173 | 100.0% |
Employment Status by Age in Laguna Beach
According to the labor force statistics for Laguna Beach, out of the total population over 16 years of age (3,954), 55.5% or 2,194 individuals are in the labor force, with 0.1% or 2 of them unemployed. The age group with the highest labor force participation rate is 20 to 24 years, with 100.0% or 73 individuals in the labor force. Within the labor force, the 35 to 44 years age range has the highest percentage of unemployed individuals, with 0.4% or 2 of them being unemployed.
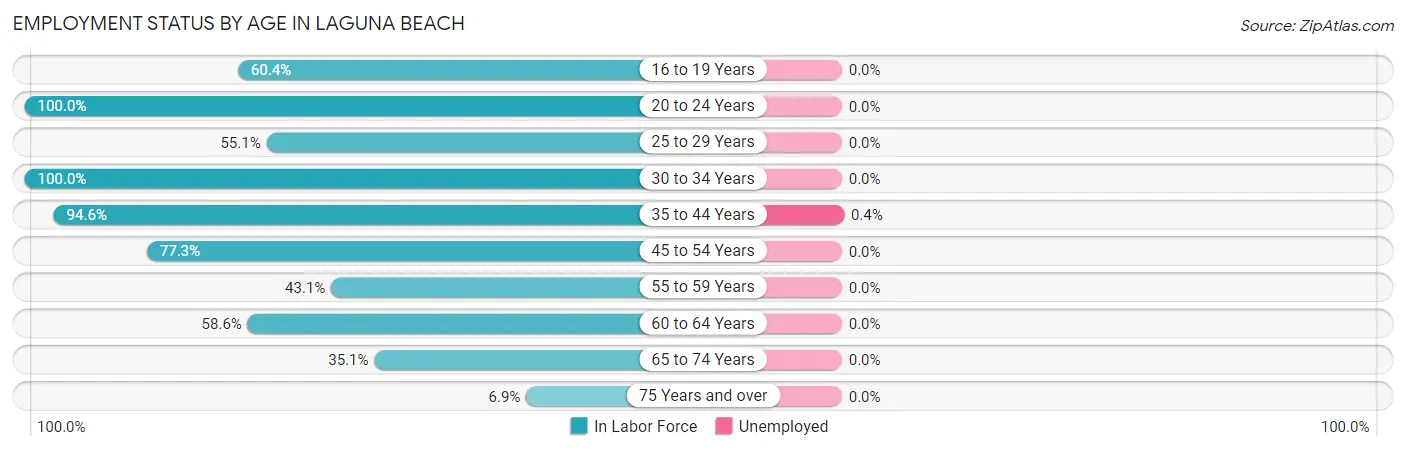
| Age Bracket | In Labor Force | Unemployed |
| 16 to 19 Years | 61 (60.4%) | 0 (0.0%) |
| 20 to 24 Years | 73 (100.0%) | 0 (0.0%) |
| 25 to 29 Years | 193 (55.1%) | 0 (0.0%) |
| 30 to 34 Years | 53 (100.0%) | 0 (0.0%) |
| 35 to 44 Years | 527 (94.6%) | 2 (0.4%) |
| 45 to 54 Years | 429 (77.3%) | 0 (0.0%) |
| 55 to 59 Years | 150 (43.1%) | 0 (0.0%) |
| 60 to 64 Years | 381 (58.6%) | 0 (0.0%) |
| 65 to 74 Years | 297 (35.1%) | 0 (0.0%) |
| 75 Years and over | 29 (6.9%) | 0 (0.0%) |
| Total | 2,194 (55.5%) | 2 (0.1%) |
Employment Status by Educational Attainment in Laguna Beach
According to labor force statistics for Laguna Beach, 69.0% of individuals (1,734) out of the total population between 25 and 64 years of age (2,513) are in the labor force, with 0.1% or 2 of them being unemployed. The group with the highest labor force participation rate are those with the educational attainment of college / associate degree, with 80.8% or 679 individuals in the labor force. Within the labor force, individuals with college / associate degree education have the highest percentage of unemployment, with 0.3% or 2 of them being unemployed.
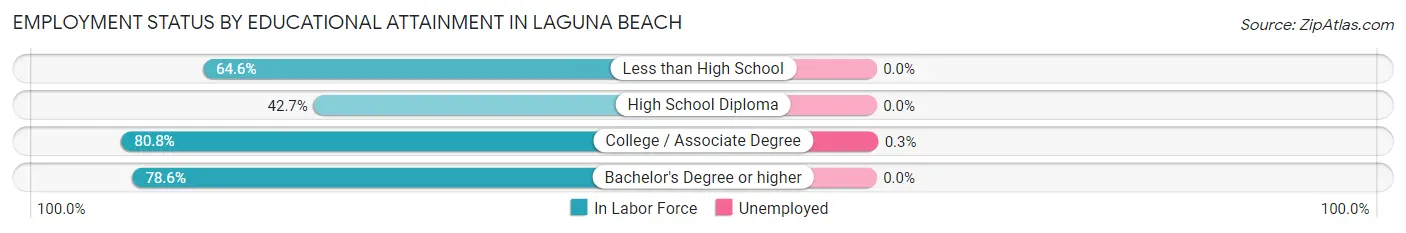
| Educational Attainment | In Labor Force | Unemployed |
| Less than High School | 31 (64.6%) | 0 (0.0%) |
| High School Diploma | 303 (42.7%) | 0 (0.0%) |
| College / Associate Degree | 679 (80.8%) | 3 (0.3%) |
| Bachelor's Degree or higher | 720 (78.6%) | 0 (0.0%) |
| Total | 1,734 (69.0%) | 3 (0.1%) |
Employment Occupations by Sex in Laguna Beach
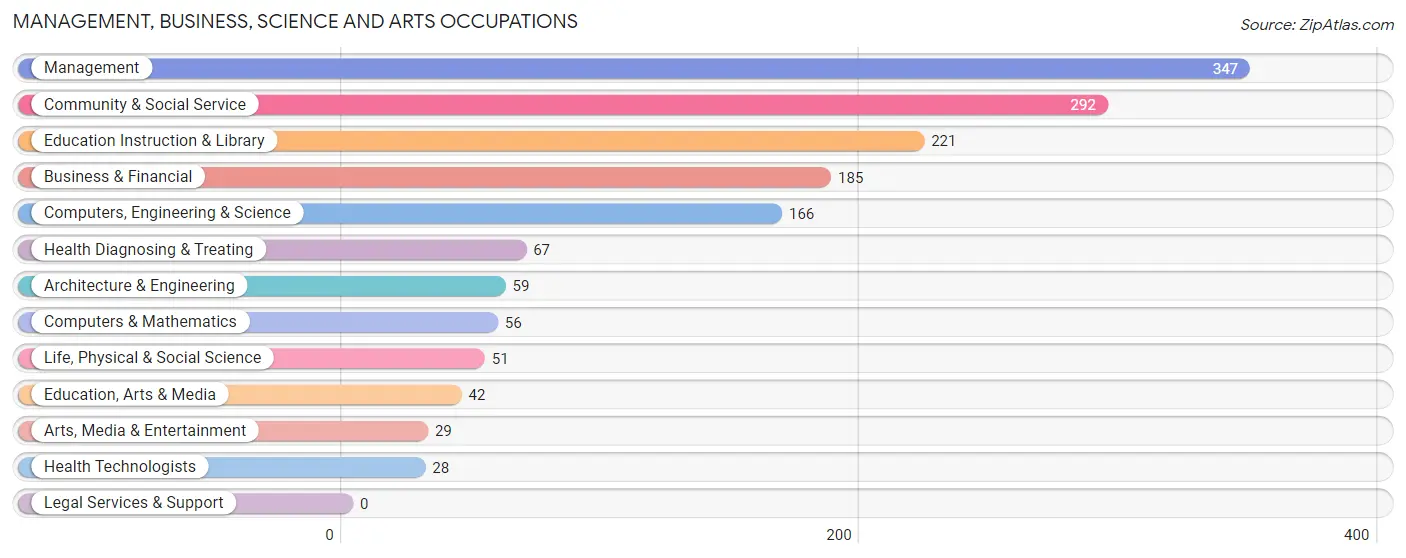
Management, Business, Science and Arts Occupations
The most common Management, Business, Science and Arts occupations in Laguna Beach are Management (347 | 15.8%), Community & Social Service (292 | 13.3%), Education Instruction & Library (221 | 10.1%), Business & Financial (185 | 8.4%), and Computers, Engineering & Science (166 | 7.6%).
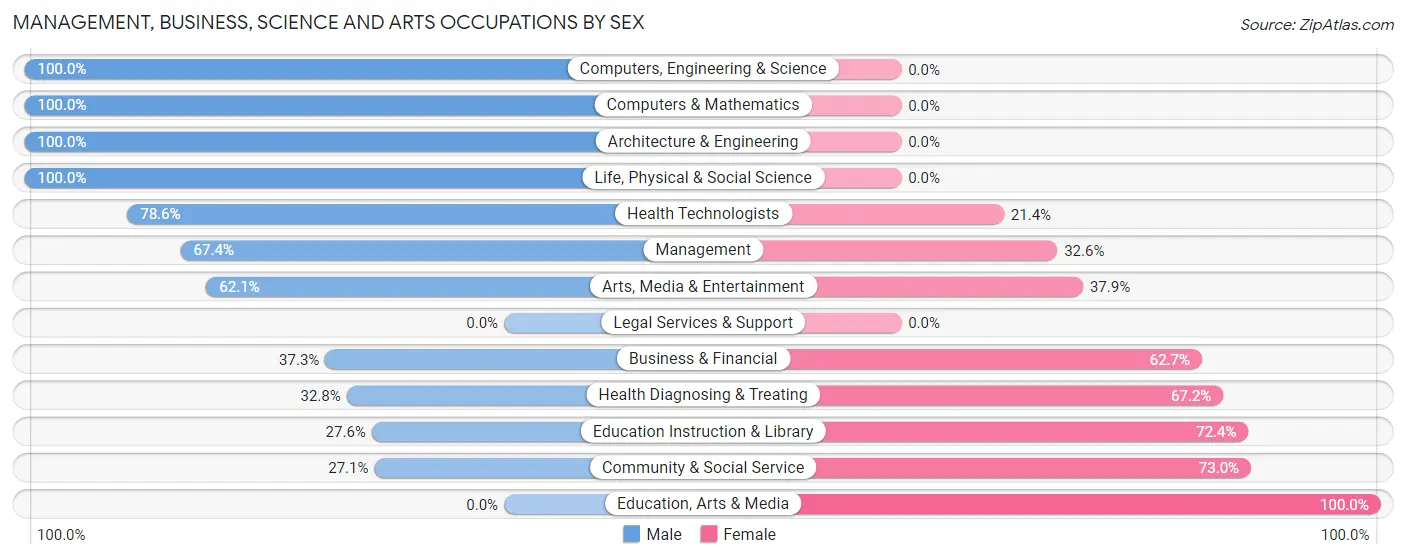
Management, Business, Science and Arts Occupations by Sex
Within the Management, Business, Science and Arts occupations in Laguna Beach, the most male-oriented occupations are Computers, Engineering & Science (100.0%), Computers & Mathematics (100.0%), and Architecture & Engineering (100.0%), while the most female-oriented occupations are Education, Arts & Media (100.0%), Community & Social Service (73.0%), and Education Instruction & Library (72.4%).
| Occupation | Male | Female |
| Management | 234 (67.4%) | 113 (32.6%) |
| Business & Financial | 69 (37.3%) | 116 (62.7%) |
| Computers, Engineering & Science | 166 (100.0%) | 0 (0.0%) |
| Computers & Mathematics | 56 (100.0%) | 0 (0.0%) |
| Architecture & Engineering | 59 (100.0%) | 0 (0.0%) |
| Life, Physical & Social Science | 51 (100.0%) | 0 (0.0%) |
| Community & Social Service | 79 (27.1%) | 213 (73.0%) |
| Education, Arts & Media | 0 (0.0%) | 42 (100.0%) |
| Legal Services & Support | 0 (0.0%) | 0 (0.0%) |
| Education Instruction & Library | 61 (27.6%) | 160 (72.4%) |
| Arts, Media & Entertainment | 18 (62.1%) | 11 (37.9%) |
| Health Diagnosing & Treating | 22 (32.8%) | 45 (67.2%) |
| Health Technologists | 22 (78.6%) | 6 (21.4%) |
| Total (Category) | 570 (53.9%) | 487 (46.1%) |
| Total (Overall) | 1,229 (56.1%) | 962 (43.9%) |
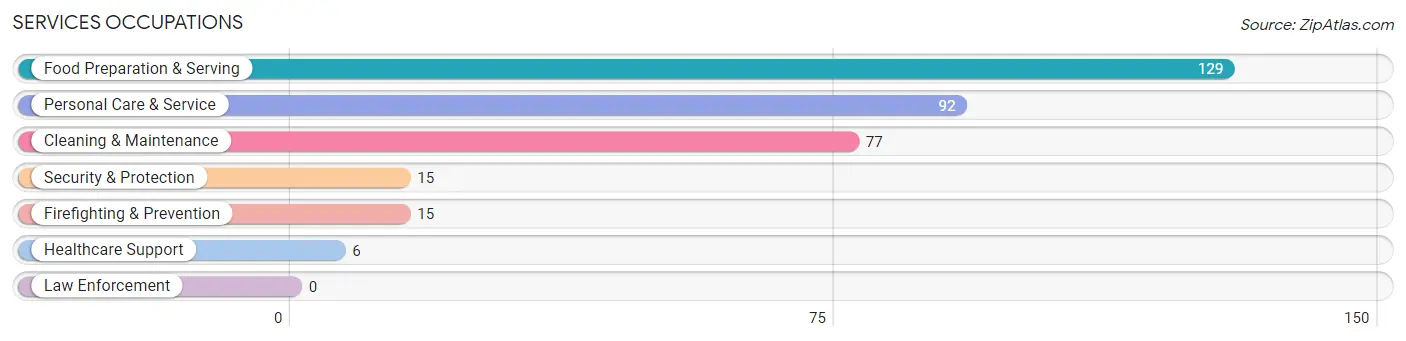
Services Occupations
The most common Services occupations in Laguna Beach are Food Preparation & Serving (129 | 5.9%), Personal Care & Service (92 | 4.2%), Cleaning & Maintenance (77 | 3.5%), Security & Protection (15 | 0.7%), and Firefighting & Prevention (15 | 0.7%).
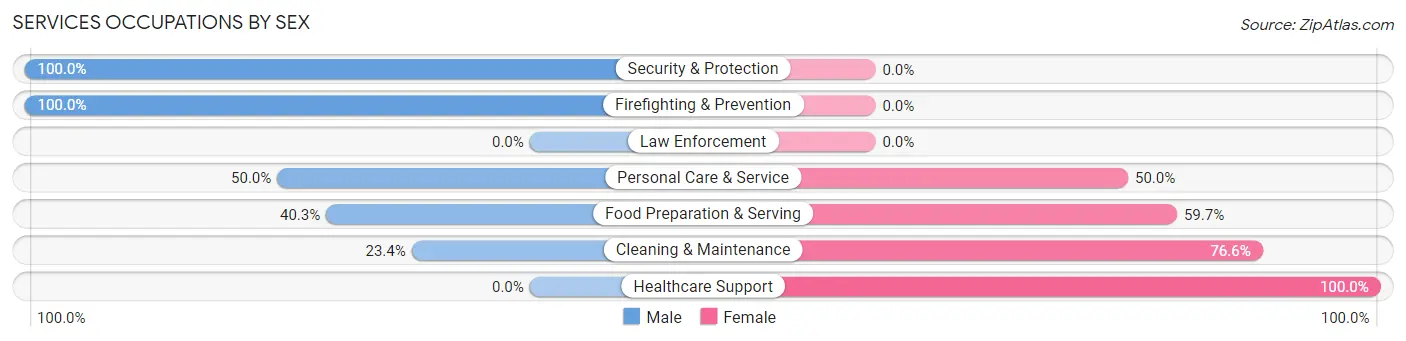
Services Occupations by Sex
Within the Services occupations in Laguna Beach, the most male-oriented occupations are Security & Protection (100.0%), Firefighting & Prevention (100.0%), and Personal Care & Service (50.0%), while the most female-oriented occupations are Healthcare Support (100.0%), Cleaning & Maintenance (76.6%), and Food Preparation & Serving (59.7%).
| Occupation | Male | Female |
| Healthcare Support | 0 (0.0%) | 6 (100.0%) |
| Security & Protection | 15 (100.0%) | 0 (0.0%) |
| Firefighting & Prevention | 15 (100.0%) | 0 (0.0%) |
| Law Enforcement | 0 (0.0%) | 0 (0.0%) |
| Food Preparation & Serving | 52 (40.3%) | 77 (59.7%) |
| Cleaning & Maintenance | 18 (23.4%) | 59 (76.6%) |
| Personal Care & Service | 46 (50.0%) | 46 (50.0%) |
| Total (Category) | 131 (41.1%) | 188 (58.9%) |
| Total (Overall) | 1,229 (56.1%) | 962 (43.9%) |
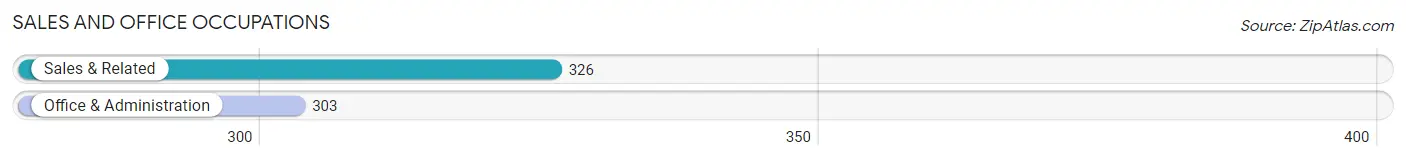
Sales and Office Occupations
The most common Sales and Office occupations in Laguna Beach are Sales & Related (326 | 14.9%), and Office & Administration (303 | 13.8%).
Sales and Office Occupations by Sex
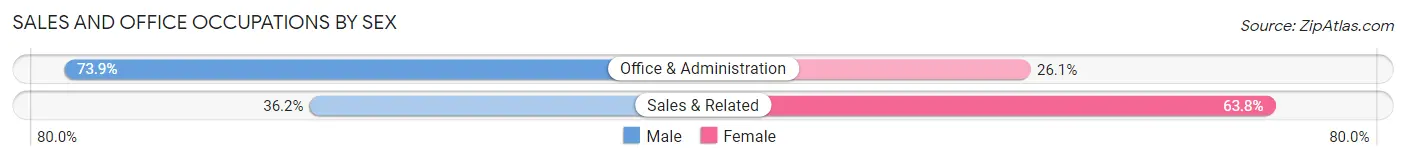
| Occupation | Male | Female |
| Sales & Related | 118 (36.2%) | 208 (63.8%) |
| Office & Administration | 224 (73.9%) | 79 (26.1%) |
| Total (Category) | 342 (54.4%) | 287 (45.6%) |
| Total (Overall) | 1,229 (56.1%) | 962 (43.9%) |
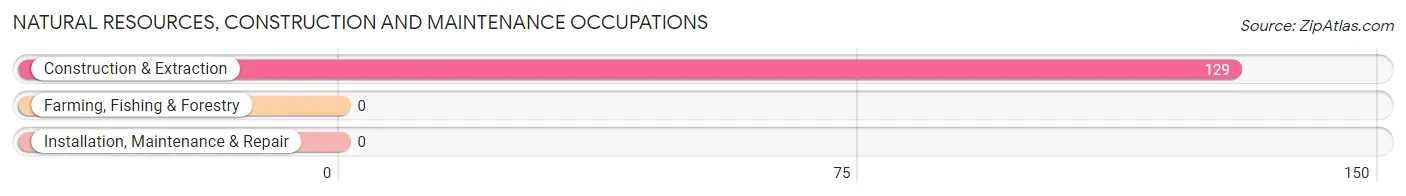
Natural Resources, Construction and Maintenance Occupations
The most common Natural Resources, Construction and Maintenance occupations in Laguna Beach are , and Construction & Extraction (129 | 5.9%).
Natural Resources, Construction and Maintenance Occupations by Sex
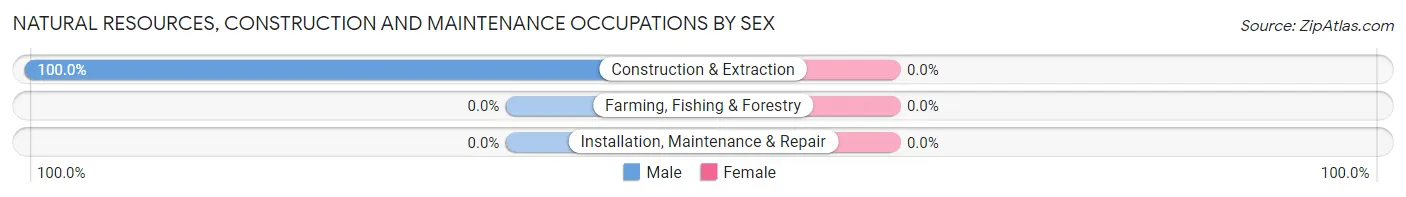
| Occupation | Male | Female |
| Farming, Fishing & Forestry | 0 (0.0%) | 0 (0.0%) |
| Construction & Extraction | 129 (100.0%) | 0 (0.0%) |
| Installation, Maintenance & Repair | 0 (0.0%) | 0 (0.0%) |
| Total (Category) | 129 (100.0%) | 0 (0.0%) |
| Total (Overall) | 1,229 (56.1%) | 962 (43.9%) |
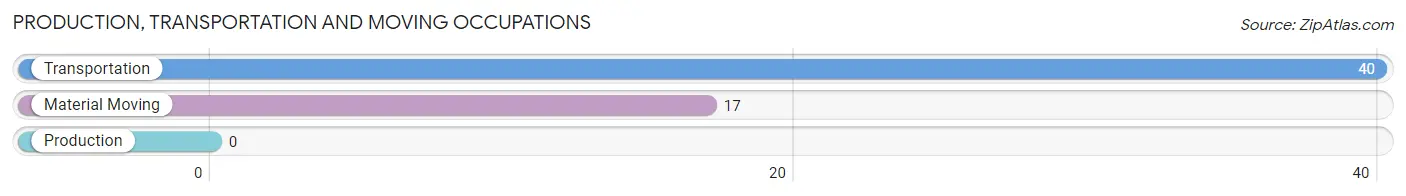
Production, Transportation and Moving Occupations
The most common Production, Transportation and Moving occupations in Laguna Beach are Transportation (40 | 1.8%), and Material Moving (17 | 0.8%).
Production, Transportation and Moving Occupations by Sex
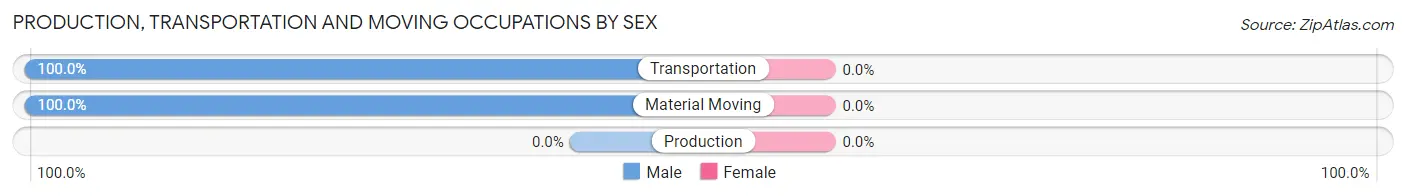
| Occupation | Male | Female |
| Production | 0 (0.0%) | 0 (0.0%) |
| Transportation | 40 (100.0%) | 0 (0.0%) |
| Material Moving | 17 (100.0%) | 0 (0.0%) |
| Total (Category) | 57 (100.0%) | 0 (0.0%) |
| Total (Overall) | 1,229 (56.1%) | 962 (43.9%) |
Employment Industries by Sex in Laguna Beach
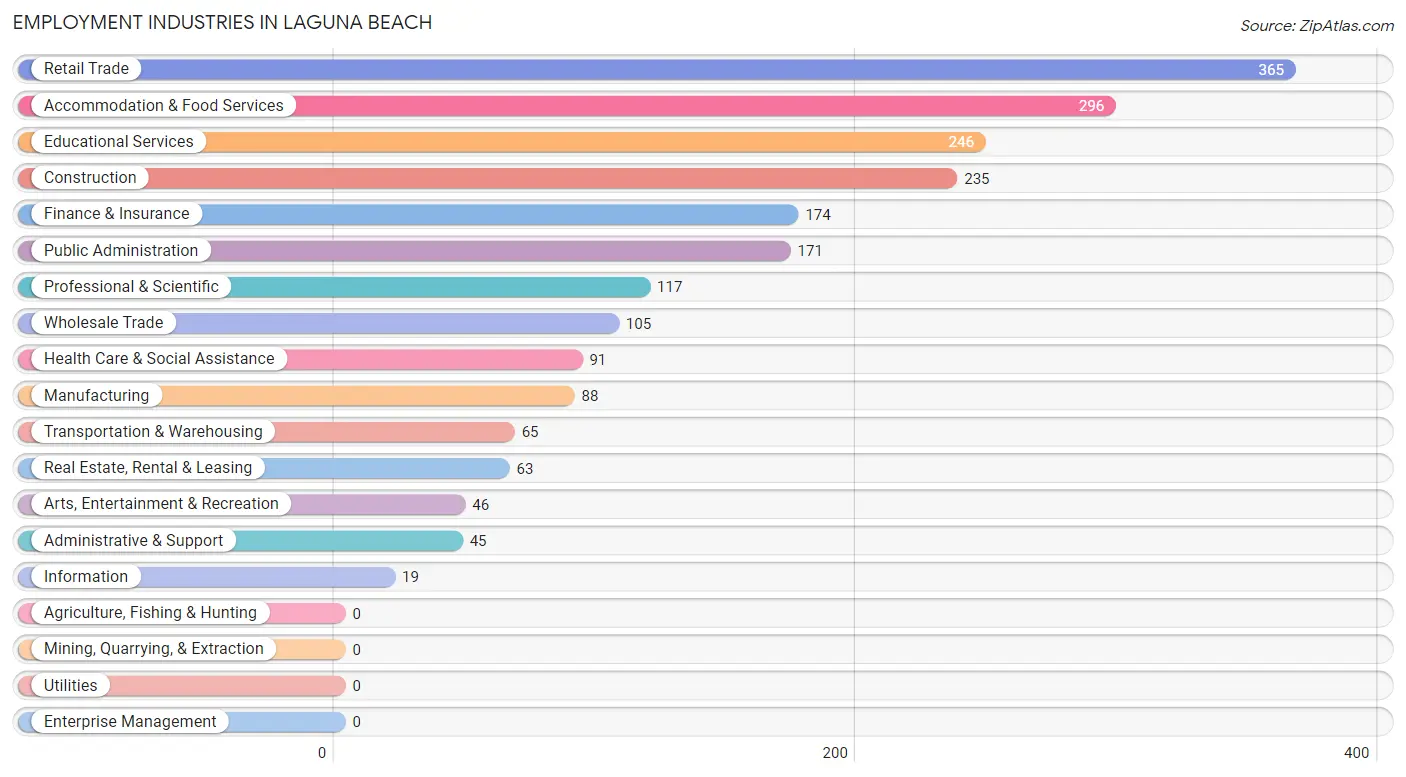
Employment Industries in Laguna Beach
The major employment industries in Laguna Beach include Retail Trade (365 | 16.7%), Accommodation & Food Services (296 | 13.5%), Educational Services (246 | 11.2%), Construction (235 | 10.7%), and Finance & Insurance (174 | 7.9%).
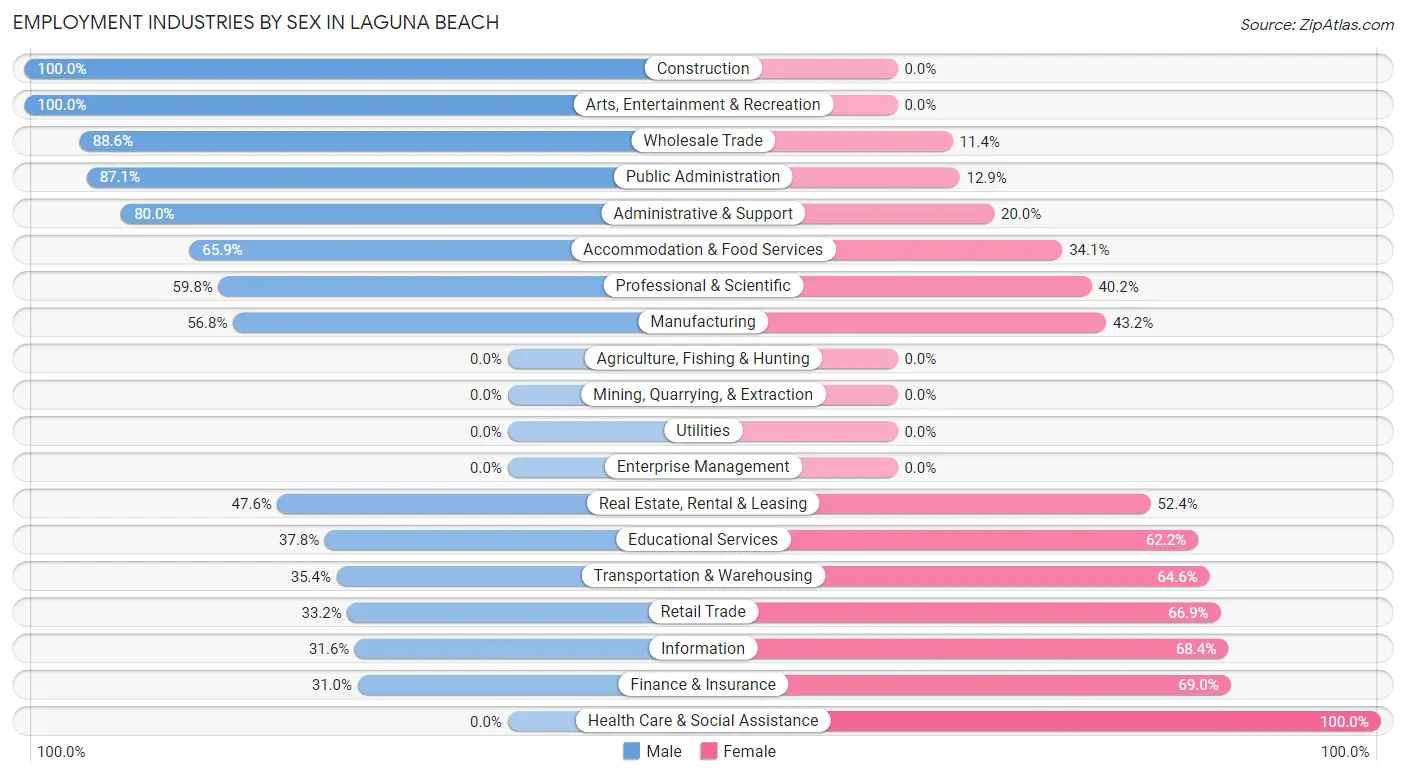
Employment Industries by Sex in Laguna Beach
The Laguna Beach industries that see more men than women are Construction (100.0%), Arts, Entertainment & Recreation (100.0%), and Wholesale Trade (88.6%), whereas the industries that tend to have a higher number of women are Health Care & Social Assistance (100.0%), Finance & Insurance (69.0%), and Information (68.4%).
| Industry | Male | Female |
| Agriculture, Fishing & Hunting | 0 (0.0%) | 0 (0.0%) |
| Mining, Quarrying, & Extraction | 0 (0.0%) | 0 (0.0%) |
| Construction | 235 (100.0%) | 0 (0.0%) |
| Manufacturing | 50 (56.8%) | 38 (43.2%) |
| Wholesale Trade | 93 (88.6%) | 12 (11.4%) |
| Retail Trade | 121 (33.2%) | 244 (66.8%) |
| Transportation & Warehousing | 23 (35.4%) | 42 (64.6%) |
| Utilities | 0 (0.0%) | 0 (0.0%) |
| Information | 6 (31.6%) | 13 (68.4%) |
| Finance & Insurance | 54 (31.0%) | 120 (69.0%) |
| Real Estate, Rental & Leasing | 30 (47.6%) | 33 (52.4%) |
| Professional & Scientific | 70 (59.8%) | 47 (40.2%) |
| Enterprise Management | 0 (0.0%) | 0 (0.0%) |
| Administrative & Support | 36 (80.0%) | 9 (20.0%) |
| Educational Services | 93 (37.8%) | 153 (62.2%) |
| Health Care & Social Assistance | 0 (0.0%) | 91 (100.0%) |
| Arts, Entertainment & Recreation | 46 (100.0%) | 0 (0.0%) |
| Accommodation & Food Services | 195 (65.9%) | 101 (34.1%) |
| Public Administration | 149 (87.1%) | 22 (12.9%) |
| Total | 1,229 (56.1%) | 962 (43.9%) |
Education in Laguna Beach
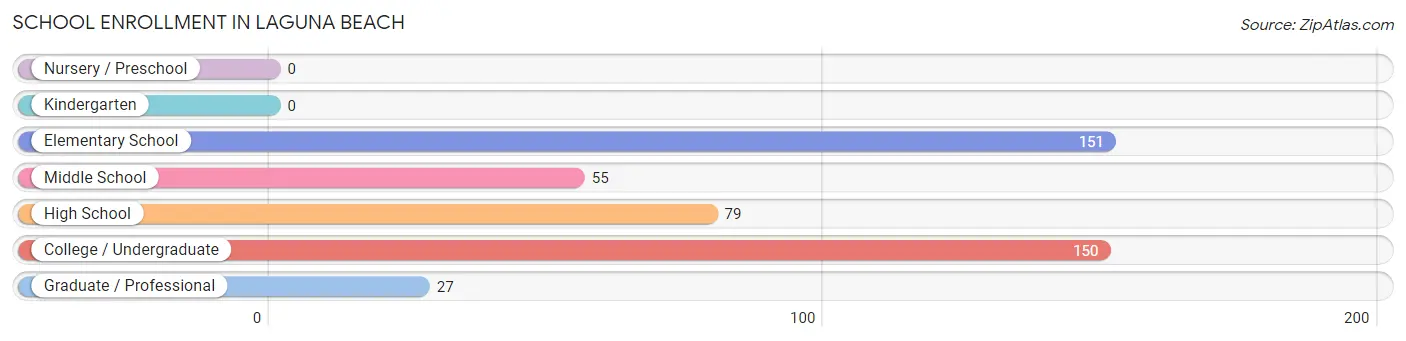
School Enrollment in Laguna Beach
The most common levels of schooling among the 462 students in Laguna Beach are elementary school (151 | 32.7%), college / undergraduate (150 | 32.5%), and high school (79 | 17.1%).
| School Level | # Students | % Students |
| Nursery / Preschool | 0 | 0.0% |
| Kindergarten | 0 | 0.0% |
| Elementary School | 151 | 32.7% |
| Middle School | 55 | 11.9% |
| High School | 79 | 17.1% |
| College / Undergraduate | 150 | 32.5% |
| Graduate / Professional | 27 | 5.8% |
| Total | 462 | 100.0% |
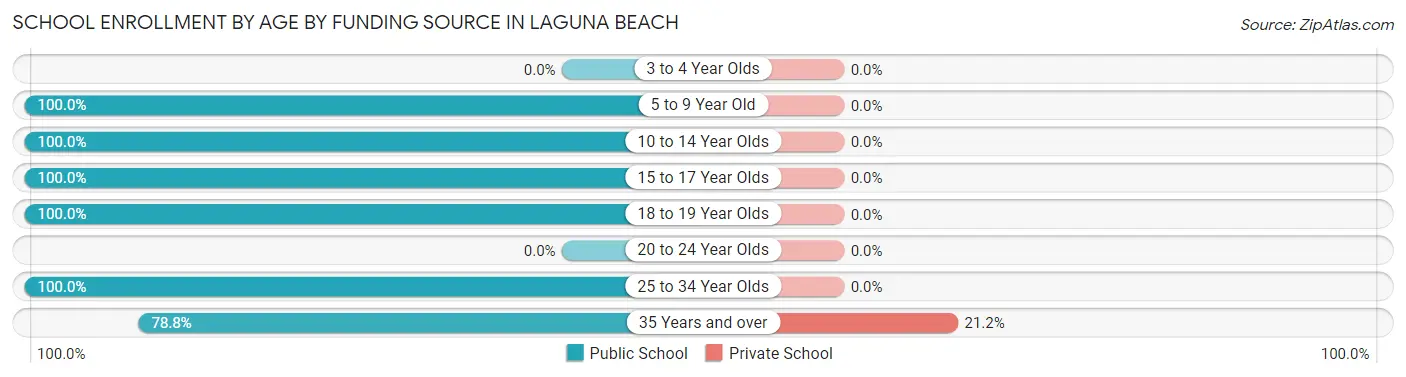
School Enrollment by Age by Funding Source in Laguna Beach
Out of a total of 462 students who are enrolled in schools in Laguna Beach, 14 (3.0%) attend a private institution, while the remaining 448 (97.0%) are enrolled in public schools. The age group of 35 years and over has the highest likelihood of being enrolled in private schools, with 14 (21.2% in the age bracket) enrolled. Conversely, the age group of 5 to 9 year old has the lowest likelihood of being enrolled in a private school, with 151 (100.0% in the age bracket) attending a public institution.
| Age Bracket | Public School | Private School |
| 3 to 4 Year Olds | 0 (0.0%) | 0 (0.0%) |
| 5 to 9 Year Old | 151 (100.0%) | 0 (0.0%) |
| 10 to 14 Year Olds | 55 (100.0%) | 0 (0.0%) |
| 15 to 17 Year Olds | 75 (100.0%) | 0 (0.0%) |
| 18 to 19 Year Olds | 41 (100.0%) | 0 (0.0%) |
| 20 to 24 Year Olds | 0 (0.0%) | 0 (0.0%) |
| 25 to 34 Year Olds | 74 (100.0%) | 0 (0.0%) |
| 35 Years and over | 52 (78.8%) | 14 (21.2%) |
| Total | 448 (97.0%) | 14 (3.0%) |
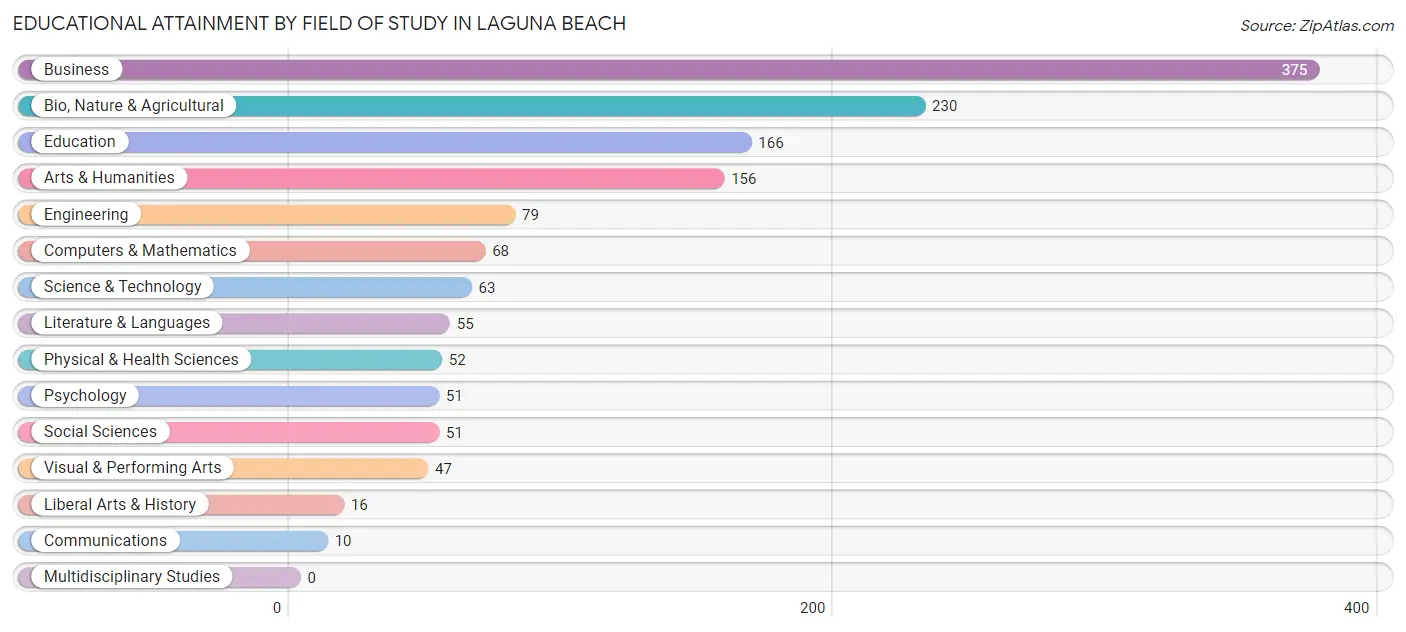
Educational Attainment by Field of Study in Laguna Beach
Business (375 | 26.4%), bio, nature & agricultural (230 | 16.2%), education (166 | 11.7%), arts & humanities (156 | 11.0%), and engineering (79 | 5.6%) are the most common fields of study among 1,419 individuals in Laguna Beach who have obtained a bachelor's degree or higher.
| Field of Study | # Graduates | % Graduates |
| Computers & Mathematics | 68 | 4.8% |
| Bio, Nature & Agricultural | 230 | 16.2% |
| Physical & Health Sciences | 52 | 3.7% |
| Psychology | 51 | 3.6% |
| Social Sciences | 51 | 3.6% |
| Engineering | 79 | 5.6% |
| Multidisciplinary Studies | 0 | 0.0% |
| Science & Technology | 63 | 4.4% |
| Business | 375 | 26.4% |
| Education | 166 | 11.7% |
| Literature & Languages | 55 | 3.9% |
| Liberal Arts & History | 16 | 1.1% |
| Visual & Performing Arts | 47 | 3.3% |
| Communications | 10 | 0.7% |
| Arts & Humanities | 156 | 11.0% |
| Total | 1,419 | 100.0% |
Transportation & Commute in Laguna Beach
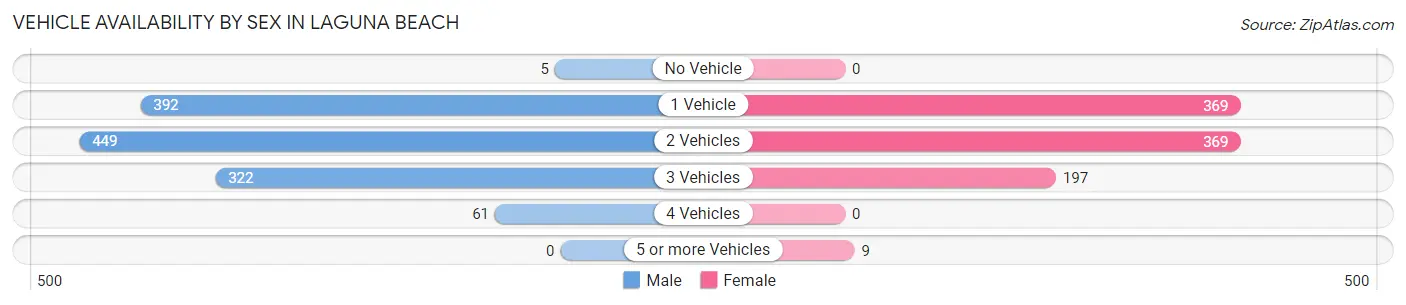
Vehicle Availability by Sex in Laguna Beach
The most prevalent vehicle ownership categories in Laguna Beach are males with 2 vehicles (449, accounting for 36.5%) and females with 2 vehicles (369, making up 47.6%).
| Vehicles Available | Male | Female |
| No Vehicle | 5 (0.4%) | 0 (0.0%) |
| 1 Vehicle | 392 (31.9%) | 369 (39.1%) |
| 2 Vehicles | 449 (36.5%) | 369 (39.1%) |
| 3 Vehicles | 322 (26.2%) | 197 (20.9%) |
| 4 Vehicles | 61 (5.0%) | 0 (0.0%) |
| 5 or more Vehicles | 0 (0.0%) | 9 (0.9%) |
| Total | 1,229 (100.0%) | 944 (100.0%) |
Commute Time in Laguna Beach
The most frequently occuring commute durations in Laguna Beach are 5 to 9 minutes (422 commuters, 23.4%), 30 to 34 minutes (422 commuters, 23.4%), and 10 to 14 minutes (308 commuters, 17.1%).
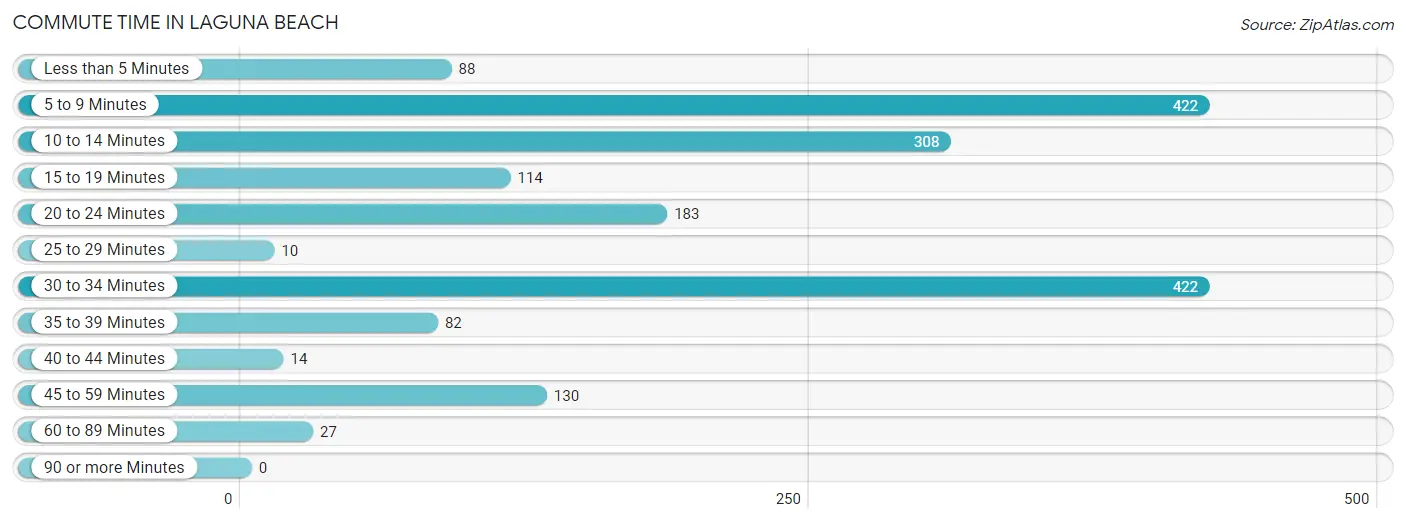
| Commute Time | # Commuters | % Commuters |
| Less than 5 Minutes | 88 | 4.9% |
| 5 to 9 Minutes | 422 | 23.4% |
| 10 to 14 Minutes | 308 | 17.1% |
| 15 to 19 Minutes | 114 | 6.3% |
| 20 to 24 Minutes | 183 | 10.2% |
| 25 to 29 Minutes | 10 | 0.6% |
| 30 to 34 Minutes | 422 | 23.4% |
| 35 to 39 Minutes | 82 | 4.6% |
| 40 to 44 Minutes | 14 | 0.8% |
| 45 to 59 Minutes | 130 | 7.2% |
| 60 to 89 Minutes | 27 | 1.5% |
| 90 or more Minutes | 0 | 0.0% |
Commute Time by Sex in Laguna Beach
The most common commute times in Laguna Beach are 5 to 9 minutes (237 commuters, 23.7%) for males and 30 to 34 minutes (230 commuters, 28.7%) for females.
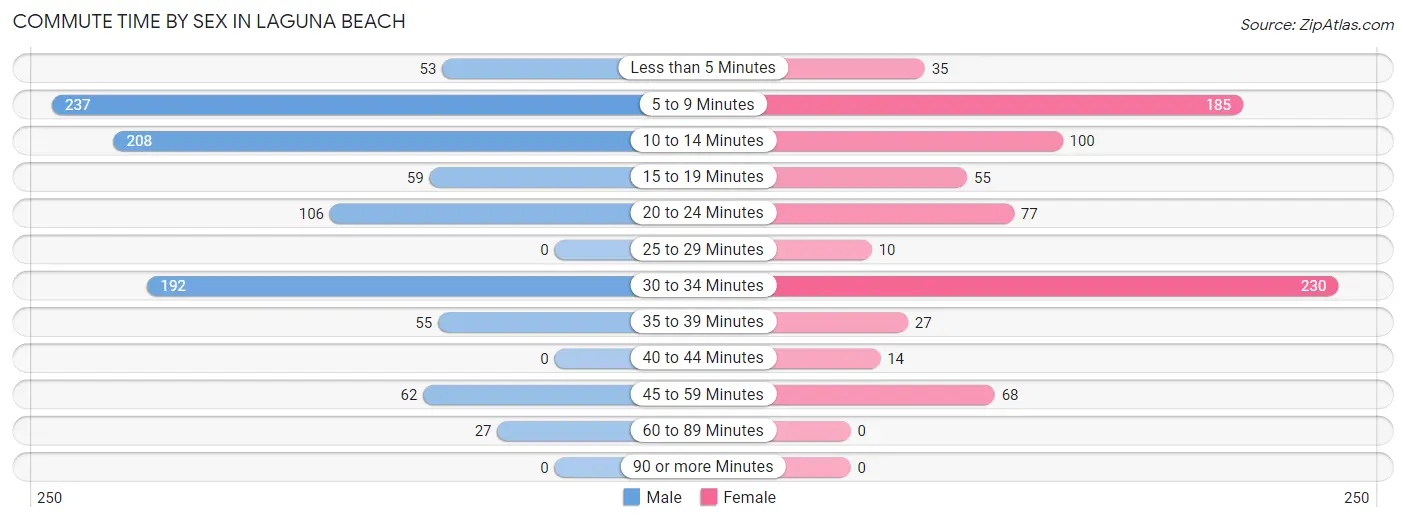
| Commute Time | Male | Female |
| Less than 5 Minutes | 53 (5.3%) | 35 (4.4%) |
| 5 to 9 Minutes | 237 (23.7%) | 185 (23.1%) |
| 10 to 14 Minutes | 208 (20.8%) | 100 (12.5%) |
| 15 to 19 Minutes | 59 (5.9%) | 55 (6.9%) |
| 20 to 24 Minutes | 106 (10.6%) | 77 (9.6%) |
| 25 to 29 Minutes | 0 (0.0%) | 10 (1.3%) |
| 30 to 34 Minutes | 192 (19.2%) | 230 (28.7%) |
| 35 to 39 Minutes | 55 (5.5%) | 27 (3.4%) |
| 40 to 44 Minutes | 0 (0.0%) | 14 (1.8%) |
| 45 to 59 Minutes | 62 (6.2%) | 68 (8.5%) |
| 60 to 89 Minutes | 27 (2.7%) | 0 (0.0%) |
| 90 or more Minutes | 0 (0.0%) | 0 (0.0%) |
Time of Departure to Work by Sex in Laguna Beach
The most frequent times of departure to work in Laguna Beach are 6:00 AM to 6:29 AM (204, 20.4%) for males and 6:30 AM to 6:59 AM (196, 24.5%) for females.
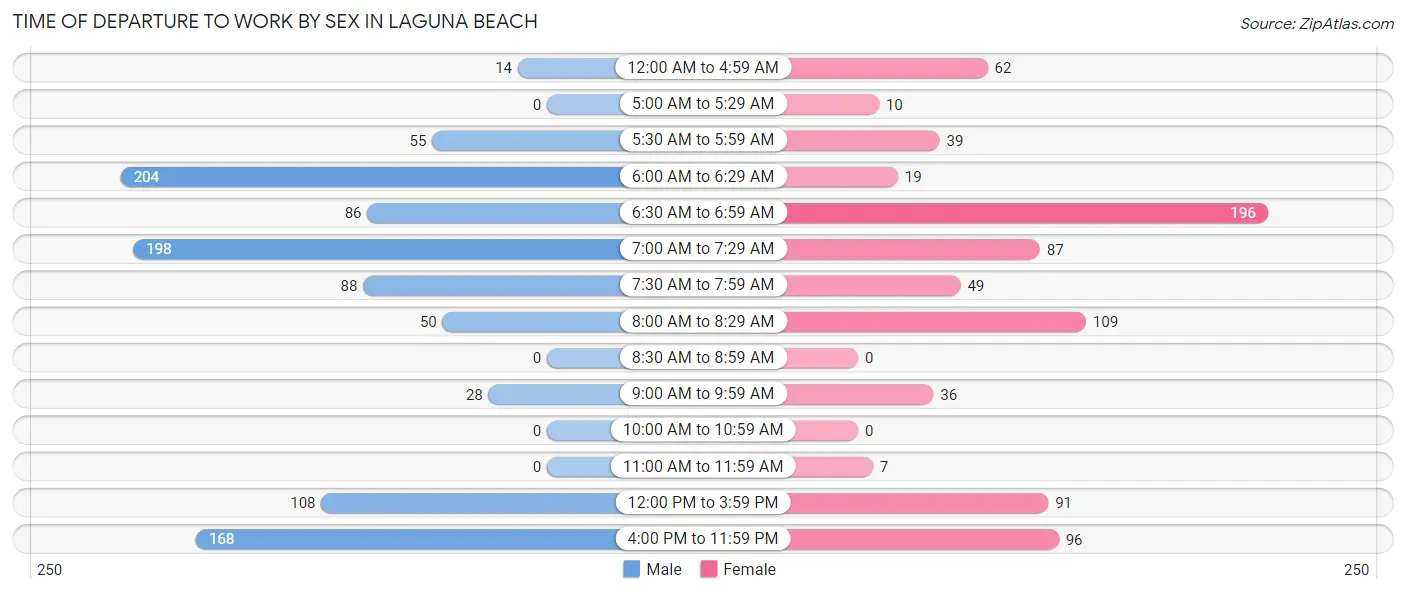
| Time of Departure | Male | Female |
| 12:00 AM to 4:59 AM | 14 (1.4%) | 62 (7.7%) |
| 5:00 AM to 5:29 AM | 0 (0.0%) | 10 (1.3%) |
| 5:30 AM to 5:59 AM | 55 (5.5%) | 39 (4.9%) |
| 6:00 AM to 6:29 AM | 204 (20.4%) | 19 (2.4%) |
| 6:30 AM to 6:59 AM | 86 (8.6%) | 196 (24.5%) |
| 7:00 AM to 7:29 AM | 198 (19.8%) | 87 (10.9%) |
| 7:30 AM to 7:59 AM | 88 (8.8%) | 49 (6.1%) |
| 8:00 AM to 8:29 AM | 50 (5.0%) | 109 (13.6%) |
| 8:30 AM to 8:59 AM | 0 (0.0%) | 0 (0.0%) |
| 9:00 AM to 9:59 AM | 28 (2.8%) | 36 (4.5%) |
| 10:00 AM to 10:59 AM | 0 (0.0%) | 0 (0.0%) |
| 11:00 AM to 11:59 AM | 0 (0.0%) | 7 (0.9%) |
| 12:00 PM to 3:59 PM | 108 (10.8%) | 91 (11.4%) |
| 4:00 PM to 11:59 PM | 168 (16.8%) | 96 (12.0%) |
| Total | 999 (100.0%) | 801 (100.0%) |
Housing Occupancy in Laguna Beach
Occupancy by Ownership in Laguna Beach
Of the total 2,359 dwellings in Laguna Beach, owner-occupied units account for 1,710 (72.5%), while renter-occupied units make up 649 (27.5%).
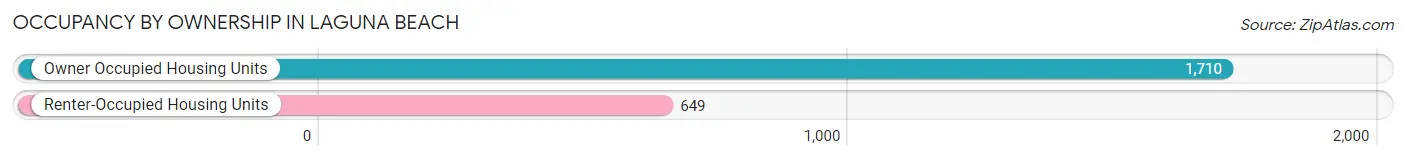
| Occupancy | # Housing Units | % Housing Units |
| Owner Occupied Housing Units | 1,710 | 72.5% |
| Renter-Occupied Housing Units | 649 | 27.5% |
| Total Occupied Housing Units | 2,359 | 100.0% |
Occupancy by Household Size in Laguna Beach
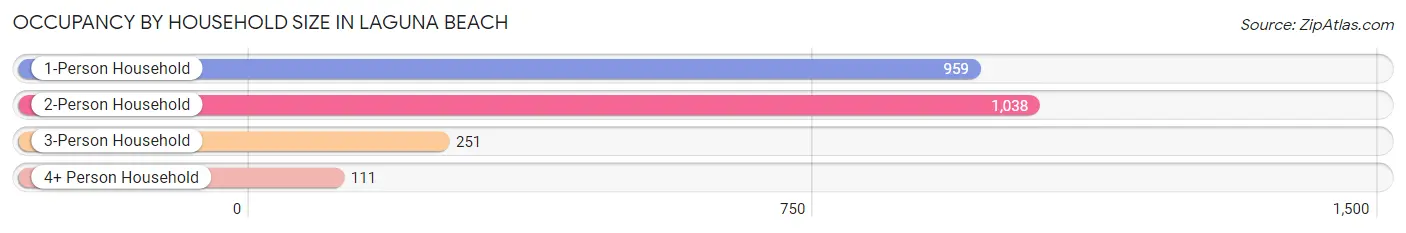
| Household Size | # Housing Units | % Housing Units |
| 1-Person Household | 959 | 40.6% |
| 2-Person Household | 1,038 | 44.0% |
| 3-Person Household | 251 | 10.6% |
| 4+ Person Household | 111 | 4.7% |
| Total Housing Units | 2,359 | 100.0% |
Occupancy by Ownership by Household Size in Laguna Beach
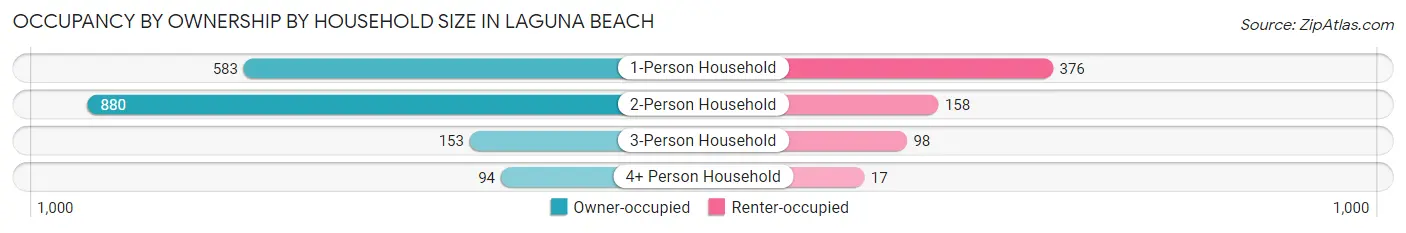
| Household Size | Owner-occupied | Renter-occupied |
| 1-Person Household | 583 (60.8%) | 376 (39.2%) |
| 2-Person Household | 880 (84.8%) | 158 (15.2%) |
| 3-Person Household | 153 (61.0%) | 98 (39.0%) |
| 4+ Person Household | 94 (84.7%) | 17 (15.3%) |
| Total Housing Units | 1,710 (72.5%) | 649 (27.5%) |
Occupancy by Educational Attainment in Laguna Beach
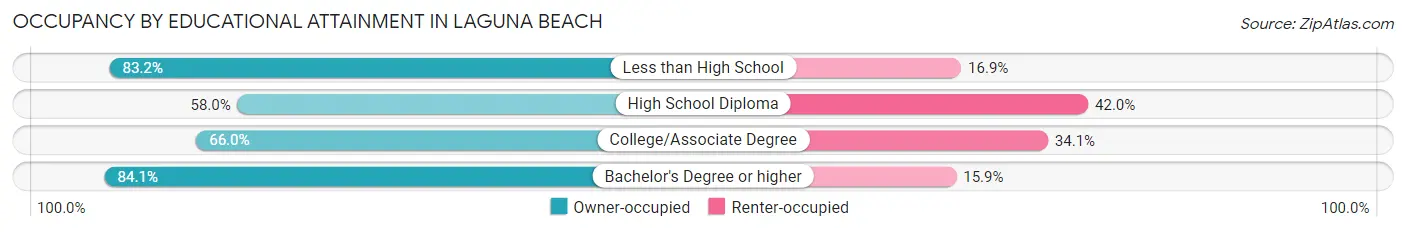
| Household Size | Owner-occupied | Renter-occupied |
| Less than High School | 74 (83.2%) | 15 (16.9%) |
| High School Diploma | 305 (58.0%) | 221 (42.0%) |
| College/Associate Degree | 494 (65.9%) | 255 (34.1%) |
| Bachelor's Degree or higher | 837 (84.1%) | 158 (15.9%) |
Occupancy by Age of Householder in Laguna Beach
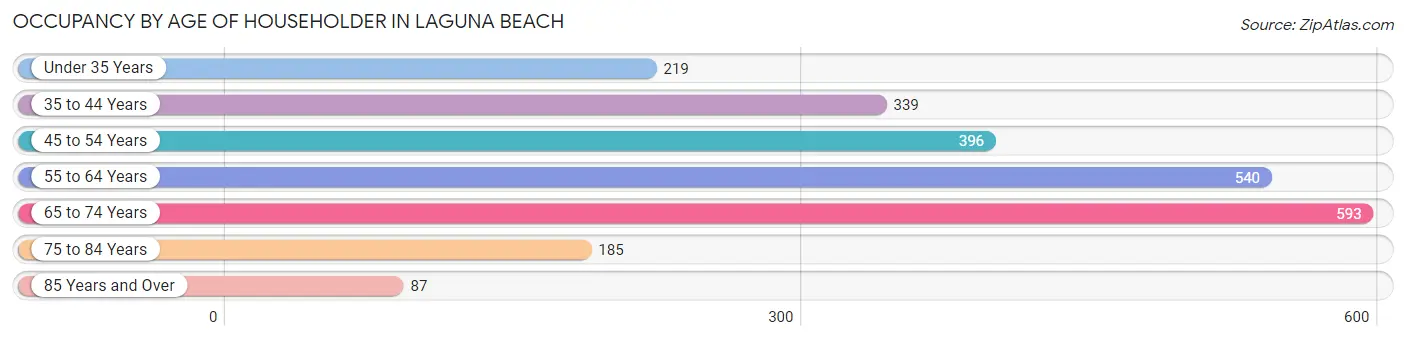
| Age Bracket | # Households | % Households |
| Under 35 Years | 219 | 9.3% |
| 35 to 44 Years | 339 | 14.4% |
| 45 to 54 Years | 396 | 16.8% |
| 55 to 64 Years | 540 | 22.9% |
| 65 to 74 Years | 593 | 25.1% |
| 75 to 84 Years | 185 | 7.8% |
| 85 Years and Over | 87 | 3.7% |
| Total | 2,359 | 100.0% |
Housing Finances in Laguna Beach
Median Income by Occupancy in Laguna Beach
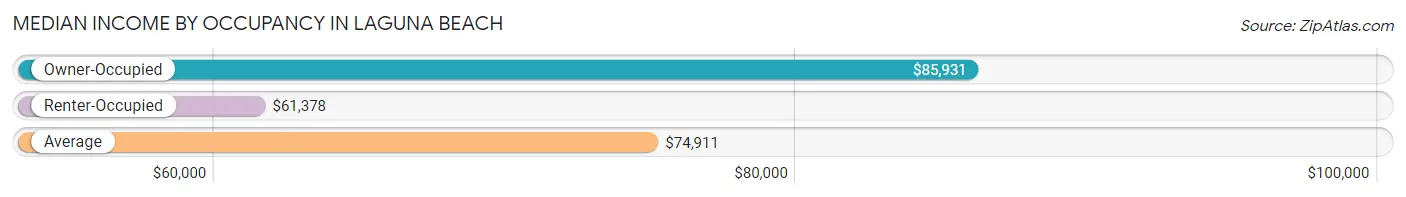
| Occupancy Type | # Households | Median Income |
| Owner-Occupied | 1,710 (72.5%) | $85,931 |
| Renter-Occupied | 649 (27.5%) | $61,378 |
| Average | 2,359 (100.0%) | $74,911 |
Occupancy by Householder Income Bracket in Laguna Beach
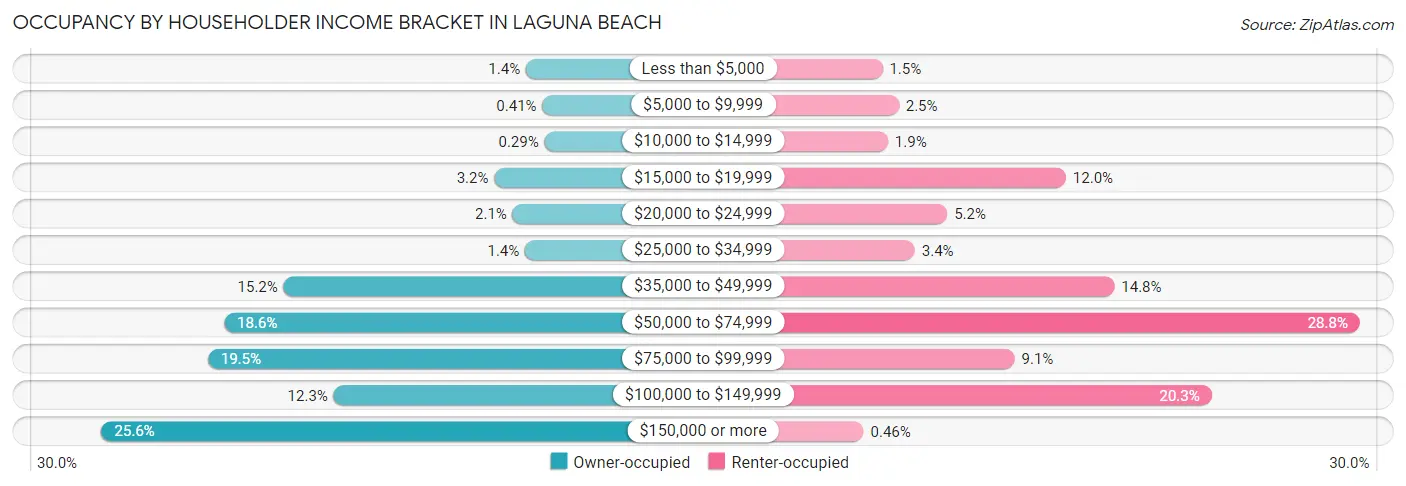
| Income Bracket | Owner-occupied | Renter-occupied |
| Less than $5,000 | 23 (1.3%) | 10 (1.5%) |
| $5,000 to $9,999 | 7 (0.4%) | 16 (2.5%) |
| $10,000 to $14,999 | 5 (0.3%) | 12 (1.8%) |
| $15,000 to $19,999 | 54 (3.2%) | 78 (12.0%) |
| $20,000 to $24,999 | 36 (2.1%) | 34 (5.2%) |
| $25,000 to $34,999 | 24 (1.4%) | 22 (3.4%) |
| $35,000 to $49,999 | 260 (15.2%) | 96 (14.8%) |
| $50,000 to $74,999 | 318 (18.6%) | 187 (28.8%) |
| $75,000 to $99,999 | 334 (19.5%) | 59 (9.1%) |
| $100,000 to $149,999 | 211 (12.3%) | 132 (20.3%) |
| $150,000 or more | 438 (25.6%) | 3 (0.5%) |
| Total | 1,710 (100.0%) | 649 (100.0%) |
Monthly Housing Cost Tiers in Laguna Beach
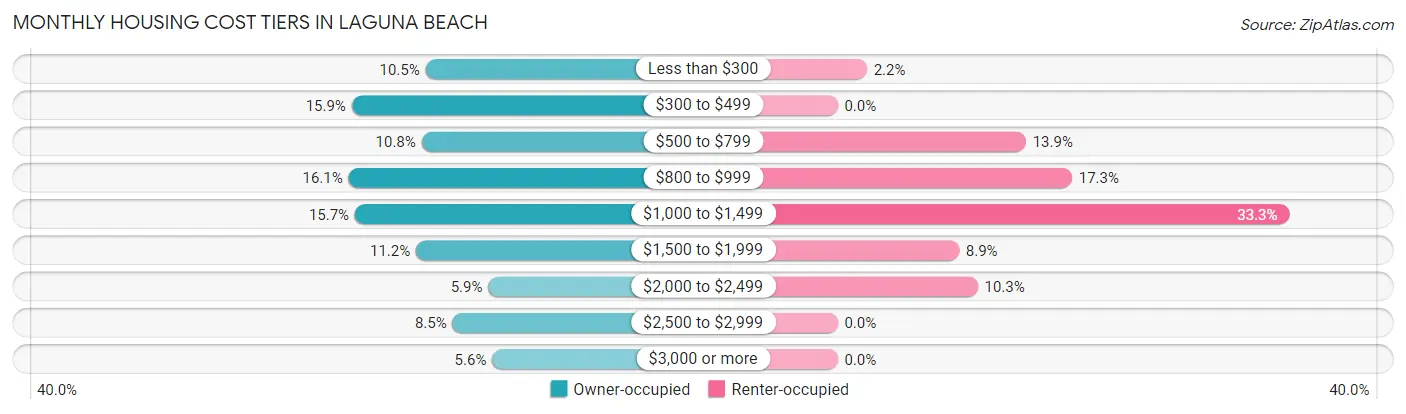
| Monthly Cost | Owner-occupied | Renter-occupied |
| Less than $300 | 179 (10.5%) | 14 (2.2%) |
| $300 to $499 | 272 (15.9%) | 0 (0.0%) |
| $500 to $799 | 184 (10.8%) | 90 (13.9%) |
| $800 to $999 | 276 (16.1%) | 112 (17.3%) |
| $1,000 to $1,499 | 268 (15.7%) | 216 (33.3%) |
| $1,500 to $1,999 | 191 (11.2%) | 58 (8.9%) |
| $2,000 to $2,499 | 100 (5.9%) | 67 (10.3%) |
| $2,500 to $2,999 | 145 (8.5%) | 0 (0.0%) |
| $3,000 or more | 95 (5.6%) | 0 (0.0%) |
| Total | 1,710 (100.0%) | 649 (100.0%) |
Physical Housing Characteristics in Laguna Beach
Housing Structures in Laguna Beach
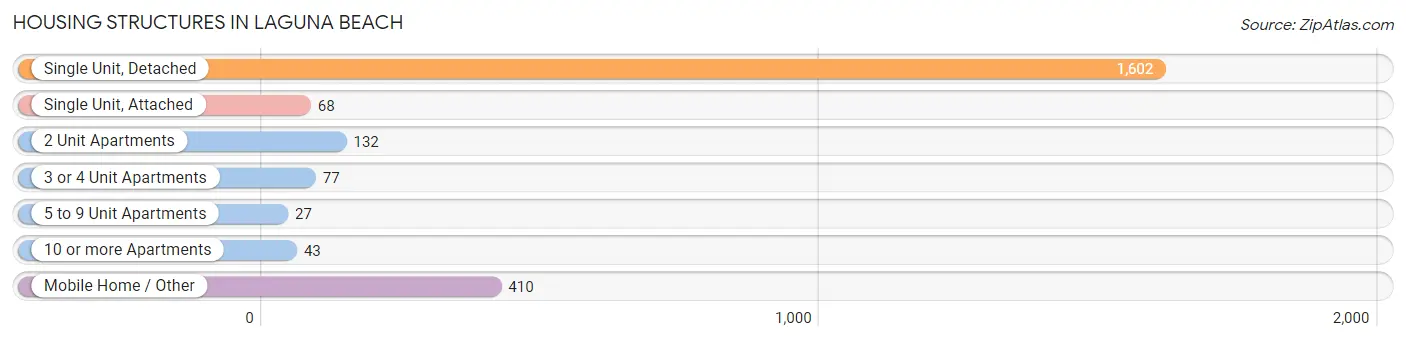
| Structure Type | # Housing Units | % Housing Units |
| Single Unit, Detached | 1,602 | 67.9% |
| Single Unit, Attached | 68 | 2.9% |
| 2 Unit Apartments | 132 | 5.6% |
| 3 or 4 Unit Apartments | 77 | 3.3% |
| 5 to 9 Unit Apartments | 27 | 1.1% |
| 10 or more Apartments | 43 | 1.8% |
| Mobile Home / Other | 410 | 17.4% |
| Total | 2,359 | 100.0% |
Housing Structures by Occupancy in Laguna Beach
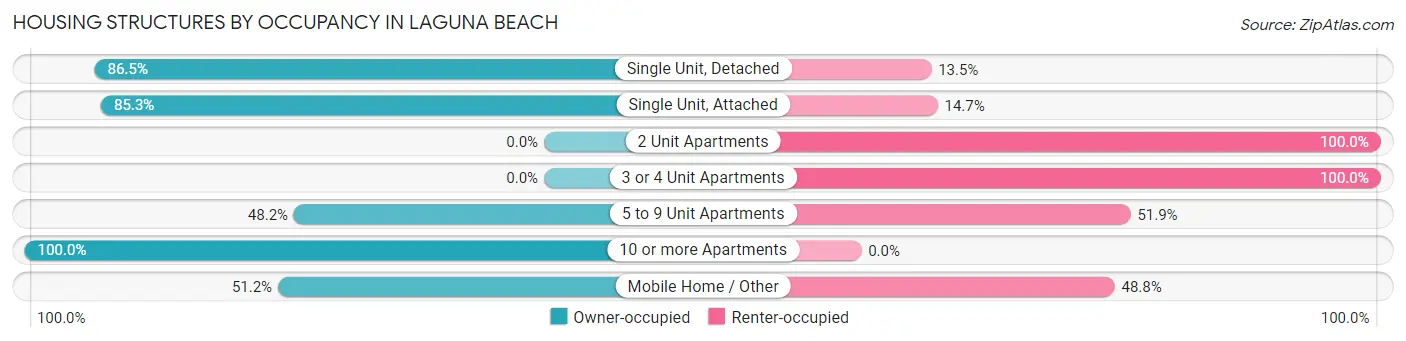
| Structure Type | Owner-occupied | Renter-occupied |
| Single Unit, Detached | 1,386 (86.5%) | 216 (13.5%) |
| Single Unit, Attached | 58 (85.3%) | 10 (14.7%) |
| 2 Unit Apartments | 0 (0.0%) | 132 (100.0%) |
| 3 or 4 Unit Apartments | 0 (0.0%) | 77 (100.0%) |
| 5 to 9 Unit Apartments | 13 (48.1%) | 14 (51.8%) |
| 10 or more Apartments | 43 (100.0%) | 0 (0.0%) |
| Mobile Home / Other | 210 (51.2%) | 200 (48.8%) |
| Total | 1,710 (72.5%) | 649 (27.5%) |
Housing Structures by Number of Rooms in Laguna Beach
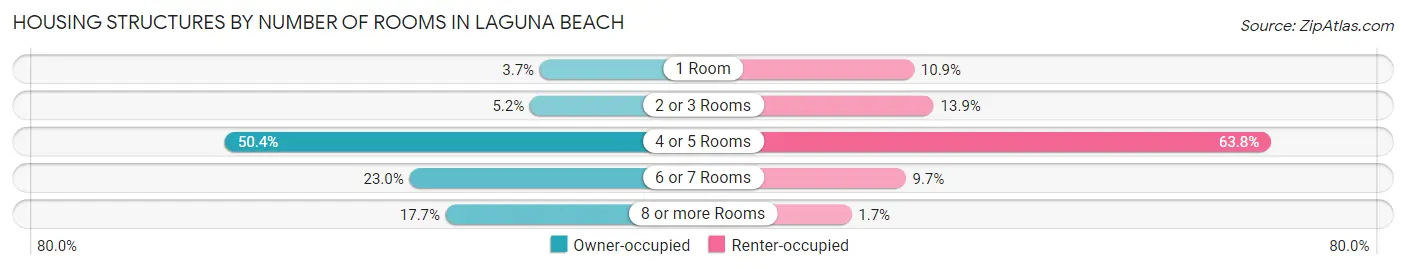
| Number of Rooms | Owner-occupied | Renter-occupied |
| 1 Room | 64 (3.7%) | 71 (10.9%) |
| 2 or 3 Rooms | 89 (5.2%) | 90 (13.9%) |
| 4 or 5 Rooms | 861 (50.3%) | 414 (63.8%) |
| 6 or 7 Rooms | 394 (23.0%) | 63 (9.7%) |
| 8 or more Rooms | 302 (17.7%) | 11 (1.7%) |
| Total | 1,710 (100.0%) | 649 (100.0%) |
Housing Structure by Heating Type in Laguna Beach
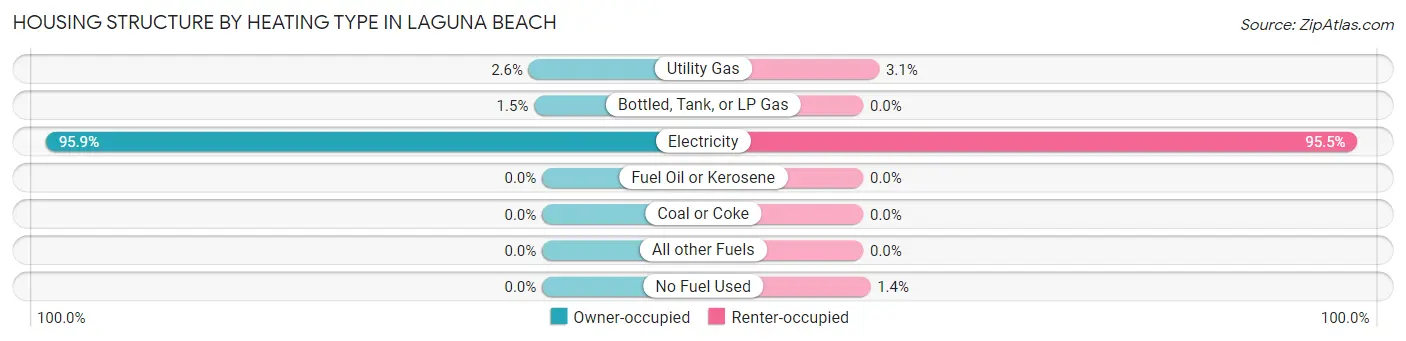
| Heating Type | Owner-occupied | Renter-occupied |
| Utility Gas | 44 (2.6%) | 20 (3.1%) |
| Bottled, Tank, or LP Gas | 26 (1.5%) | 0 (0.0%) |
| Electricity | 1,640 (95.9%) | 620 (95.5%) |
| Fuel Oil or Kerosene | 0 (0.0%) | 0 (0.0%) |
| Coal or Coke | 0 (0.0%) | 0 (0.0%) |
| All other Fuels | 0 (0.0%) | 0 (0.0%) |
| No Fuel Used | 0 (0.0%) | 9 (1.4%) |
| Total | 1,710 (100.0%) | 649 (100.0%) |
Household Vehicle Usage in Laguna Beach
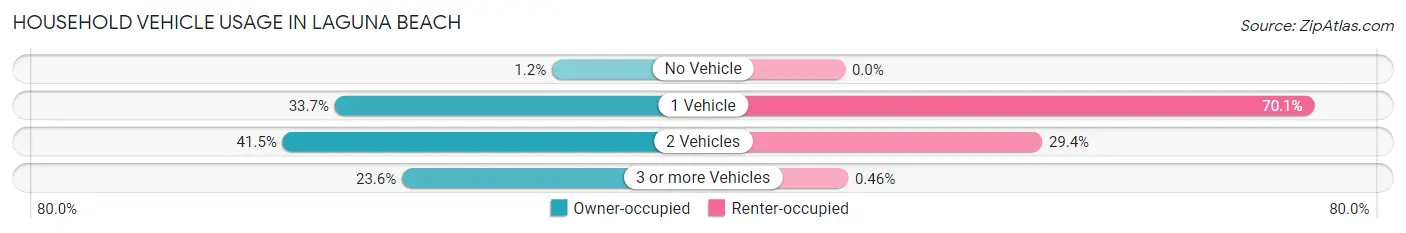
| Vehicles per Household | Owner-occupied | Renter-occupied |
| No Vehicle | 21 (1.2%) | 0 (0.0%) |
| 1 Vehicle | 576 (33.7%) | 455 (70.1%) |
| 2 Vehicles | 709 (41.5%) | 191 (29.4%) |
| 3 or more Vehicles | 404 (23.6%) | 3 (0.5%) |
| Total | 1,710 (100.0%) | 649 (100.0%) |
Real Estate & Mortgages in Laguna Beach
Real Estate and Mortgage Overview in Laguna Beach
| Characteristic | Without Mortgage | With Mortgage |
| Housing Units | 824 | 886 |
| Median Property Value | $353,300 | $301,400 |
| Median Household Income | $72,188 | $273 |
| Monthly Housing Costs | $543 | $44 |
| Real Estate Taxes | $1,642 | $18 |
Property Value by Mortgage Status in Laguna Beach
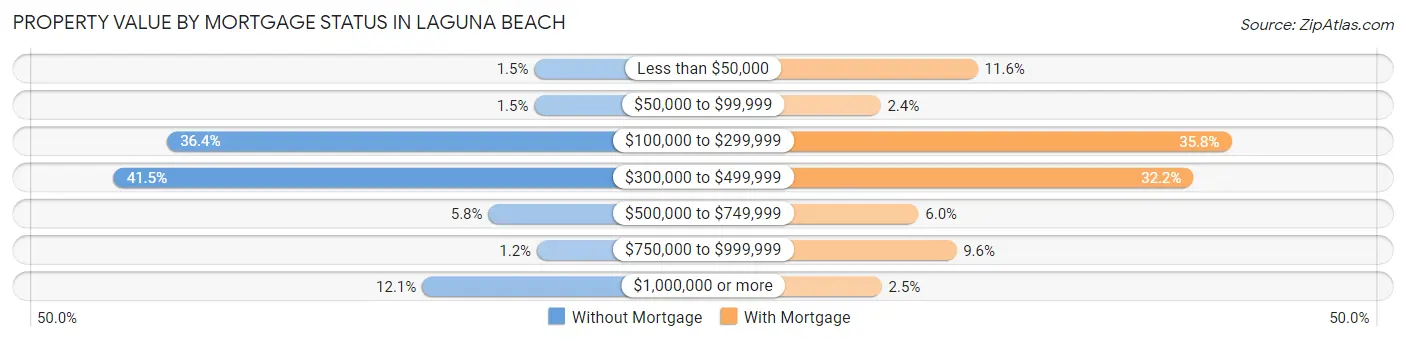
| Property Value | Without Mortgage | With Mortgage |
| Less than $50,000 | 12 (1.5%) | 103 (11.6%) |
| $50,000 to $99,999 | 12 (1.5%) | 21 (2.4%) |
| $100,000 to $299,999 | 300 (36.4%) | 317 (35.8%) |
| $300,000 to $499,999 | 342 (41.5%) | 285 (32.2%) |
| $500,000 to $749,999 | 48 (5.8%) | 53 (6.0%) |
| $750,000 to $999,999 | 10 (1.2%) | 85 (9.6%) |
| $1,000,000 or more | 100 (12.1%) | 22 (2.5%) |
| Total | 824 (100.0%) | 886 (100.0%) |
Household Income by Mortgage Status in Laguna Beach
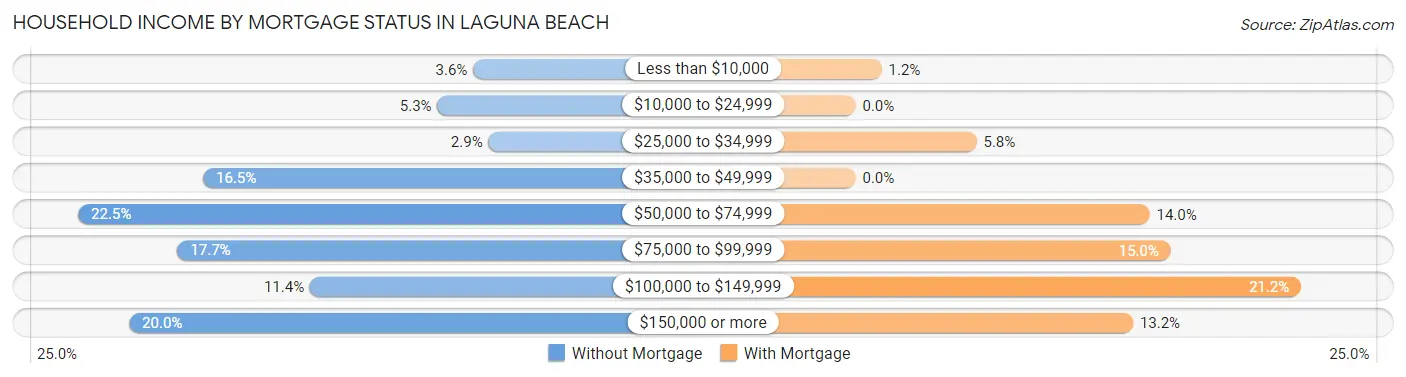
| Household Income | Without Mortgage | With Mortgage |
| Less than $10,000 | 30 (3.6%) | 11 (1.2%) |
| $10,000 to $24,999 | 44 (5.3%) | 0 (0.0%) |
| $25,000 to $34,999 | 24 (2.9%) | 51 (5.8%) |
| $35,000 to $49,999 | 136 (16.5%) | 0 (0.0%) |
| $50,000 to $74,999 | 185 (22.5%) | 124 (14.0%) |
| $75,000 to $99,999 | 146 (17.7%) | 133 (15.0%) |
| $100,000 to $149,999 | 94 (11.4%) | 188 (21.2%) |
| $150,000 or more | 165 (20.0%) | 117 (13.2%) |
| Total | 824 (100.0%) | 886 (100.0%) |
Property Value to Household Income Ratio in Laguna Beach
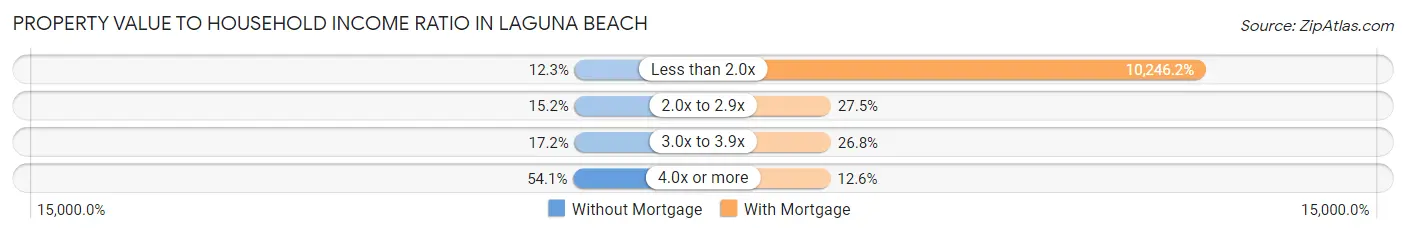
| Value-to-Income Ratio | Without Mortgage | With Mortgage |
| Less than 2.0x | 101 (12.3%) | 90,781 (10,246.2%) |
| 2.0x to 2.9x | 125 (15.2%) | 244 (27.5%) |
| 3.0x to 3.9x | 142 (17.2%) | 237 (26.8%) |
| 4.0x or more | 446 (54.1%) | 112 (12.6%) |
| Total | 824 (100.0%) | 886 (100.0%) |
Real Estate Taxes by Mortgage Status in Laguna Beach
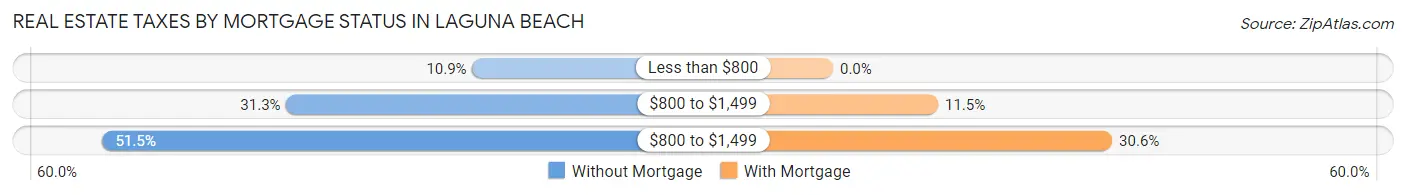
| Property Taxes | Without Mortgage | With Mortgage |
| Less than $800 | 90 (10.9%) | 0 (0.0%) |
| $800 to $1,499 | 258 (31.3%) | 102 (11.5%) |
| $800 to $1,499 | 424 (51.5%) | 271 (30.6%) |
| Total | 824 (100.0%) | 886 (100.0%) |
Health & Disability in Laguna Beach
Health Insurance Coverage by Age in Laguna Beach
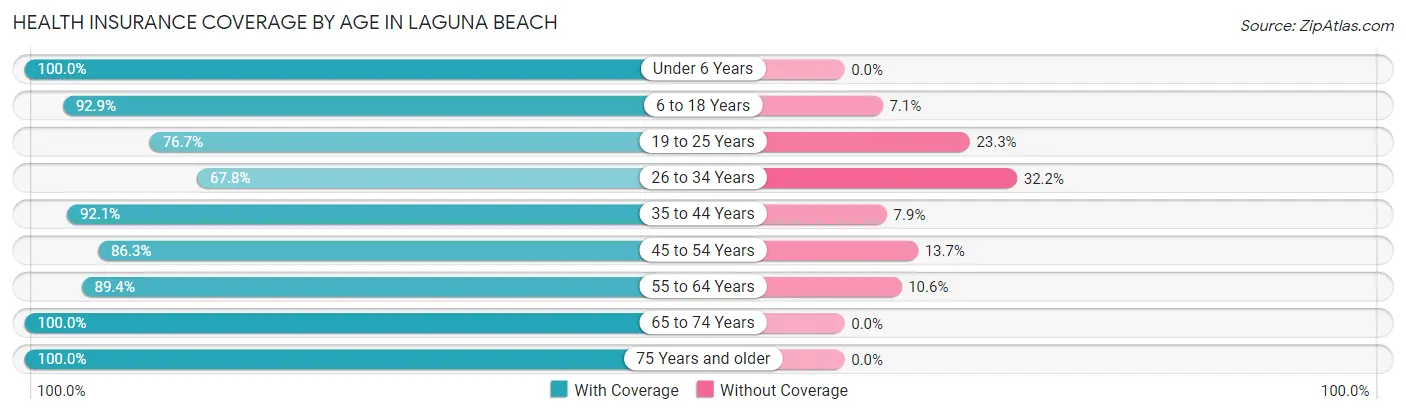
| Age Bracket | With Coverage | Without Coverage |
| Under 6 Years | 19 (100.0%) | 0 (0.0%) |
| 6 to 18 Years | 261 (92.9%) | 20 (7.1%) |
| 19 to 25 Years | 220 (76.7%) | 67 (23.3%) |
| 26 to 34 Years | 156 (67.8%) | 74 (32.2%) |
| 35 to 44 Years | 513 (92.1%) | 44 (7.9%) |
| 45 to 54 Years | 479 (86.3%) | 76 (13.7%) |
| 55 to 64 Years | 892 (89.4%) | 106 (10.6%) |
| 65 to 74 Years | 847 (100.0%) | 0 (0.0%) |
| 75 Years and older | 420 (100.0%) | 0 (0.0%) |
| Total | 3,807 (90.8%) | 387 (9.2%) |
Health Insurance Coverage by Citizenship Status in Laguna Beach
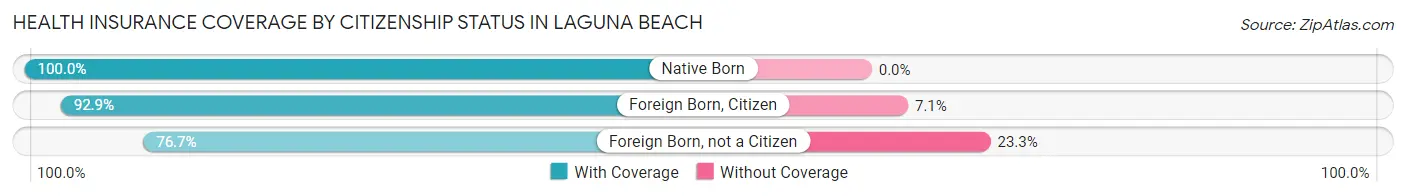
| Citizenship Status | With Coverage | Without Coverage |
| Native Born | 19 (100.0%) | 0 (0.0%) |
| Foreign Born, Citizen | 261 (92.9%) | 20 (7.1%) |
| Foreign Born, not a Citizen | 220 (76.7%) | 67 (23.3%) |
Health Insurance Coverage by Household Income in Laguna Beach
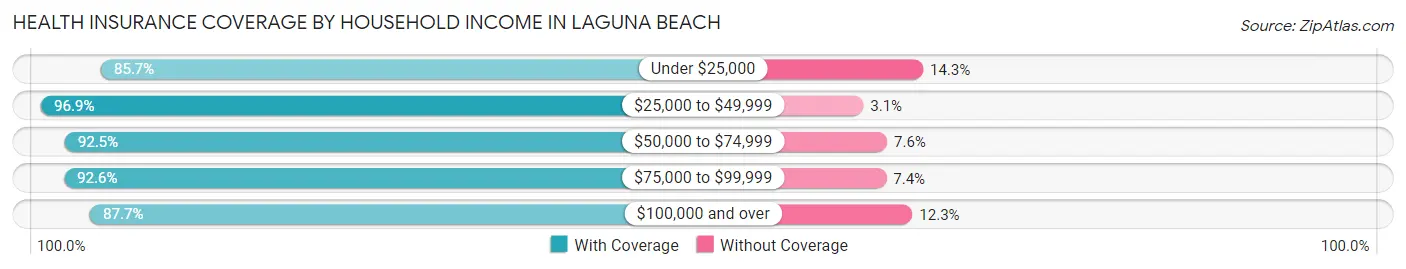
| Household Income | With Coverage | Without Coverage |
| Under $25,000 | 282 (85.7%) | 47 (14.3%) |
| $25,000 to $49,999 | 531 (96.9%) | 17 (3.1%) |
| $50,000 to $74,999 | 869 (92.4%) | 71 (7.5%) |
| $75,000 to $99,999 | 762 (92.6%) | 61 (7.4%) |
| $100,000 and over | 1,363 (87.7%) | 191 (12.3%) |
Public vs Private Health Insurance Coverage by Age in Laguna Beach
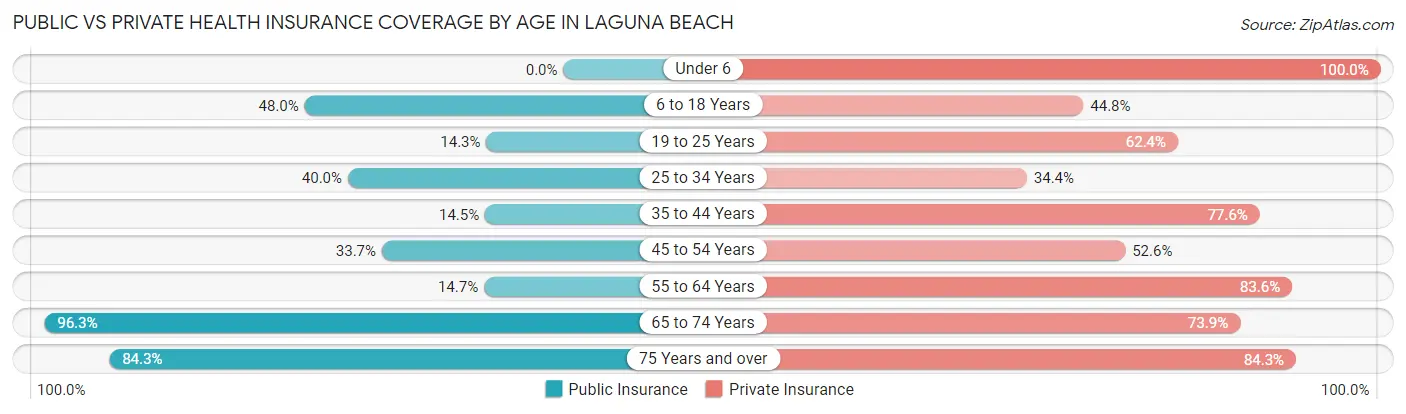
| Age Bracket | Public Insurance | Private Insurance |
| Under 6 | 0 (0.0%) | 19 (100.0%) |
| 6 to 18 Years | 135 (48.0%) | 126 (44.8%) |
| 19 to 25 Years | 41 (14.3%) | 179 (62.4%) |
| 25 to 34 Years | 92 (40.0%) | 79 (34.4%) |
| 35 to 44 Years | 81 (14.5%) | 432 (77.6%) |
| 45 to 54 Years | 187 (33.7%) | 292 (52.6%) |
| 55 to 64 Years | 147 (14.7%) | 834 (83.6%) |
| 65 to 74 Years | 816 (96.3%) | 626 (73.9%) |
| 75 Years and over | 354 (84.3%) | 354 (84.3%) |
| Total | 1,853 (44.2%) | 2,941 (70.1%) |
Disability Status by Sex by Age in Laguna Beach
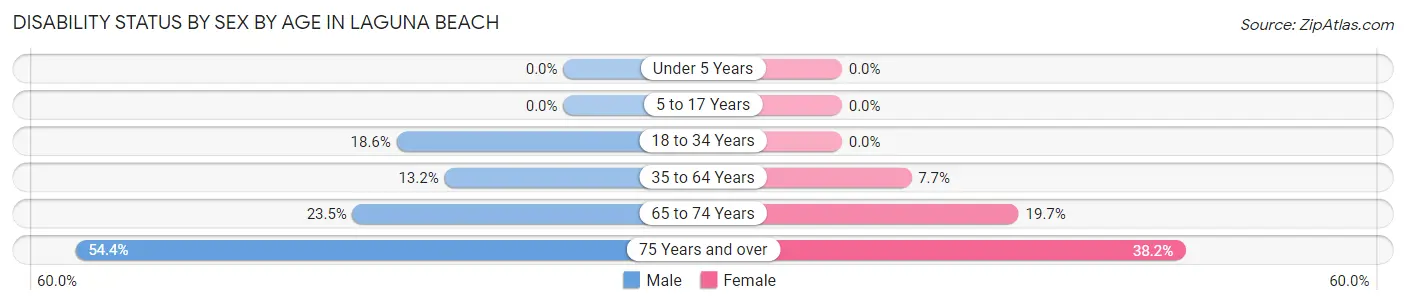
| Age Bracket | Male | Female |
| Under 5 Years | 0 (0.0%) | 0 (0.0%) |
| 5 to 17 Years | 0 (0.0%) | 0 (0.0%) |
| 18 to 34 Years | 83 (18.6%) | 0 (0.0%) |
| 35 to 64 Years | 127 (13.2%) | 89 (7.7%) |
| 65 to 74 Years | 107 (23.5%) | 77 (19.7%) |
| 75 Years and over | 106 (54.4%) | 86 (38.2%) |
Disability Class by Sex by Age in Laguna Beach
Disability Class: Hearing Difficulty
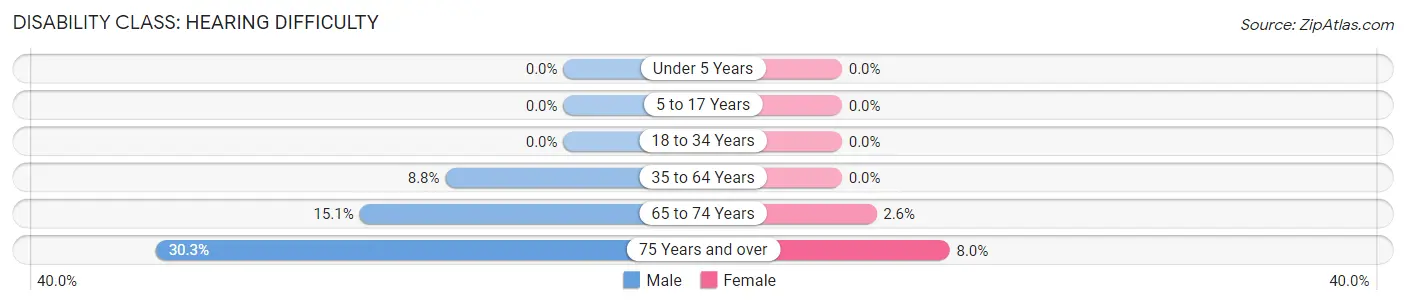
| Age Bracket | Male | Female |
| Under 5 Years | 0 (0.0%) | 0 (0.0%) |
| 5 to 17 Years | 0 (0.0%) | 0 (0.0%) |
| 18 to 34 Years | 0 (0.0%) | 0 (0.0%) |
| 35 to 64 Years | 84 (8.8%) | 0 (0.0%) |
| 65 to 74 Years | 69 (15.1%) | 10 (2.6%) |
| 75 Years and over | 59 (30.3%) | 18 (8.0%) |
Disability Class: Vision Difficulty
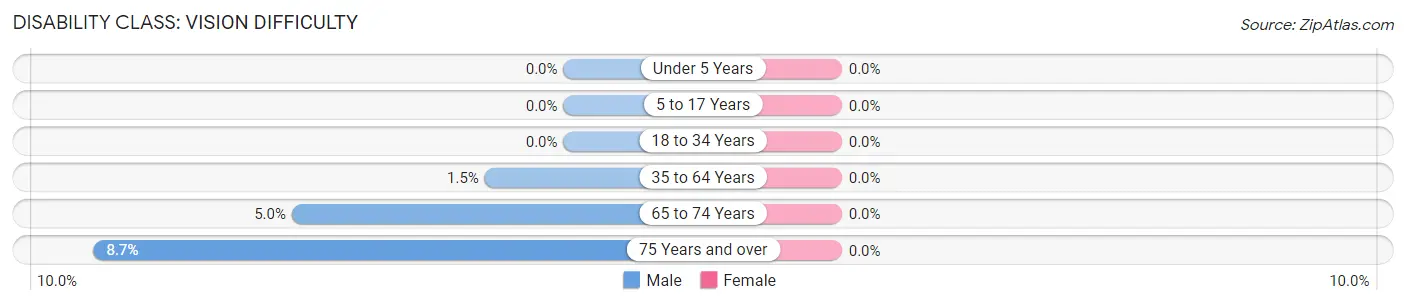
| Age Bracket | Male | Female |
| Under 5 Years | 0 (0.0%) | 0 (0.0%) |
| 5 to 17 Years | 0 (0.0%) | 0 (0.0%) |
| 18 to 34 Years | 0 (0.0%) | 0 (0.0%) |
| 35 to 64 Years | 14 (1.5%) | 0 (0.0%) |
| 65 to 74 Years | 23 (5.0%) | 0 (0.0%) |
| 75 Years and over | 17 (8.7%) | 0 (0.0%) |
Disability Class: Cognitive Difficulty
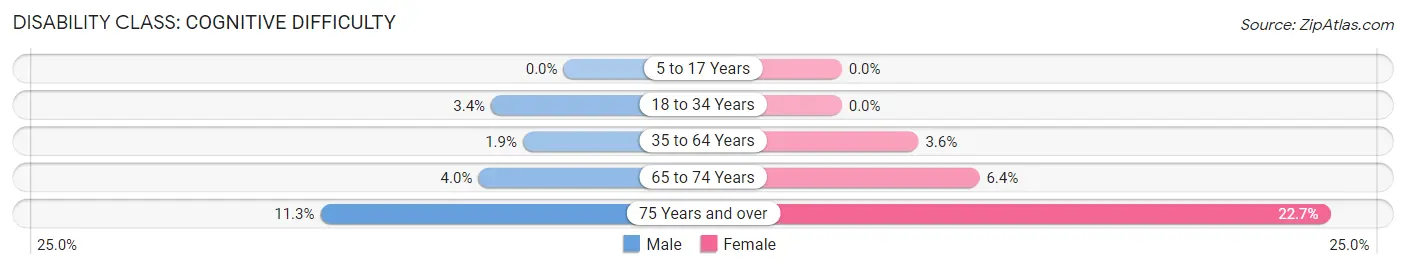
| Age Bracket | Male | Female |
| 5 to 17 Years | 0 (0.0%) | 0 (0.0%) |
| 18 to 34 Years | 15 (3.4%) | 0 (0.0%) |
| 35 to 64 Years | 18 (1.9%) | 41 (3.6%) |
| 65 to 74 Years | 18 (4.0%) | 25 (6.4%) |
| 75 Years and over | 22 (11.3%) | 51 (22.7%) |
Disability Class: Ambulatory Difficulty
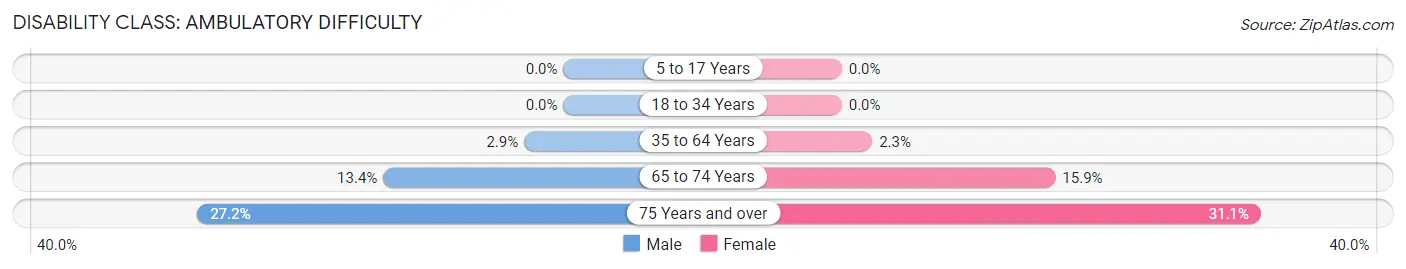
| Age Bracket | Male | Female |
| 5 to 17 Years | 0 (0.0%) | 0 (0.0%) |
| 18 to 34 Years | 0 (0.0%) | 0 (0.0%) |
| 35 to 64 Years | 28 (2.9%) | 26 (2.3%) |
| 65 to 74 Years | 61 (13.4%) | 62 (15.9%) |
| 75 Years and over | 53 (27.2%) | 70 (31.1%) |
Disability Class: Self-Care Difficulty
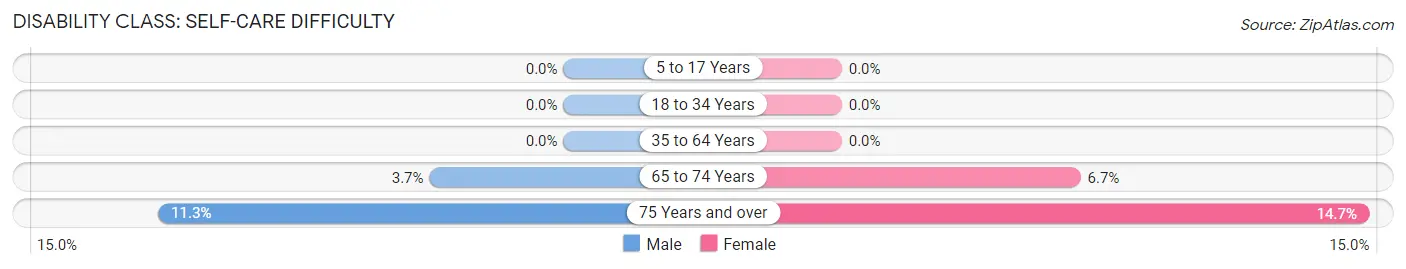
| Age Bracket | Male | Female |
| 5 to 17 Years | 0 (0.0%) | 0 (0.0%) |
| 18 to 34 Years | 0 (0.0%) | 0 (0.0%) |
| 35 to 64 Years | 0 (0.0%) | 0 (0.0%) |
| 65 to 74 Years | 17 (3.7%) | 26 (6.7%) |
| 75 Years and over | 22 (11.3%) | 33 (14.7%) |
Technology Access in Laguna Beach
Computing Device Access in Laguna Beach
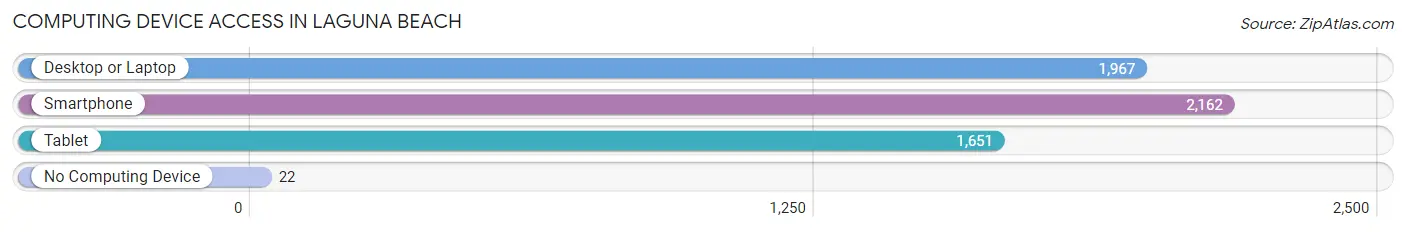
| Device Type | # Households | % Households |
| Desktop or Laptop | 1,967 | 83.4% |
| Smartphone | 2,162 | 91.6% |
| Tablet | 1,651 | 70.0% |
| No Computing Device | 22 | 0.9% |
| Total | 2,359 | 100.0% |
Internet Access in Laguna Beach
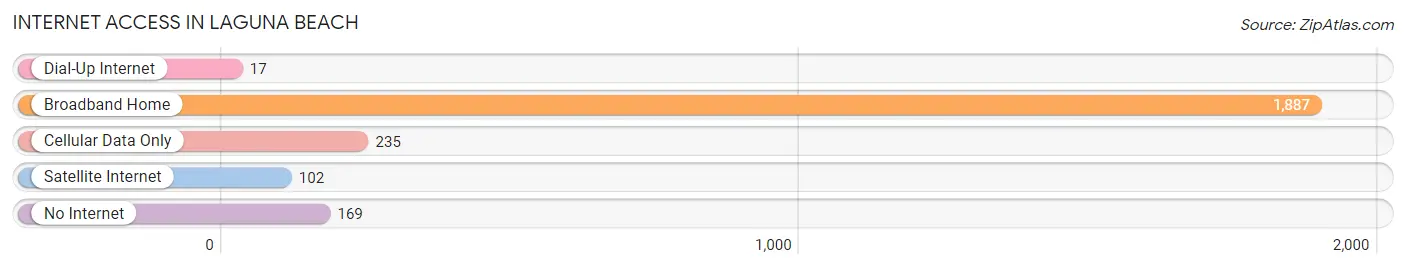
| Internet Type | # Households | % Households |
| Dial-Up Internet | 17 | 0.7% |
| Broadband Home | 1,887 | 80.0% |
| Cellular Data Only | 235 | 10.0% |
| Satellite Internet | 102 | 4.3% |
| No Internet | 169 | 7.2% |
| Total | 2,359 | 100.0% |
Laguna Beach Summary
Laguna Beach is a small coastal city located in Orange County, California. It is situated on the Pacific Ocean, about halfway between Los Angeles and San Diego. The city is known for its beautiful beaches, stunning views, and vibrant art scene. Laguna Beach is a popular tourist destination, attracting visitors from all over the world.
Geography
Laguna Beach is located on the Pacific Coast of California, about halfway between Los Angeles and San Diego. The city is situated on a 7-mile stretch of coastline, with the Pacific Ocean to the west and the Santa Ana Mountains to the east. The city is bordered by the cities of Dana Point to the north and San Clemente to the south. The city covers an area of 8.4 square miles, with a population of 22,723 as of the 2010 census.
The city is known for its beautiful beaches, which are popular for swimming, surfing, and other water activities. The most popular beaches in Laguna Beach are Main Beach, Thousand Steps Beach, and Aliso Beach. The city also has several parks, including Heisler Park, which offers stunning views of the ocean, and Laguna Coast Wilderness Park, which is home to a variety of wildlife.
Climate
Laguna Beach has a Mediterranean climate, with mild temperatures year-round. The average high temperature in the summer is around 75°F, while the average low temperature in the winter is around 55°F. The city receives an average of 13 inches of rain per year, with most of the rain falling in the winter months.
History
The area that is now Laguna Beach was first inhabited by the Tongva people, who lived in the area for thousands of years before the arrival of Europeans. The first Europeans to settle in the area were Spanish missionaries, who arrived in the late 1700s. The area was later settled by American settlers in the mid-1800s.
In the late 1800s, the area began to attract artists and writers, who were drawn to the area’s natural beauty. In the early 1900s, the city was incorporated as a municipality, and the city’s first mayor was elected in 1906.
Economy
Laguna Beach is a popular tourist destination, and tourism is the city’s main source of income. The city is home to several art galleries, museums, and other attractions, which attract visitors from all over the world. The city is also home to several high-end resorts and hotels, which cater to tourists and business travelers.
The city is also home to several technology companies, including the software company Oracle, which has its headquarters in Laguna Beach. The city is also home to several retail stores, restaurants, and other businesses.
Demographics
As of the 2010 census, the population of Laguna Beach was 22,723. The population is predominantly white (83.3%), with smaller percentages of Hispanic (7.2%), Asian (4.2%), and African American (2.2%) residents. The median household income in the city is $90,845, and the median home value is $1,092,000. The city has a high rate of homeownership, with 73.3% of residents owning their homes.
Common Questions
What is Per Capita Income in Laguna Beach?
Per Capita income in Laguna Beach is $62,041.
What is the Median Family Income in Laguna Beach?
Median Family Income in Laguna Beach is $94,718.
What is the Median Household income in Laguna Beach?
Median Household Income in Laguna Beach is $74,911.
What is Income or Wage Gap in Laguna Beach?
Income or Wage Gap in Laguna Beach is 24.3%.
Women in Laguna Beach earn 75.7 cents for every dollar earned by a man.
What is Family Income Deficit in Laguna Beach?
Family Income Deficit in Laguna Beach is $5,903.
Families that are below poverty line in Laguna Beach earn $5,903 less on average than the poverty threshold level.
What is Inequality or Gini Index in Laguna Beach?
Inequality or Gini Index in Laguna Beach is 0.47.
What is the Total Population of Laguna Beach?
Total Population of Laguna Beach is 4,194.
What is the Total Male Population of Laguna Beach?
Total Male Population of Laguna Beach is 2,147.
What is the Total Female Population of Laguna Beach?
Total Female Population of Laguna Beach is 2,047.
What is the Ratio of Males per 100 Females in Laguna Beach?
There are 104.89 Males per 100 Females in Laguna Beach.
What is the Ratio of Females per 100 Males in Laguna Beach?
There are 95.34 Females per 100 Males in Laguna Beach.
What is the Median Population Age in Laguna Beach?
Median Population Age in Laguna Beach is 57.6 Years.
What is the Average Family Size in Laguna Beach
Average Family Size in Laguna Beach is 2.2 People.
What is the Average Household Size in Laguna Beach
Average Household Size in Laguna Beach is 1.8 People.
How Large is the Labor Force in Laguna Beach?
There are 2,194 People in the Labor Forcein in Laguna Beach.
What is the Percentage of People in the Labor Force in Laguna Beach?
55.5% of People are in the Labor Force in Laguna Beach.
What is the Unemployment Rate in Laguna Beach?
Unemployment Rate in Laguna Beach is 0.1%.