Belleair Shore, FL Map & Demographics
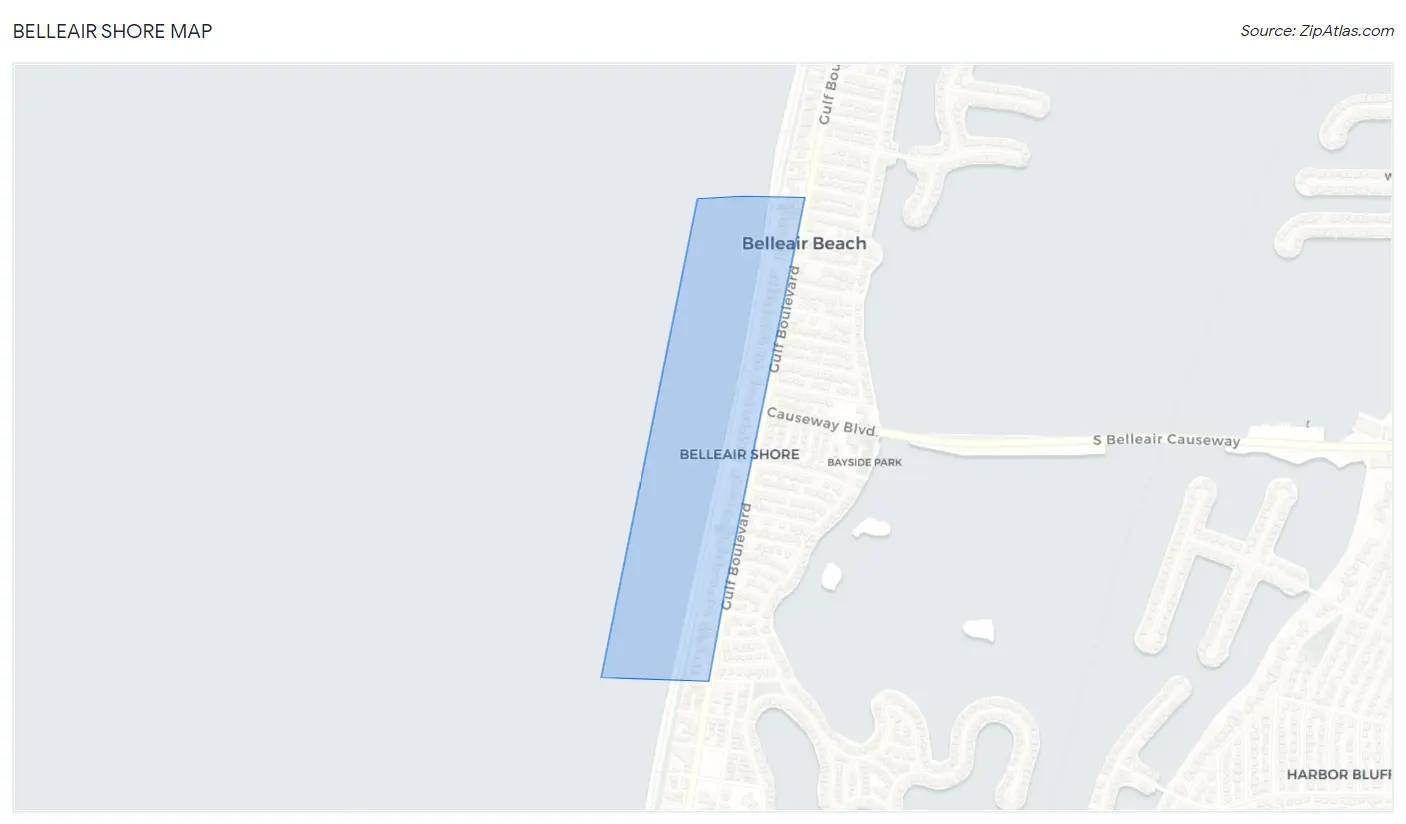
Belleair Shore Map
Belleair Shore Overview
$154,318
PER CAPITA INCOME
$178,750
AVG HOUSEHOLD INCOME
0.56
INEQUALITY / GINI INDEX
67
TOTAL POPULATION
35
MALE POPULATION
32
FEMALE POPULATION
109.38
MALES / 100 FEMALES
91.43
FEMALES / 100 MALES
59.8
MEDIAN AGE
2.4
AVG FAMILY SIZE
2.4
AVG HOUSEHOLD SIZE
29
LABOR FORCE [ PEOPLE ]
46.8%
PERCENT IN LABOR FORCE
Income in Belleair Shore
Income Overview in Belleair Shore
| Characteristic | Number | Measure |
| Per Capita Income | 67 | $154,318 |
| Median Family Income | 26 | $0 |
| Mean Family Income | 26 | $377,162 |
| Median Household Income | 28 | $178,750 |
| Mean Household Income | 28 | $365,636 |
| Income Deficit | 26 | $0 |
| Wage / Income Gap (%) | 67 | 0.00% |
| Wage / Income Gap ($) | 67 | 100.00¢ per $1 |
| Gini / Inequality Index | 67 | 0.56 |
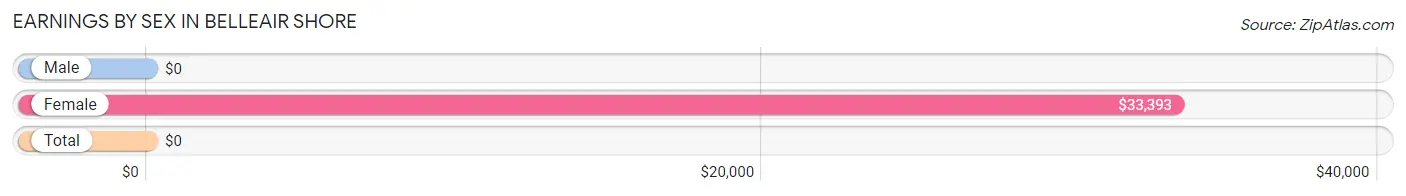
Earnings by Sex in Belleair Shore
| Sex | Number | Average Earnings |
| Male | 19 (67.9%) | $0 |
| Female | 9 (32.1%) | $33,393 |
| Total | 28 (100.0%) | $0 |
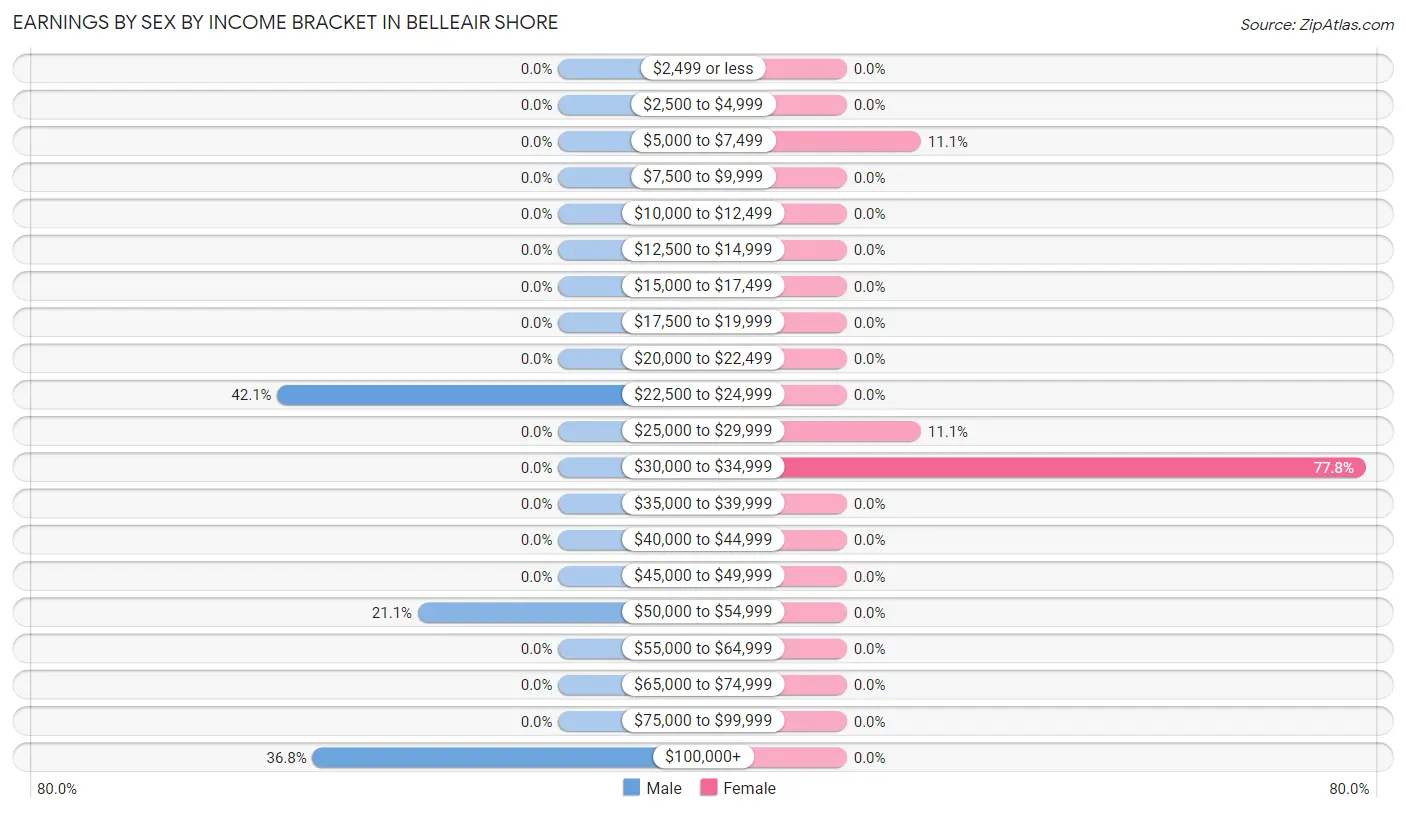
Earnings by Sex by Income Bracket in Belleair Shore
The most common earnings brackets in Belleair Shore are $22,500 to $24,999 for men (8 | 42.1%) and $30,000 to $34,999 for women (7 | 77.8%).
| Income | Male | Female |
| $2,499 or less | 0 (0.0%) | 0 (0.0%) |
| $2,500 to $4,999 | 0 (0.0%) | 0 (0.0%) |
| $5,000 to $7,499 | 0 (0.0%) | 1 (11.1%) |
| $7,500 to $9,999 | 0 (0.0%) | 0 (0.0%) |
| $10,000 to $12,499 | 0 (0.0%) | 0 (0.0%) |
| $12,500 to $14,999 | 0 (0.0%) | 0 (0.0%) |
| $15,000 to $17,499 | 0 (0.0%) | 0 (0.0%) |
| $17,500 to $19,999 | 0 (0.0%) | 0 (0.0%) |
| $20,000 to $22,499 | 0 (0.0%) | 0 (0.0%) |
| $22,500 to $24,999 | 8 (42.1%) | 0 (0.0%) |
| $25,000 to $29,999 | 0 (0.0%) | 1 (11.1%) |
| $30,000 to $34,999 | 0 (0.0%) | 7 (77.8%) |
| $35,000 to $39,999 | 0 (0.0%) | 0 (0.0%) |
| $40,000 to $44,999 | 0 (0.0%) | 0 (0.0%) |
| $45,000 to $49,999 | 0 (0.0%) | 0 (0.0%) |
| $50,000 to $54,999 | 4 (21.0%) | 0 (0.0%) |
| $55,000 to $64,999 | 0 (0.0%) | 0 (0.0%) |
| $65,000 to $74,999 | 0 (0.0%) | 0 (0.0%) |
| $75,000 to $99,999 | 0 (0.0%) | 0 (0.0%) |
| $100,000+ | 7 (36.8%) | 0 (0.0%) |
| Total | 19 (100.0%) | 9 (100.0%) |
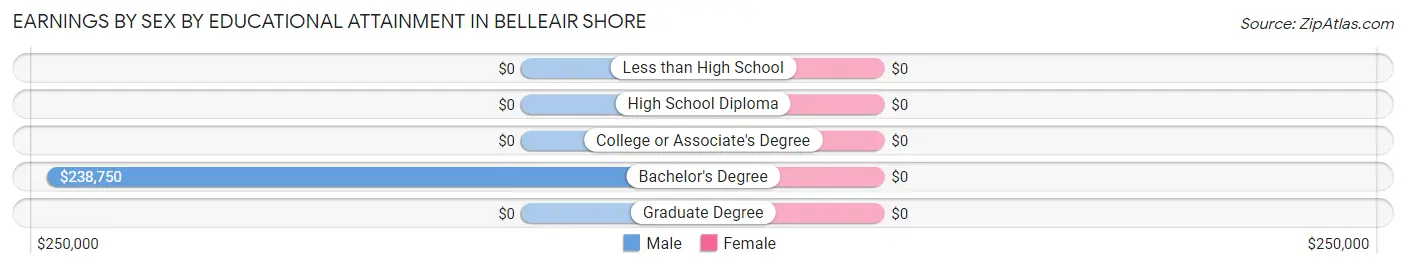
Earnings by Sex by Educational Attainment in Belleair Shore
| Educational Attainment | Male Income | Female Income |
| Less than High School | - | - |
| High School Diploma | - | - |
| College or Associate's Degree | - | - |
| Bachelor's Degree | $238,750 | $0 |
| Graduate Degree | - | - |
| Total | - | - |
Family Income in Belleair Shore
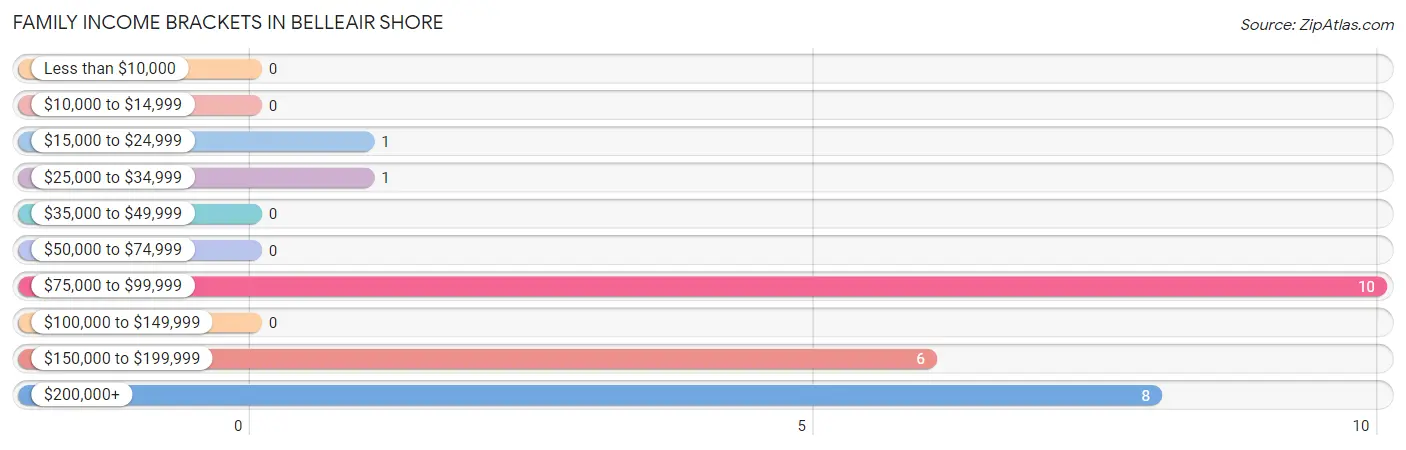
Family Income Brackets in Belleair Shore
According to the Belleair Shore family income data, there are 10 families falling into the $75,000 to $99,999 income range, which is the most common income bracket and makes up 38.5% of all families.
| Income Bracket | # Families | % Families |
| Less than $10,000 | 0 | 0.0% |
| $10,000 to $14,999 | 0 | 0.0% |
| $15,000 to $24,999 | 1 | 3.8% |
| $25,000 to $34,999 | 1 | 3.8% |
| $35,000 to $49,999 | 0 | 0.0% |
| $50,000 to $74,999 | 0 | 0.0% |
| $75,000 to $99,999 | 10 | 38.5% |
| $100,000 to $149,999 | 0 | 0.0% |
| $150,000 to $199,999 | 6 | 23.1% |
| $200,000+ | 8 | 30.8% |
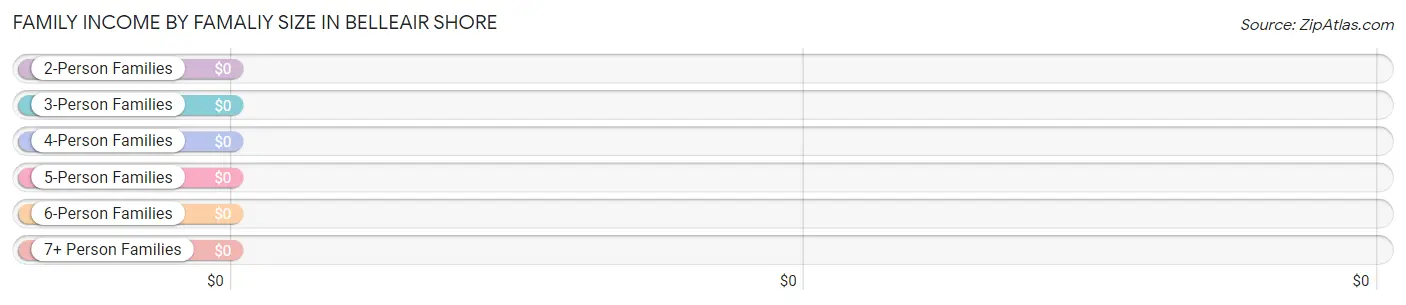
Family Income by Famaliy Size in Belleair Shore
| Income Bracket | # Families | Median Income |
| 2-Person Families | 18 (69.2%) | $0 |
| 3-Person Families | 8 (30.8%) | $0 |
| 4-Person Families | 0 (0.0%) | $0 |
| 5-Person Families | 0 (0.0%) | $0 |
| 6-Person Families | 0 (0.0%) | $0 |
| 7+ Person Families | 0 (0.0%) | $0 |
| Total | 26 (100.0%) | $0 |
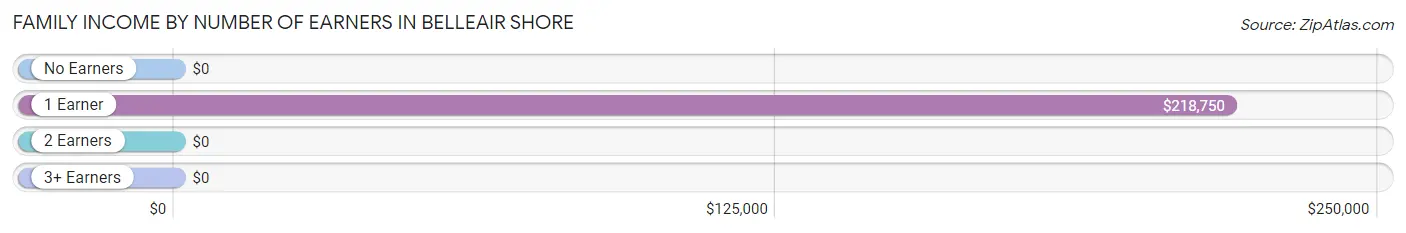
Family Income by Number of Earners in Belleair Shore
| Number of Earners | # Families | Median Income |
| No Earners | 9 (34.6%) | $0 |
| 1 Earner | 8 (30.8%) | $218,750 |
| 2 Earners | 7 (26.9%) | $0 |
| 3+ Earners | 2 (7.7%) | $0 |
| Total | 26 (100.0%) | $0 |
Household Income in Belleair Shore
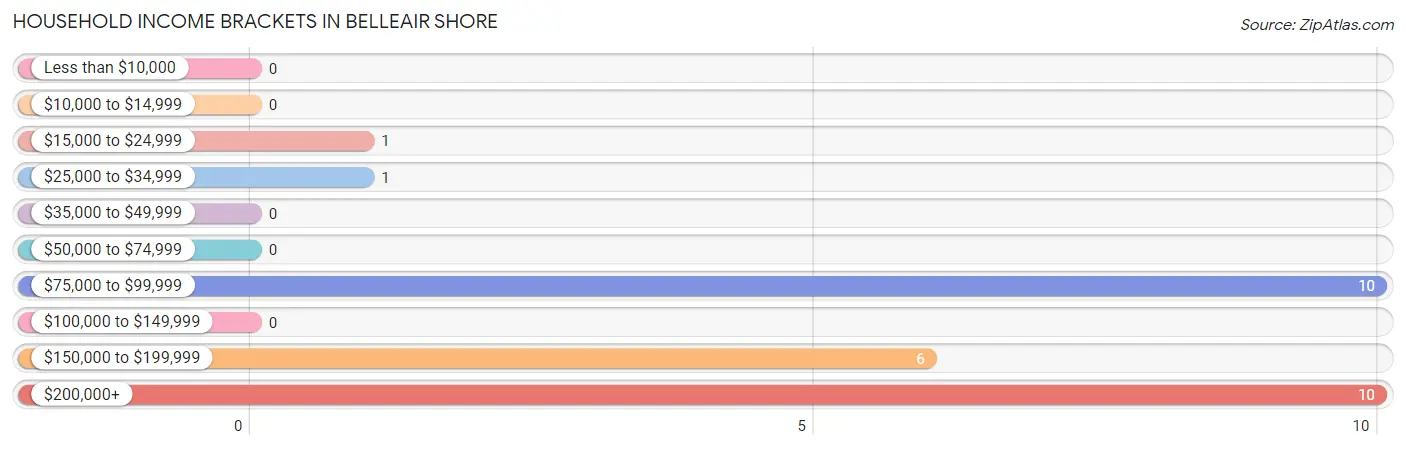
Household Income Brackets in Belleair Shore
With 10 households falling in the category, the $75,000 to $99,999 income range is the most frequent in Belleair Shore, accounting for 35.7% of all households.
| Income Bracket | # Households | % Households |
| Less than $10,000 | 0 | 0.0% |
| $10,000 to $14,999 | 0 | 0.0% |
| $15,000 to $24,999 | 1 | 3.6% |
| $25,000 to $34,999 | 1 | 3.6% |
| $35,000 to $49,999 | 0 | 0.0% |
| $50,000 to $74,999 | 0 | 0.0% |
| $75,000 to $99,999 | 10 | 35.7% |
| $100,000 to $149,999 | 0 | 0.0% |
| $150,000 to $199,999 | 6 | 21.4% |
| $200,000+ | 10 | 35.7% |
Household Income by Householder Age in Belleair Shore
The median household income in Belleair Shore is $178,750, with the highest median household income of $186,875 found in the 65+ years age bracket for the primary householder. A total of 12 households (42.9%) fall into this category.
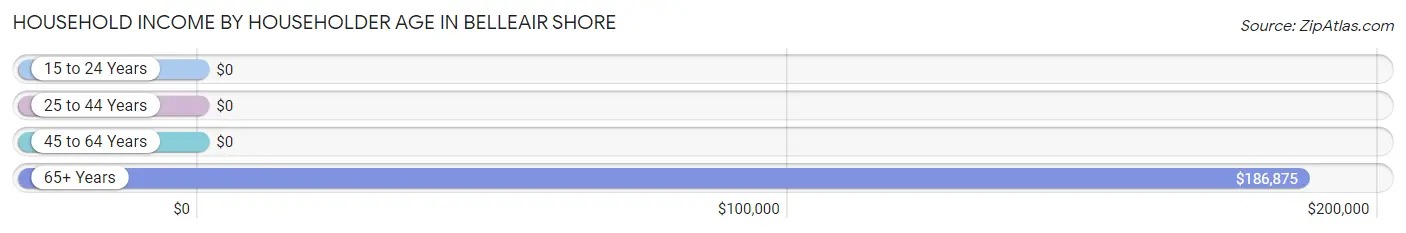
| Income Bracket | # Households | Median Income |
| 15 to 24 Years | 0 (0.0%) | $0 |
| 25 to 44 Years | 0 (0.0%) | $0 |
| 45 to 64 Years | 16 (57.1%) | $0 |
| 65+ Years | 12 (42.9%) | $186,875 |
| Total | 28 (100.0%) | $178,750 |
Poverty in Belleair Shore
Income Below Poverty by Sex and Age in Belleair Shore
With 5.7% poverty level for males and 15.6% for females among the residents of Belleair Shore, 12 to 14 year old males and 15 year old females are the most vulnerable to poverty, with 2 males (50.0%) and 1 females (100.0%) in their respective age groups living below the poverty level.
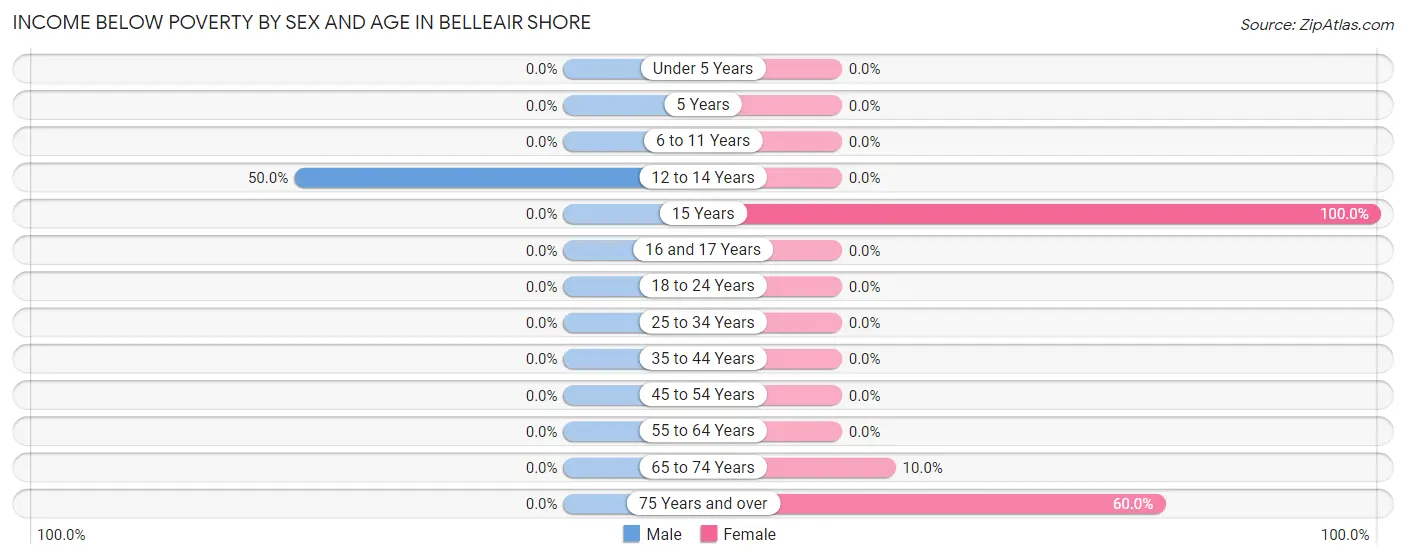
| Age Bracket | Male | Female |
| Under 5 Years | 0 (0.0%) | 0 (0.0%) |
| 5 Years | 0 (0.0%) | 0 (0.0%) |
| 6 to 11 Years | 0 (0.0%) | 0 (0.0%) |
| 12 to 14 Years | 2 (50.0%) | 0 (0.0%) |
| 15 Years | 0 (0.0%) | 1 (100.0%) |
| 16 and 17 Years | 0 (0.0%) | 0 (0.0%) |
| 18 to 24 Years | 0 (0.0%) | 0 (0.0%) |
| 25 to 34 Years | 0 (0.0%) | 0 (0.0%) |
| 35 to 44 Years | 0 (0.0%) | 0 (0.0%) |
| 45 to 54 Years | 0 (0.0%) | 0 (0.0%) |
| 55 to 64 Years | 0 (0.0%) | 0 (0.0%) |
| 65 to 74 Years | 0 (0.0%) | 1 (10.0%) |
| 75 Years and over | 0 (0.0%) | 3 (60.0%) |
| Total | 2 (5.7%) | 5 (15.6%) |
Income Above Poverty by Sex and Age in Belleair Shore
According to the poverty statistics in Belleair Shore, males aged 16 and 17 years and females aged 16 and 17 years are the age groups that are most secure financially, with 100.0% of males and 100.0% of females in these age groups living above the poverty line.
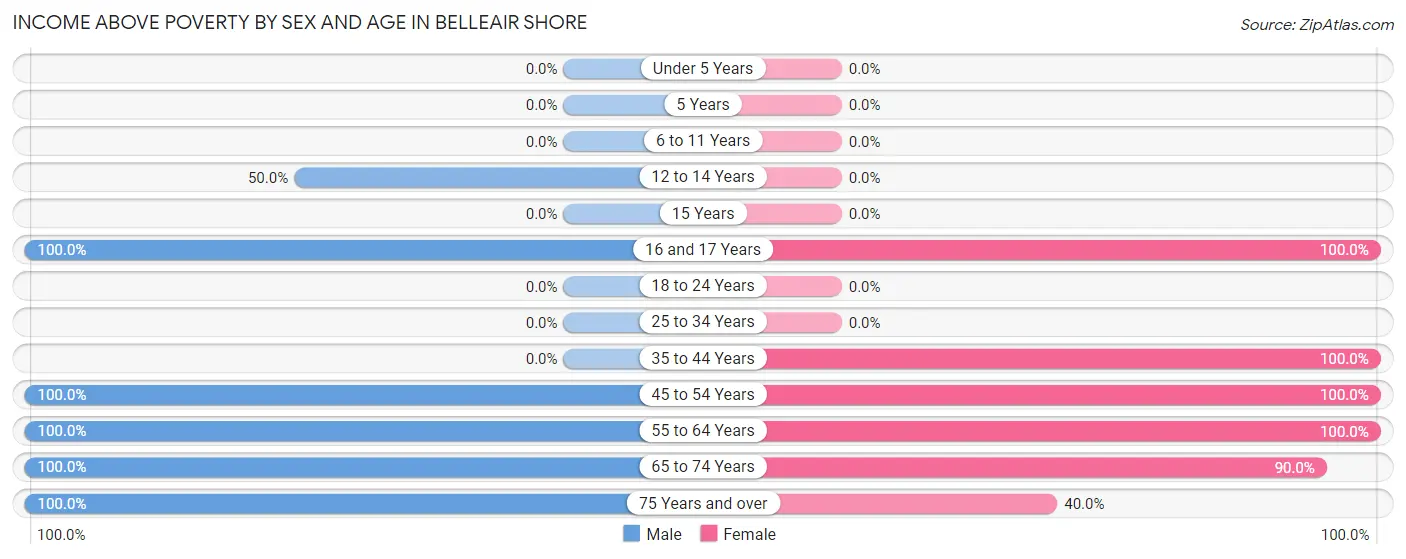
| Age Bracket | Male | Female |
| Under 5 Years | 0 (0.0%) | 0 (0.0%) |
| 5 Years | 0 (0.0%) | 0 (0.0%) |
| 6 to 11 Years | 0 (0.0%) | 0 (0.0%) |
| 12 to 14 Years | 2 (50.0%) | 0 (0.0%) |
| 15 Years | 0 (0.0%) | 0 (0.0%) |
| 16 and 17 Years | 3 (100.0%) | 1 (100.0%) |
| 18 to 24 Years | 0 (0.0%) | 0 (0.0%) |
| 25 to 34 Years | 0 (0.0%) | 0 (0.0%) |
| 35 to 44 Years | 0 (0.0%) | 1 (100.0%) |
| 45 to 54 Years | 2 (100.0%) | 1 (100.0%) |
| 55 to 64 Years | 15 (100.0%) | 13 (100.0%) |
| 65 to 74 Years | 5 (100.0%) | 9 (90.0%) |
| 75 Years and over | 6 (100.0%) | 2 (40.0%) |
| Total | 33 (94.3%) | 27 (84.4%) |
Income Below Poverty Among Married-Couple Families in Belleair Shore
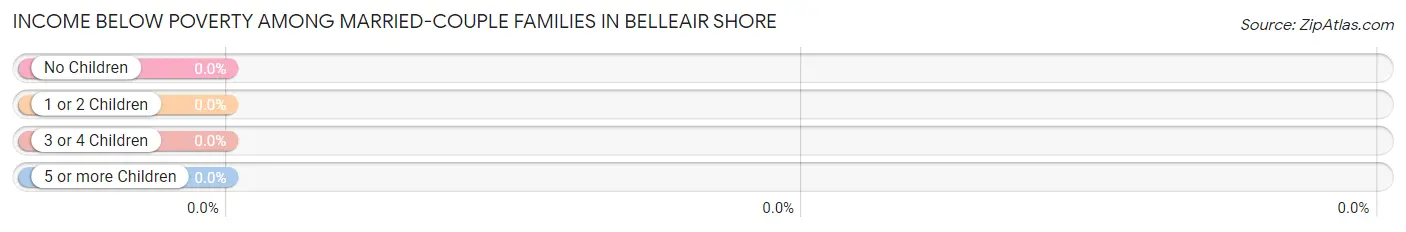
| Children | Above Poverty | Below Poverty |
| No Children | 18 (100.0%) | 0 (0.0%) |
| 1 or 2 Children | 7 (100.0%) | 0 (0.0%) |
| 3 or 4 Children | 0 (0.0%) | 0 (0.0%) |
| 5 or more Children | 0 (0.0%) | 0 (0.0%) |
| Total | 25 (100.0%) | 0 (0.0%) |
Income Below Poverty Among Single-Parent Households in Belleair Shore
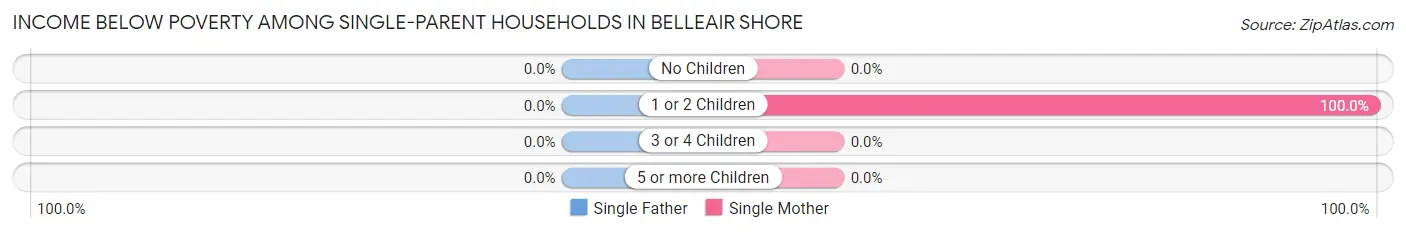
| Children | Single Father | Single Mother |
| No Children | 0 (0.0%) | 0 (0.0%) |
| 1 or 2 Children | 0 (0.0%) | 1 (100.0%) |
| 3 or 4 Children | 0 (0.0%) | 0 (0.0%) |
| 5 or more Children | 0 (0.0%) | 0 (0.0%) |
| Total | 0 (0.0%) | 1 (100.0%) |
Income Below Poverty Among Married-Couple vs Single-Parent Households in Belleair Shore
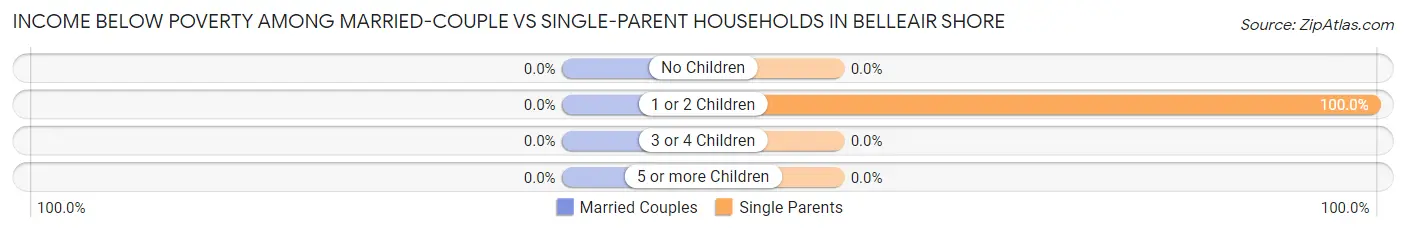
| Children | Married-Couple Families | Single-Parent Households |
| No Children | 0 (0.0%) | 0 (0.0%) |
| 1 or 2 Children | 0 (0.0%) | 1 (100.0%) |
| 3 or 4 Children | 0 (0.0%) | 0 (0.0%) |
| 5 or more Children | 0 (0.0%) | 0 (0.0%) |
| Total | 0 (0.0%) | 1 (100.0%) |
Race in Belleair Shore
The most populous races in Belleair Shore are White / Caucasian (64 | 95.5%), and Asian (3 | 4.5%).
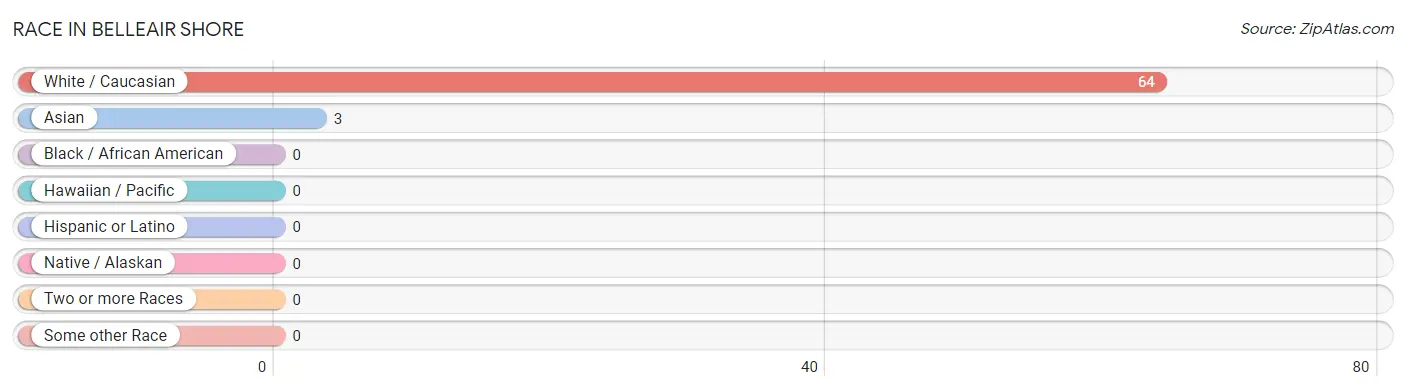
| Race | # Population | % Population |
| Asian | 3 | 4.5% |
| Black / African American | 0 | 0.0% |
| Hawaiian / Pacific | 0 | 0.0% |
| Hispanic or Latino | 0 | 0.0% |
| Native / Alaskan | 0 | 0.0% |
| White / Caucasian | 64 | 95.5% |
| Two or more Races | 0 | 0.0% |
| Some other Race | 0 | 0.0% |
| Total | 67 | 100.0% |
Ancestry in Belleair Shore
The most populous ancestries reported in Belleair Shore are American (17 | 25.4%), English (12 | 17.9%), Irish (11 | 16.4%), German (7 | 10.4%), and Welsh (6 | 9.0%), together accounting for 79.1% of all Belleair Shore residents.
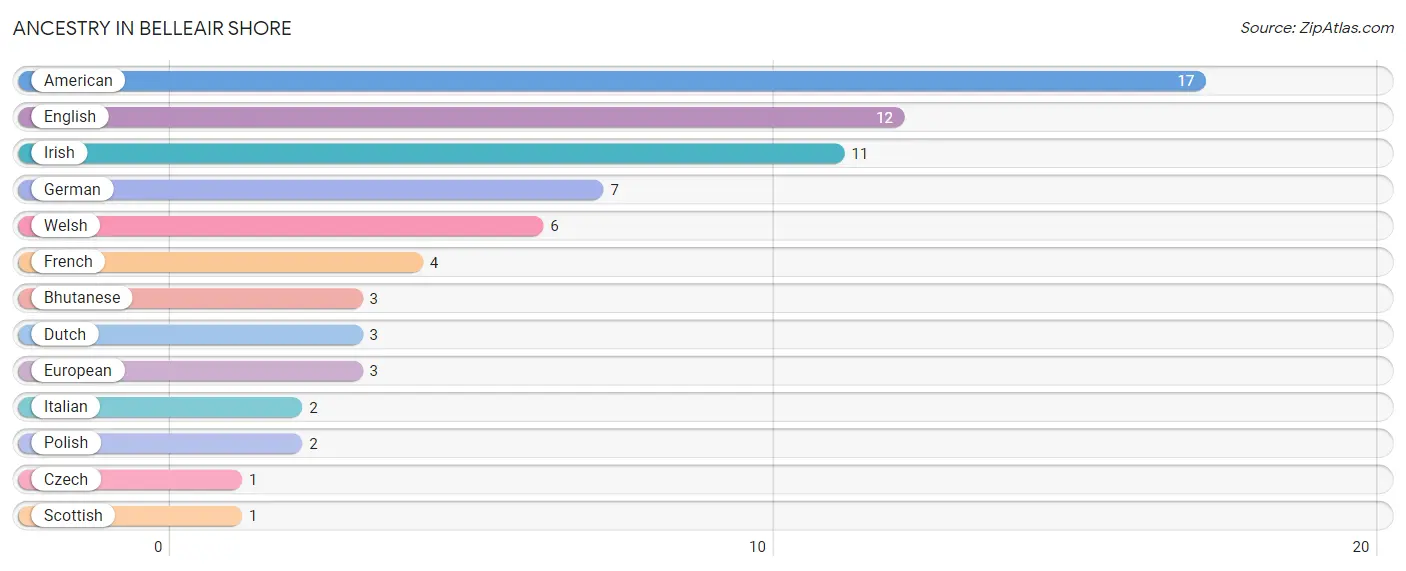
| Ancestry | # Population | % Population |
| American | 17 | 25.4% |
| Bhutanese | 3 | 4.5% |
| Czech | 1 | 1.5% |
| Dutch | 3 | 4.5% |
| English | 12 | 17.9% |
| European | 3 | 4.5% |
| French | 4 | 6.0% |
| German | 7 | 10.4% |
| Irish | 11 | 16.4% |
| Italian | 2 | 3.0% |
| Polish | 2 | 3.0% |
| Scottish | 1 | 1.5% |
| Welsh | 6 | 9.0% | View All 13 Rows |
Immigrants in Belleair Shore
The most numerous immigrant groups reported in Belleair Shore came from Europe (7 | 10.4%), Germany (4 | 6.0%), Western Europe (4 | 6.0%), Asia (3 | 4.5%), and Eastern Asia (3 | 4.5%), together accounting for 31.4% of all Belleair Shore residents.
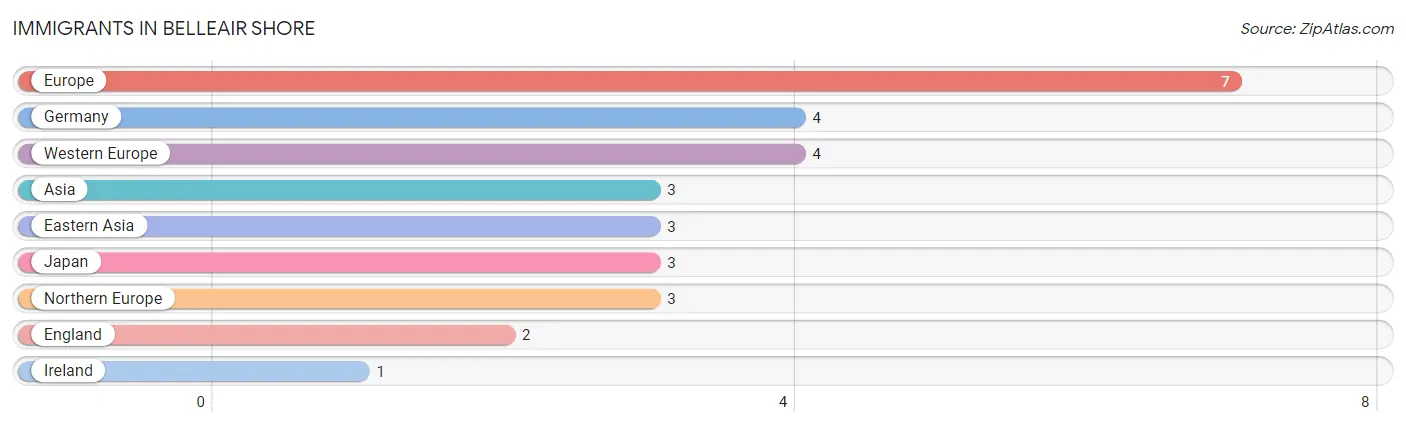
| Immigration Origin | # Population | % Population |
| Asia | 3 | 4.5% |
| Eastern Asia | 3 | 4.5% |
| England | 2 | 3.0% |
| Europe | 7 | 10.4% |
| Germany | 4 | 6.0% |
| Ireland | 1 | 1.5% |
| Japan | 3 | 4.5% |
| Northern Europe | 3 | 4.5% |
| Western Europe | 4 | 6.0% | View All 9 Rows |
Sex and Age in Belleair Shore
Sex and Age in Belleair Shore
The most populous age groups in Belleair Shore are 55 to 59 Years (11 | 31.4%) for men and 55 to 59 Years (11 | 34.4%) for women.
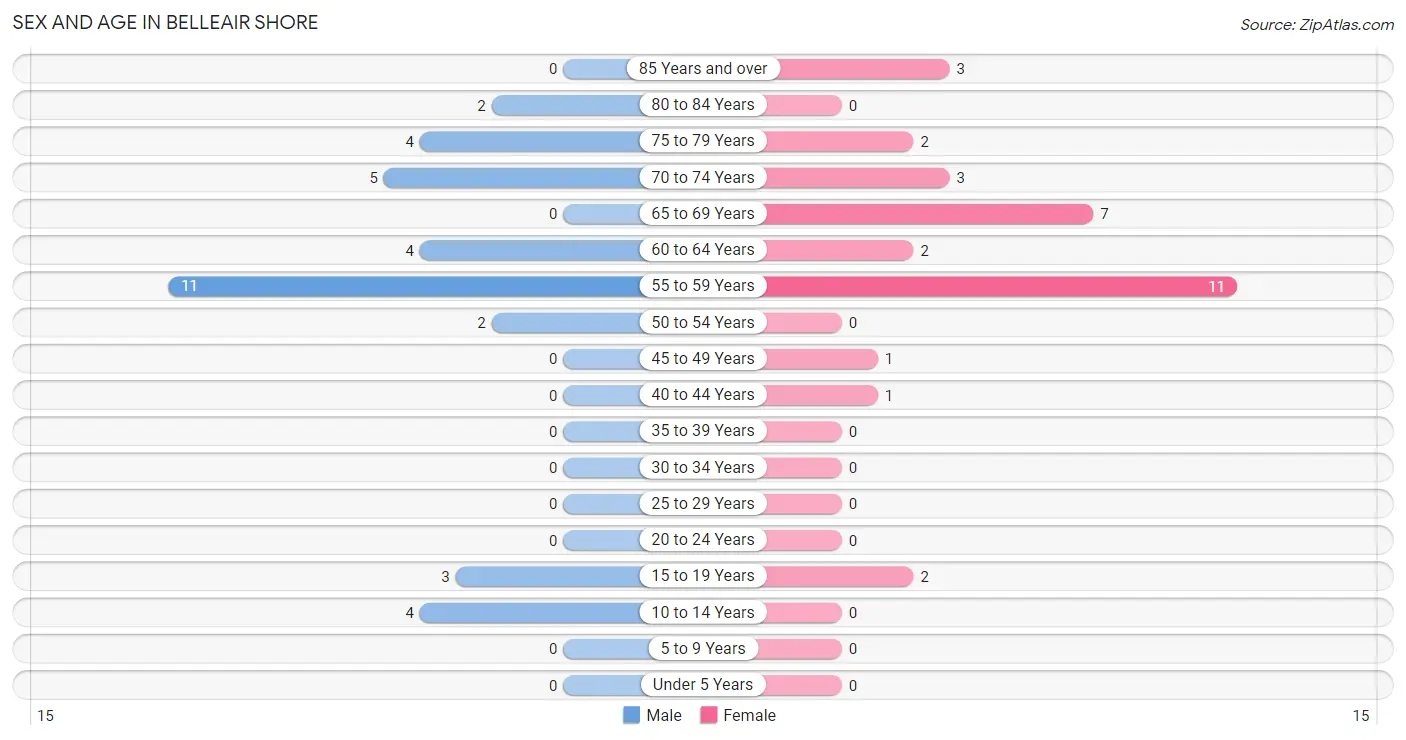
| Age Bracket | Male | Female |
| Under 5 Years | 0 (0.0%) | 0 (0.0%) |
| 5 to 9 Years | 0 (0.0%) | 0 (0.0%) |
| 10 to 14 Years | 4 (11.4%) | 0 (0.0%) |
| 15 to 19 Years | 3 (8.6%) | 2 (6.2%) |
| 20 to 24 Years | 0 (0.0%) | 0 (0.0%) |
| 25 to 29 Years | 0 (0.0%) | 0 (0.0%) |
| 30 to 34 Years | 0 (0.0%) | 0 (0.0%) |
| 35 to 39 Years | 0 (0.0%) | 0 (0.0%) |
| 40 to 44 Years | 0 (0.0%) | 1 (3.1%) |
| 45 to 49 Years | 0 (0.0%) | 1 (3.1%) |
| 50 to 54 Years | 2 (5.7%) | 0 (0.0%) |
| 55 to 59 Years | 11 (31.4%) | 11 (34.4%) |
| 60 to 64 Years | 4 (11.4%) | 2 (6.2%) |
| 65 to 69 Years | 0 (0.0%) | 7 (21.9%) |
| 70 to 74 Years | 5 (14.3%) | 3 (9.4%) |
| 75 to 79 Years | 4 (11.4%) | 2 (6.2%) |
| 80 to 84 Years | 2 (5.7%) | 0 (0.0%) |
| 85 Years and over | 0 (0.0%) | 3 (9.4%) |
| Total | 35 (100.0%) | 32 (100.0%) |
Families and Households in Belleair Shore
Median Family Size in Belleair Shore
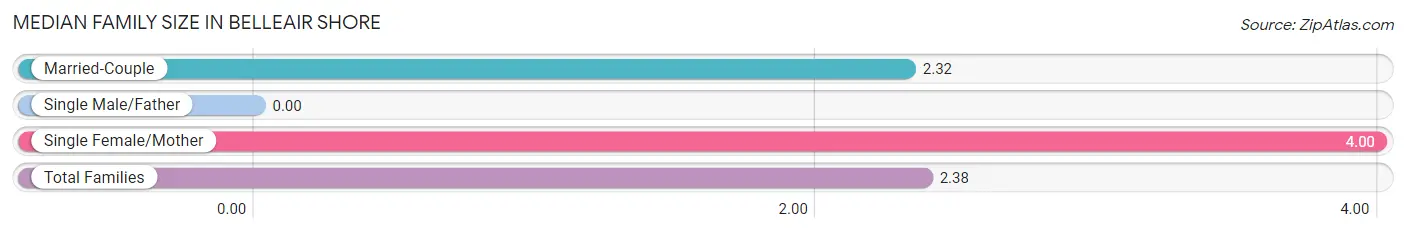
| Family Type | # Families | Family Size |
| Married-Couple | 25 (96.2%) | 2.32 |
| Single Male/Father | 0 (0.0%) | - |
| Single Female/Mother | 1 (3.8%) | 4.00 |
| Total Families | 26 (100.0%) | 2.38 |
Median Household Size in Belleair Shore
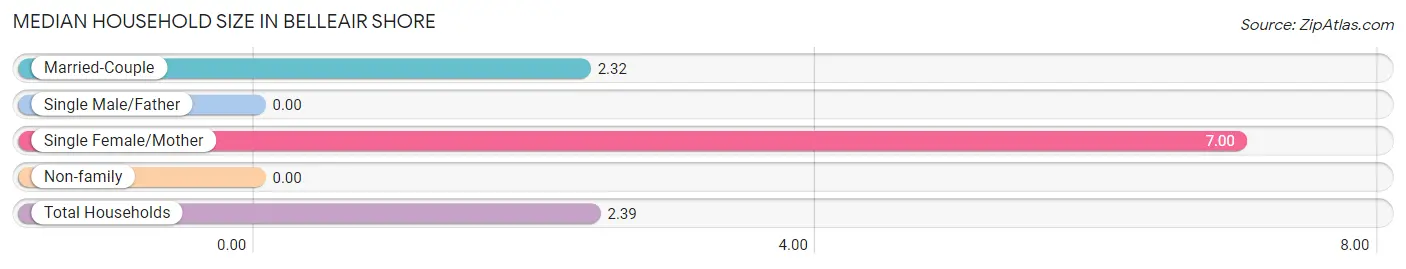
| Household Type | # Households | Household Size |
| Married-Couple | 25 (89.3%) | 2.32 |
| Single Male/Father | 0 (0.0%) | - |
| Single Female/Mother | 1 (3.6%) | 7.00 |
| Non-family | 2 (7.1%) | - |
| Total Households | 28 (100.0%) | 2.39 |
Household Size by Marriage Status in Belleair Shore
Out of a total of 28 households in Belleair Shore, 26 (92.9%) are family households, while 2 (7.1%) are nonfamily households. The most numerous type of family households are 2-person households, comprising 18, and the most common type of nonfamily households are 1-person households, comprising 2.
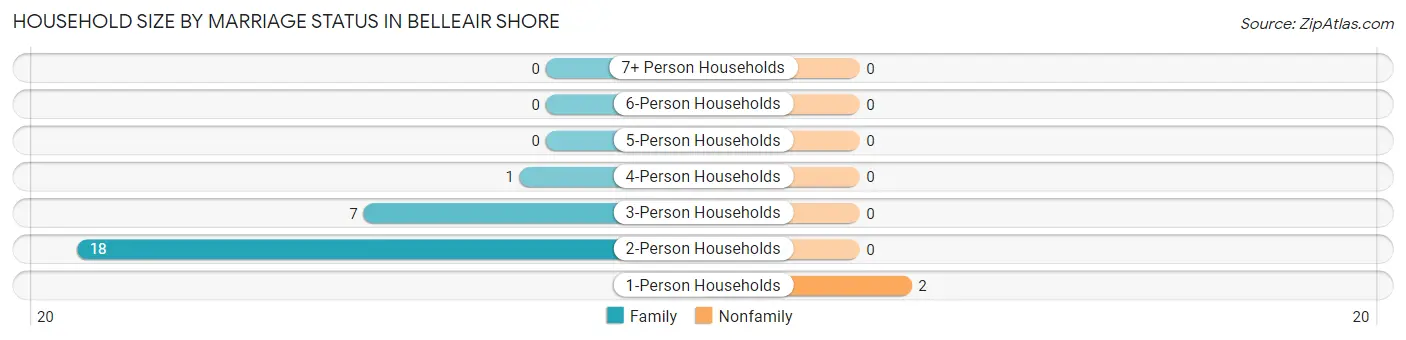
| Household Size | Family Households | Nonfamily Households |
| 1-Person Households | - | 2 (7.1%) |
| 2-Person Households | 18 (64.3%) | 0 (0.0%) |
| 3-Person Households | 7 (25.0%) | 0 (0.0%) |
| 4-Person Households | 1 (3.6%) | 0 (0.0%) |
| 5-Person Households | 0 (0.0%) | 0 (0.0%) |
| 6-Person Households | 0 (0.0%) | 0 (0.0%) |
| 7+ Person Households | 0 (0.0%) | 0 (0.0%) |
| Total | 26 (92.9%) | 2 (7.1%) |
Female Fertility in Belleair Shore
Fertility by Age in Belleair Shore
| Age Bracket | Women with Births | Births / 1,000 Women |
| 15 to 19 years | 0 (0.0%) | 0.0 |
| 20 to 34 years | 0 (0.0%) | 0.0 |
| 35 to 50 years | 0 (0.0%) | 0.0 |
| Total | 0 (0.0%) | 0.0 |
Fertility by Age by Marriage Status in Belleair Shore
| Age Bracket | Married | Unmarried |
| 15 to 19 years | 0 (0.0%) | 0 (0.0%) |
| 20 to 34 years | 0 (0.0%) | 0 (0.0%) |
| 35 to 50 years | 0 (0.0%) | 0 (0.0%) |
| Total | 0 (0.0%) | 0 (0.0%) |
Fertility by Education in Belleair Shore
| Educational Attainment | Women with Births | Births / 1,000 Women |
| Less than High School | 0 (0.0%) | 0.0 |
| High School Diploma | 0 (0.0%) | 0.0 |
| College or Associate's Degree | 0 (0.0%) | 0.0 |
| Bachelor's Degree | 0 (0.0%) | 0.0 |
| Graduate Degree | 0 (0.0%) | 0.0 |
| Total | 0 (0.0%) | 0.0 |
Fertility by Education by Marriage Status in Belleair Shore
| Educational Attainment | Married | Unmarried |
| Less than High School | 0 (0.0%) | 0 (0.0%) |
| High School Diploma | 0 (0.0%) | 0 (0.0%) |
| College or Associate's Degree | 0 (0.0%) | 0 (0.0%) |
| Bachelor's Degree | 0 (0.0%) | 0 (0.0%) |
| Graduate Degree | 0 (0.0%) | 0 (0.0%) |
| Total | 0 (0.0%) | 0 (0.0%) |
Employment Characteristics in Belleair Shore
Employment by Class of Employer in Belleair Shore
Among the 29 employed individuals in Belleair Shore, private company employees (18 | 62.1%), not-for-profit organizations (7 | 24.1%), and self-employed (incorporated) (2 | 6.9%) make up the most common classes of employment.
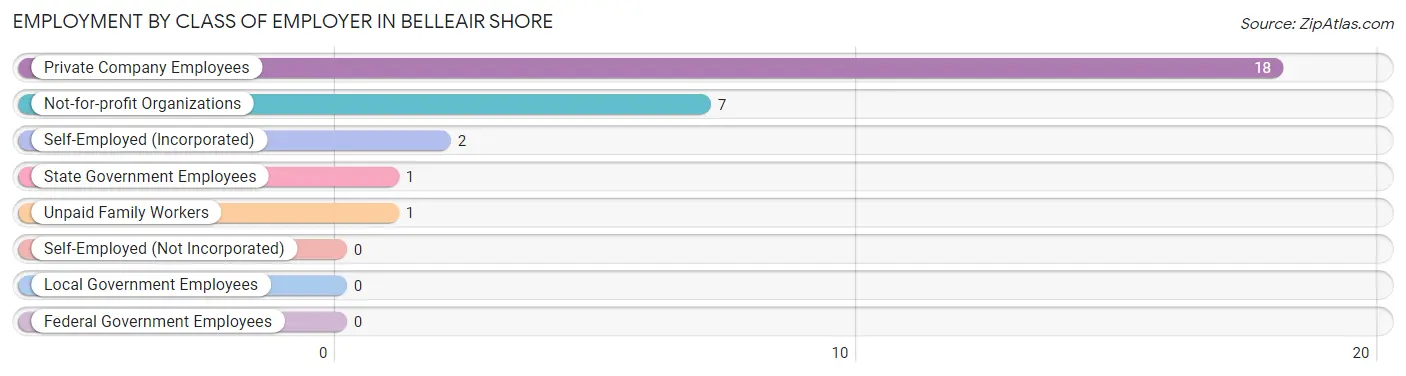
| Employer Class | # Employees | % Employees |
| Private Company Employees | 18 | 62.1% |
| Self-Employed (Incorporated) | 2 | 6.9% |
| Self-Employed (Not Incorporated) | 0 | 0.0% |
| Not-for-profit Organizations | 7 | 24.1% |
| Local Government Employees | 0 | 0.0% |
| State Government Employees | 1 | 3.5% |
| Federal Government Employees | 0 | 0.0% |
| Unpaid Family Workers | 1 | 3.5% |
| Total | 29 | 100.0% |
Employment Status by Age in Belleair Shore
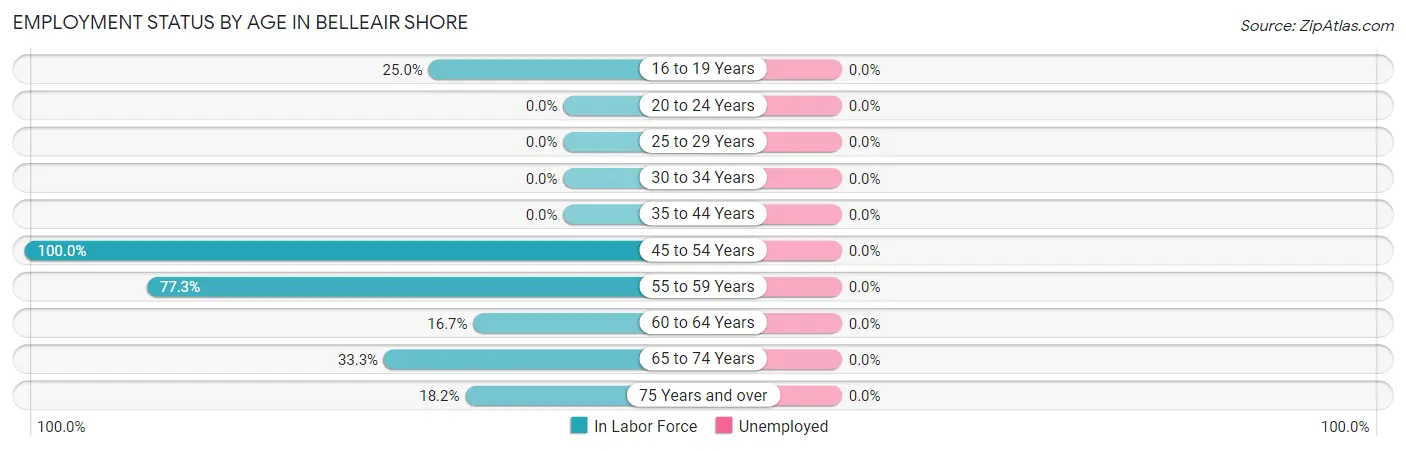
| Age Bracket | In Labor Force | Unemployed |
| 16 to 19 Years | 1 (25.0%) | 0 (0.0%) |
| 20 to 24 Years | 0 (0.0%) | 0 (0.0%) |
| 25 to 29 Years | 0 (0.0%) | 0 (0.0%) |
| 30 to 34 Years | 0 (0.0%) | 0 (0.0%) |
| 35 to 44 Years | 0 (0.0%) | 0 (0.0%) |
| 45 to 54 Years | 3 (100.0%) | 0 (0.0%) |
| 55 to 59 Years | 17 (77.3%) | 0 (0.0%) |
| 60 to 64 Years | 1 (16.7%) | 0 (0.0%) |
| 65 to 74 Years | 5 (33.3%) | 0 (0.0%) |
| 75 Years and over | 2 (18.2%) | 0 (0.0%) |
| Total | 29 (46.8%) | 0 (0.0%) |
Employment Status by Educational Attainment in Belleair Shore
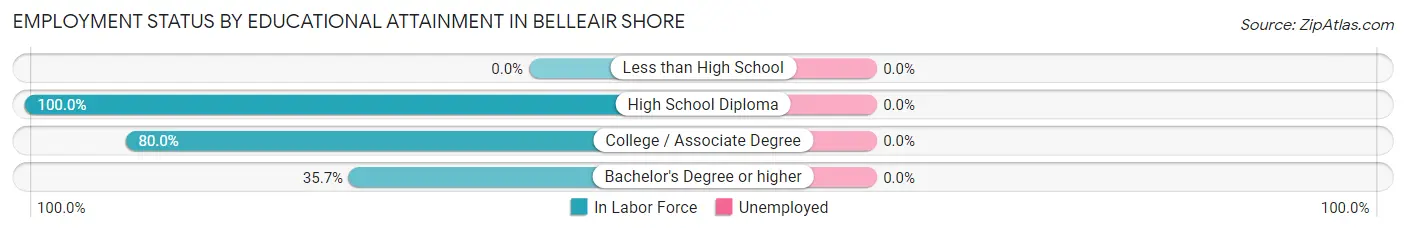
| Educational Attainment | In Labor Force | Unemployed |
| Less than High School | 0 (0.0%) | 0 (0.0%) |
| High School Diploma | 8 (100.0%) | 0 (0.0%) |
| College / Associate Degree | 8 (80.0%) | 0 (0.0%) |
| Bachelor's Degree or higher | 5 (35.7%) | 0 (0.0%) |
| Total | 21 (65.6%) | 0 (0.0%) |
Employment Occupations by Sex in Belleair Shore
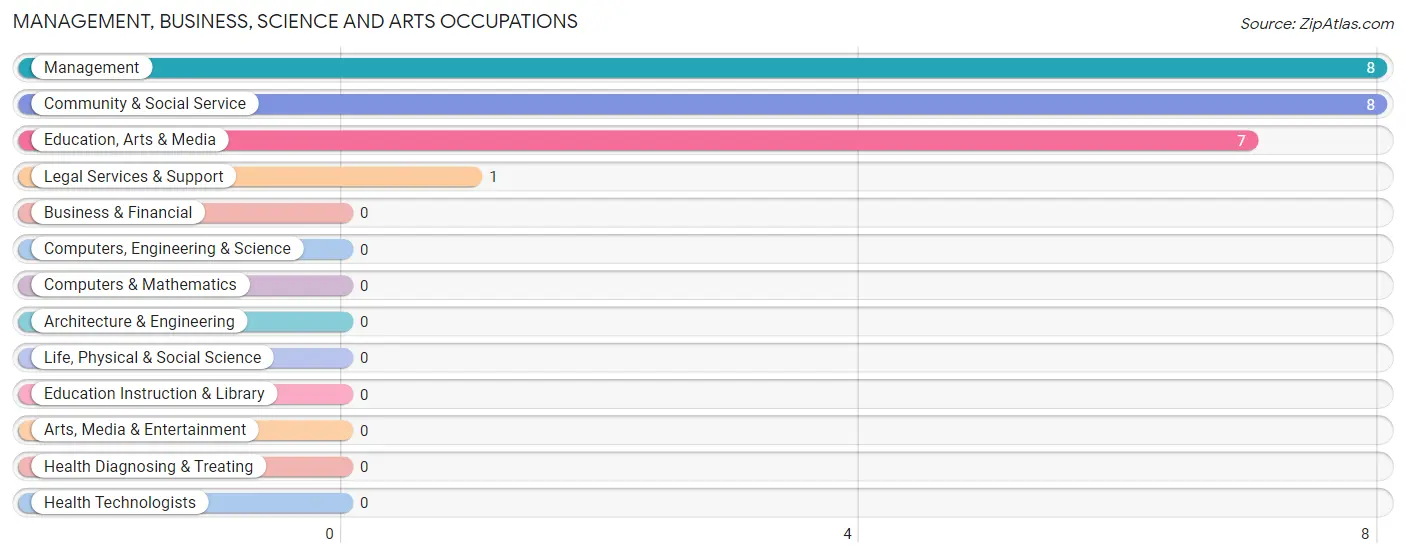
Management, Business, Science and Arts Occupations
The most common Management, Business, Science and Arts occupations in Belleair Shore are Management (8 | 27.6%), Community & Social Service (8 | 27.6%), Education, Arts & Media (7 | 24.1%), and Legal Services & Support (1 | 3.5%).
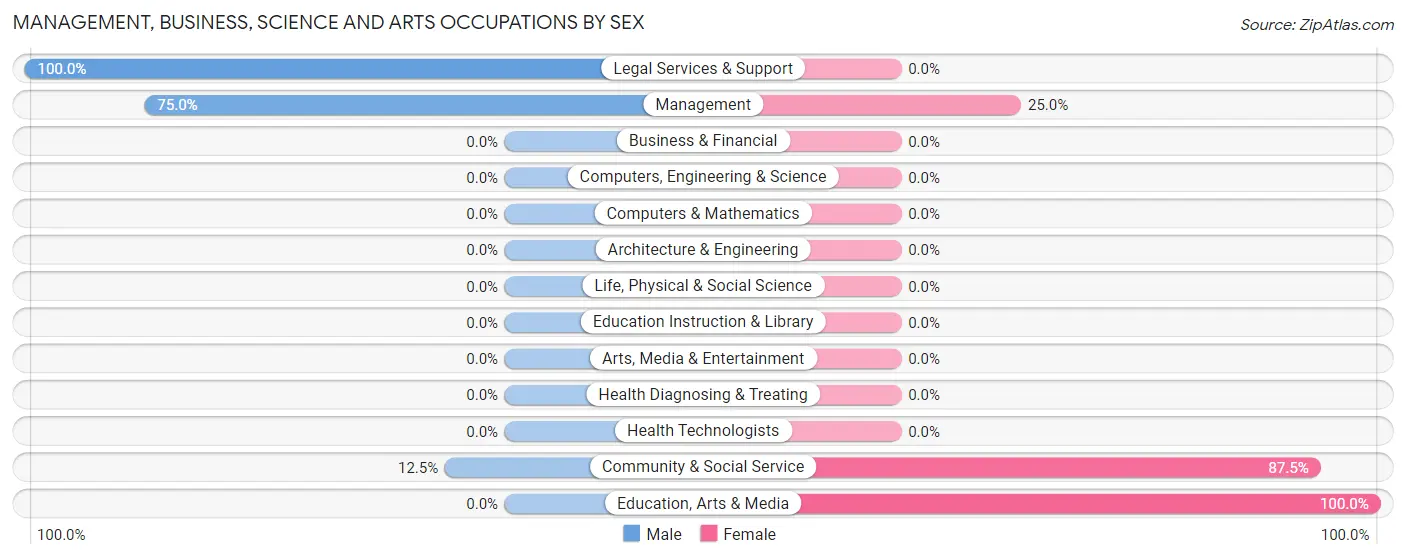
Management, Business, Science and Arts Occupations by Sex
Within the Management, Business, Science and Arts occupations in Belleair Shore, the most male-oriented occupations are Legal Services & Support (100.0%), Management (75.0%), and Community & Social Service (12.5%), while the most female-oriented occupations are Education, Arts & Media (100.0%), Community & Social Service (87.5%), and Management (25.0%).
| Occupation | Male | Female |
| Management | 6 (75.0%) | 2 (25.0%) |
| Business & Financial | 0 (0.0%) | 0 (0.0%) |
| Computers, Engineering & Science | 0 (0.0%) | 0 (0.0%) |
| Computers & Mathematics | 0 (0.0%) | 0 (0.0%) |
| Architecture & Engineering | 0 (0.0%) | 0 (0.0%) |
| Life, Physical & Social Science | 0 (0.0%) | 0 (0.0%) |
| Community & Social Service | 1 (12.5%) | 7 (87.5%) |
| Education, Arts & Media | 0 (0.0%) | 7 (100.0%) |
| Legal Services & Support | 1 (100.0%) | 0 (0.0%) |
| Education Instruction & Library | 0 (0.0%) | 0 (0.0%) |
| Arts, Media & Entertainment | 0 (0.0%) | 0 (0.0%) |
| Health Diagnosing & Treating | 0 (0.0%) | 0 (0.0%) |
| Health Technologists | 0 (0.0%) | 0 (0.0%) |
| Total (Category) | 7 (43.8%) | 9 (56.2%) |
| Total (Overall) | 19 (65.5%) | 10 (34.5%) |
Services Occupations
Services Occupations by Sex
| Occupation | Male | Female |
| Healthcare Support | 0 (0.0%) | 0 (0.0%) |
| Security & Protection | 0 (0.0%) | 0 (0.0%) |
| Firefighting & Prevention | 0 (0.0%) | 0 (0.0%) |
| Law Enforcement | 0 (0.0%) | 0 (0.0%) |
| Food Preparation & Serving | 0 (0.0%) | 0 (0.0%) |
| Cleaning & Maintenance | 0 (0.0%) | 0 (0.0%) |
| Personal Care & Service | 0 (0.0%) | 0 (0.0%) |
| Total (Category) | 0 (0.0%) | 0 (0.0%) |
| Total (Overall) | 19 (65.5%) | 10 (34.5%) |
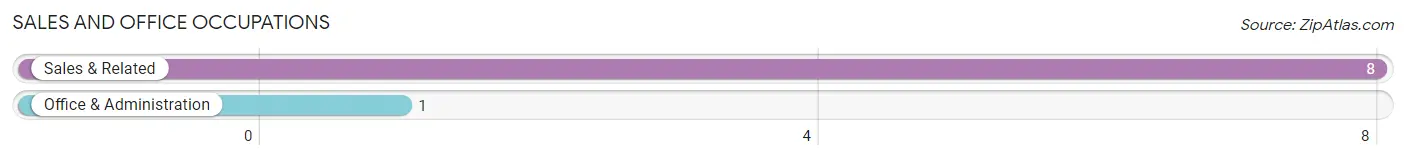
Sales and Office Occupations
The most common Sales and Office occupations in Belleair Shore are Sales & Related (8 | 27.6%), and Office & Administration (1 | 3.5%).
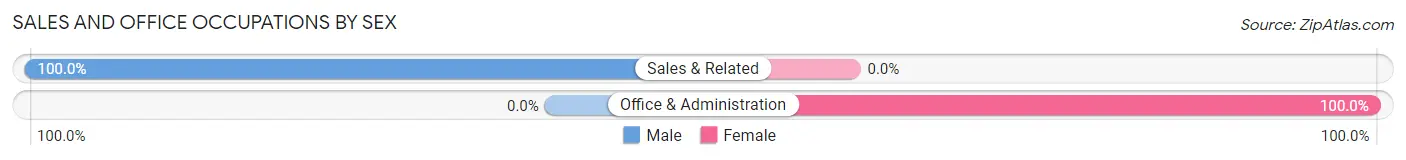
Sales and Office Occupations by Sex
| Occupation | Male | Female |
| Sales & Related | 8 (100.0%) | 0 (0.0%) |
| Office & Administration | 0 (0.0%) | 1 (100.0%) |
| Total (Category) | 8 (88.9%) | 1 (11.1%) |
| Total (Overall) | 19 (65.5%) | 10 (34.5%) |
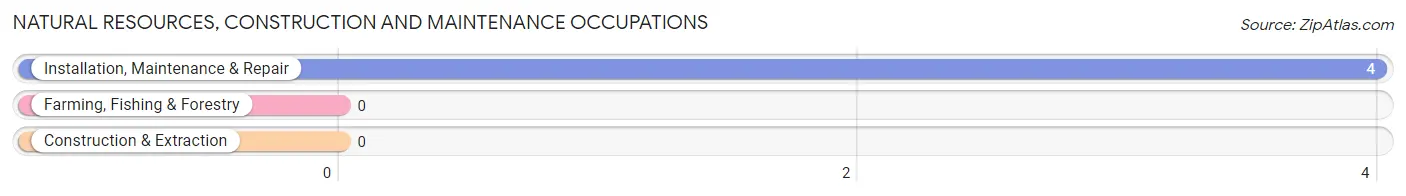
Natural Resources, Construction and Maintenance Occupations
The most common Natural Resources, Construction and Maintenance occupations in Belleair Shore are , and Installation, Maintenance & Repair (4 | 13.8%).
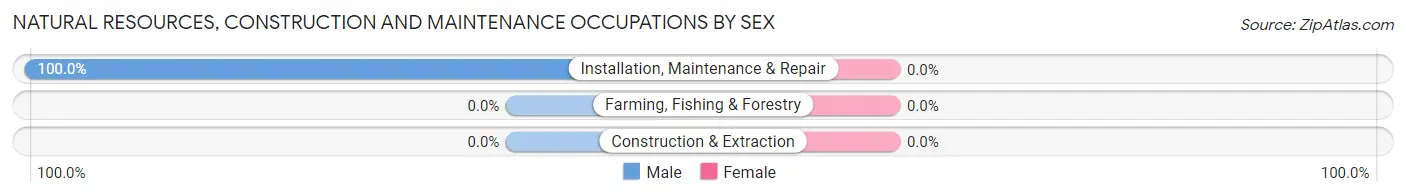
Natural Resources, Construction and Maintenance Occupations by Sex
| Occupation | Male | Female |
| Farming, Fishing & Forestry | 0 (0.0%) | 0 (0.0%) |
| Construction & Extraction | 0 (0.0%) | 0 (0.0%) |
| Installation, Maintenance & Repair | 4 (100.0%) | 0 (0.0%) |
| Total (Category) | 4 (100.0%) | 0 (0.0%) |
| Total (Overall) | 19 (65.5%) | 10 (34.5%) |
Production, Transportation and Moving Occupations
Production, Transportation and Moving Occupations by Sex
| Occupation | Male | Female |
| Production | 0 (0.0%) | 0 (0.0%) |
| Transportation | 0 (0.0%) | 0 (0.0%) |
| Material Moving | 0 (0.0%) | 0 (0.0%) |
| Total (Category) | 0 (0.0%) | 0 (0.0%) |
| Total (Overall) | 19 (65.5%) | 10 (34.5%) |
Employment Industries by Sex in Belleair Shore
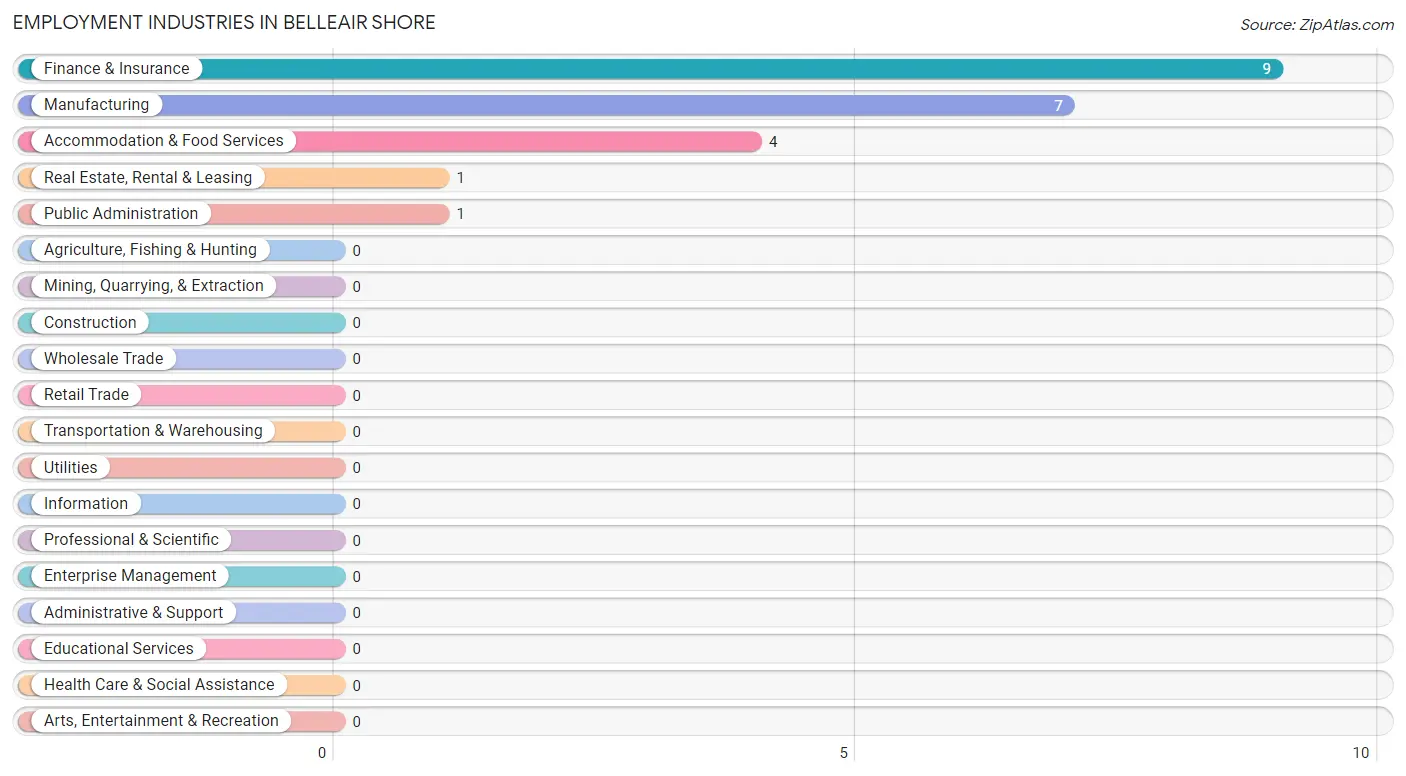
Employment Industries in Belleair Shore
The major employment industries in Belleair Shore include Finance & Insurance (9 | 31.0%), Manufacturing (7 | 24.1%), Accommodation & Food Services (4 | 13.8%), Real Estate, Rental & Leasing (1 | 3.5%), and Public Administration (1 | 3.5%).
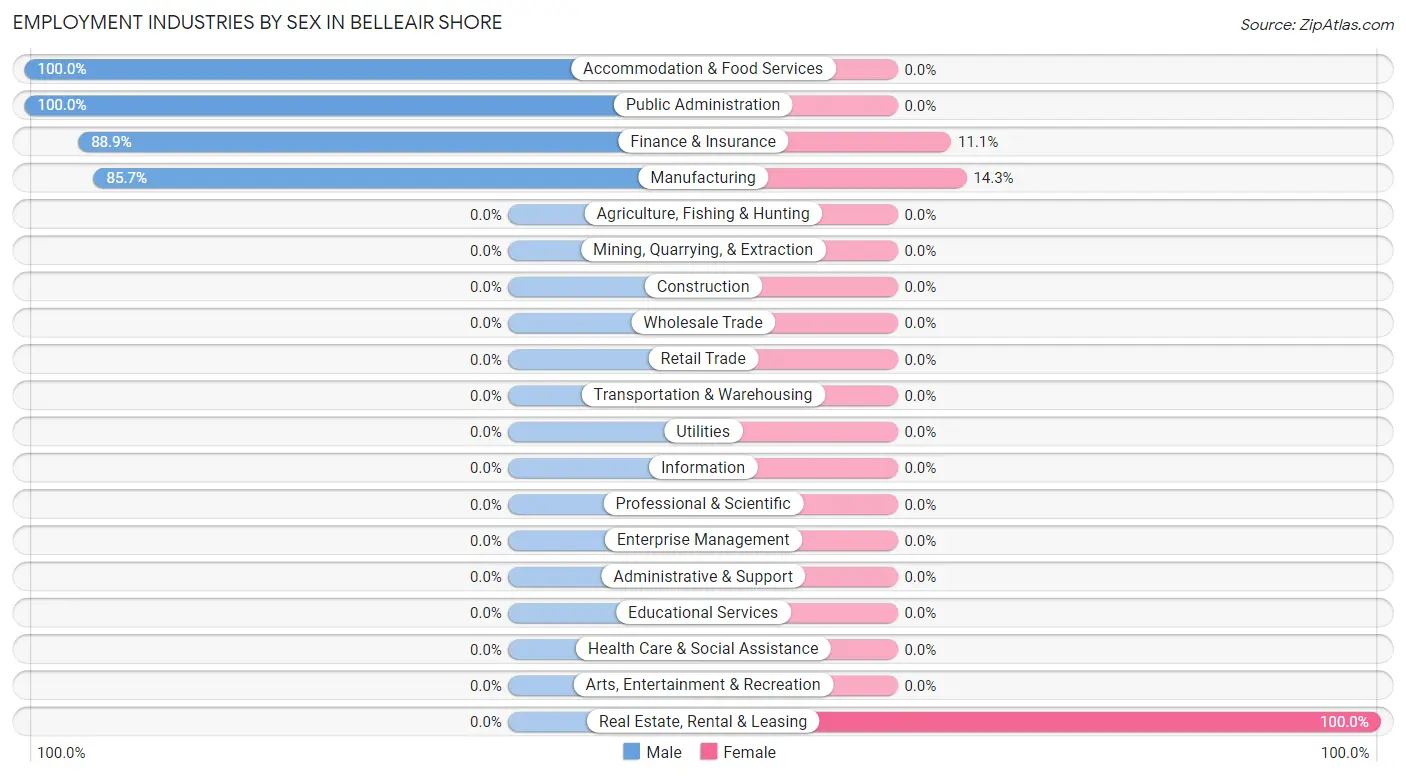
Employment Industries by Sex in Belleair Shore
The Belleair Shore industries that see more men than women are Accommodation & Food Services (100.0%), Public Administration (100.0%), and Finance & Insurance (88.9%), whereas the industries that tend to have a higher number of women are Real Estate, Rental & Leasing (100.0%), Manufacturing (14.3%), and Finance & Insurance (11.1%).
| Industry | Male | Female |
| Agriculture, Fishing & Hunting | 0 (0.0%) | 0 (0.0%) |
| Mining, Quarrying, & Extraction | 0 (0.0%) | 0 (0.0%) |
| Construction | 0 (0.0%) | 0 (0.0%) |
| Manufacturing | 6 (85.7%) | 1 (14.3%) |
| Wholesale Trade | 0 (0.0%) | 0 (0.0%) |
| Retail Trade | 0 (0.0%) | 0 (0.0%) |
| Transportation & Warehousing | 0 (0.0%) | 0 (0.0%) |
| Utilities | 0 (0.0%) | 0 (0.0%) |
| Information | 0 (0.0%) | 0 (0.0%) |
| Finance & Insurance | 8 (88.9%) | 1 (11.1%) |
| Real Estate, Rental & Leasing | 0 (0.0%) | 1 (100.0%) |
| Professional & Scientific | 0 (0.0%) | 0 (0.0%) |
| Enterprise Management | 0 (0.0%) | 0 (0.0%) |
| Administrative & Support | 0 (0.0%) | 0 (0.0%) |
| Educational Services | 0 (0.0%) | 0 (0.0%) |
| Health Care & Social Assistance | 0 (0.0%) | 0 (0.0%) |
| Arts, Entertainment & Recreation | 0 (0.0%) | 0 (0.0%) |
| Accommodation & Food Services | 4 (100.0%) | 0 (0.0%) |
| Public Administration | 1 (100.0%) | 0 (0.0%) |
| Total | 19 (65.5%) | 10 (34.5%) |
Education in Belleair Shore
School Enrollment in Belleair Shore
The most common levels of schooling among the 10 students in Belleair Shore are high school (7 | 70.0%), middle school (2 | 20.0%), and graduate / professional (1 | 10.0%).
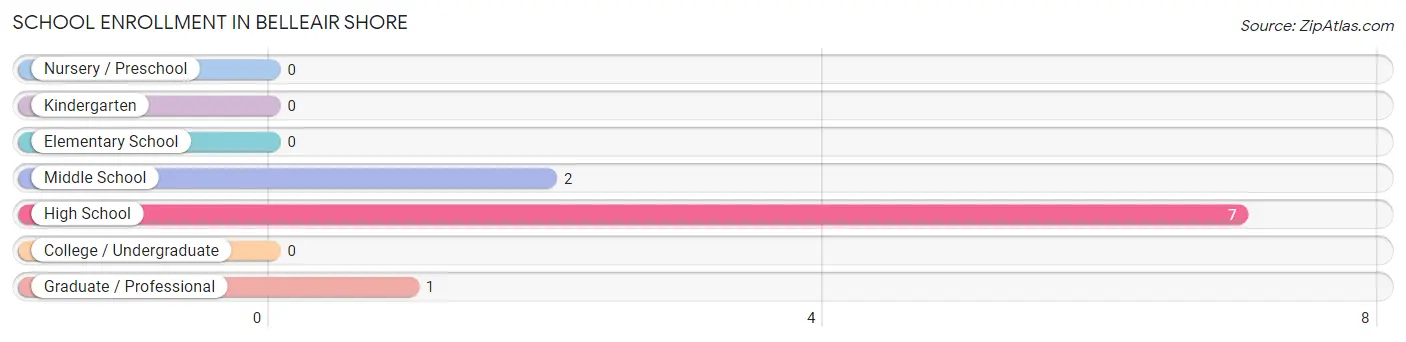
| School Level | # Students | % Students |
| Nursery / Preschool | 0 | 0.0% |
| Kindergarten | 0 | 0.0% |
| Elementary School | 0 | 0.0% |
| Middle School | 2 | 20.0% |
| High School | 7 | 70.0% |
| College / Undergraduate | 0 | 0.0% |
| Graduate / Professional | 1 | 10.0% |
| Total | 10 | 100.0% |
School Enrollment by Age by Funding Source in Belleair Shore
Out of a total of 10 students who are enrolled in schools in Belleair Shore, 8 (80.0%) attend a private institution, while the remaining 2 (20.0%) are enrolled in public schools. The age group of 10 to 14 year olds has the highest likelihood of being enrolled in private schools, with 4 (100.0% in the age bracket) enrolled. Conversely, the age group of 35 years and over has the lowest likelihood of being enrolled in a private school, with 1 (100.0% in the age bracket) attending a public institution.
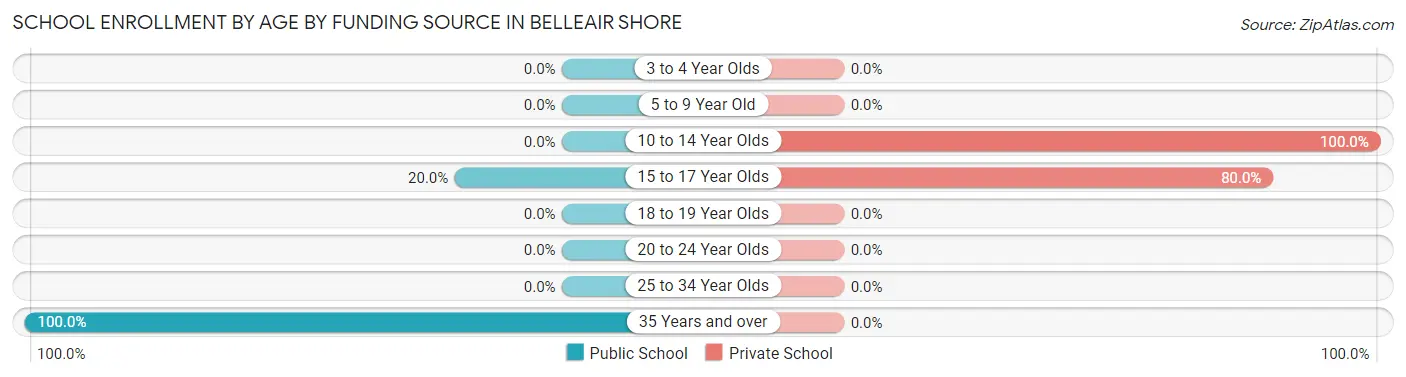
| Age Bracket | Public School | Private School |
| 3 to 4 Year Olds | 0 (0.0%) | 0 (0.0%) |
| 5 to 9 Year Old | 0 (0.0%) | 0 (0.0%) |
| 10 to 14 Year Olds | 0 (0.0%) | 4 (100.0%) |
| 15 to 17 Year Olds | 1 (20.0%) | 4 (80.0%) |
| 18 to 19 Year Olds | 0 (0.0%) | 0 (0.0%) |
| 20 to 24 Year Olds | 0 (0.0%) | 0 (0.0%) |
| 25 to 34 Year Olds | 0 (0.0%) | 0 (0.0%) |
| 35 Years and over | 1 (100.0%) | 0 (0.0%) |
| Total | 2 (20.0%) | 8 (80.0%) |
Educational Attainment by Field of Study in Belleair Shore
Business (13 | 48.1%), social sciences (3 | 11.1%), engineering (2 | 7.4%), education (2 | 7.4%), and literature & languages (2 | 7.4%) are the most common fields of study among 27 individuals in Belleair Shore who have obtained a bachelor's degree or higher.
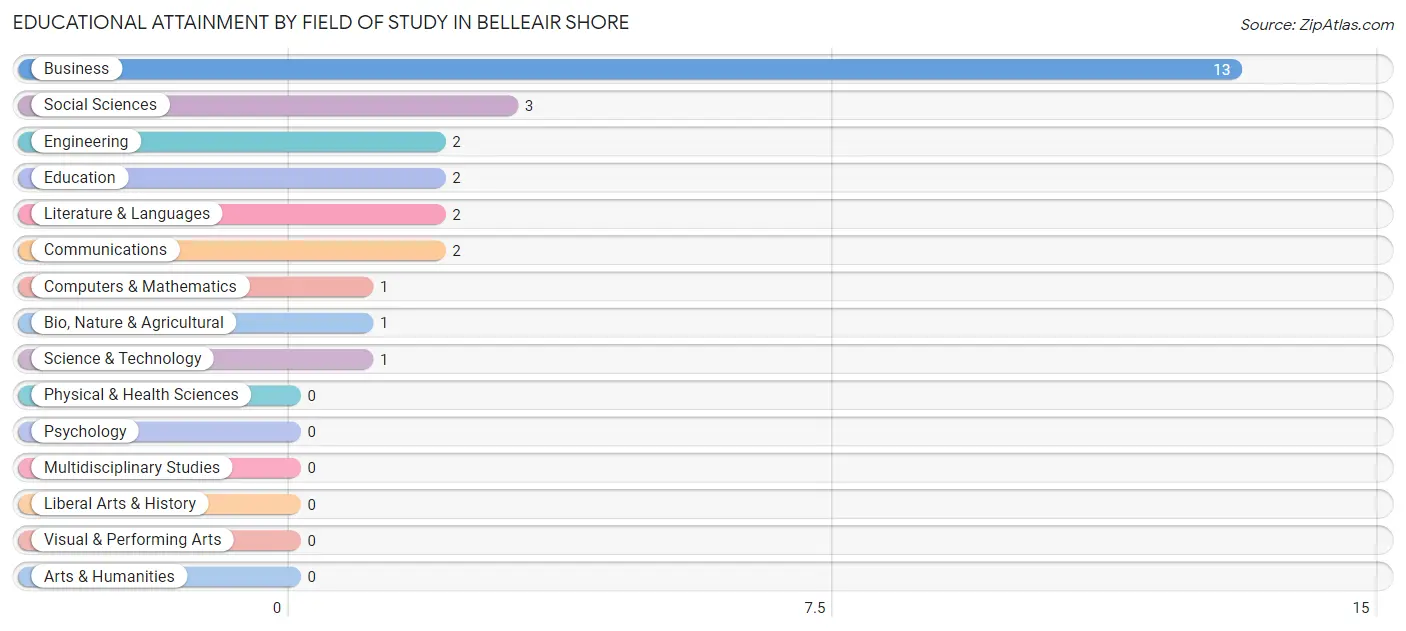
| Field of Study | # Graduates | % Graduates |
| Computers & Mathematics | 1 | 3.7% |
| Bio, Nature & Agricultural | 1 | 3.7% |
| Physical & Health Sciences | 0 | 0.0% |
| Psychology | 0 | 0.0% |
| Social Sciences | 3 | 11.1% |
| Engineering | 2 | 7.4% |
| Multidisciplinary Studies | 0 | 0.0% |
| Science & Technology | 1 | 3.7% |
| Business | 13 | 48.1% |
| Education | 2 | 7.4% |
| Literature & Languages | 2 | 7.4% |
| Liberal Arts & History | 0 | 0.0% |
| Visual & Performing Arts | 0 | 0.0% |
| Communications | 2 | 7.4% |
| Arts & Humanities | 0 | 0.0% |
| Total | 27 | 100.0% |
Transportation & Commute in Belleair Shore
Vehicle Availability by Sex in Belleair Shore
The most prevalent vehicle ownership categories in Belleair Shore are males with 3 vehicles (16, accounting for 84.2%) and females with 3 vehicles (9, making up 160.0%).
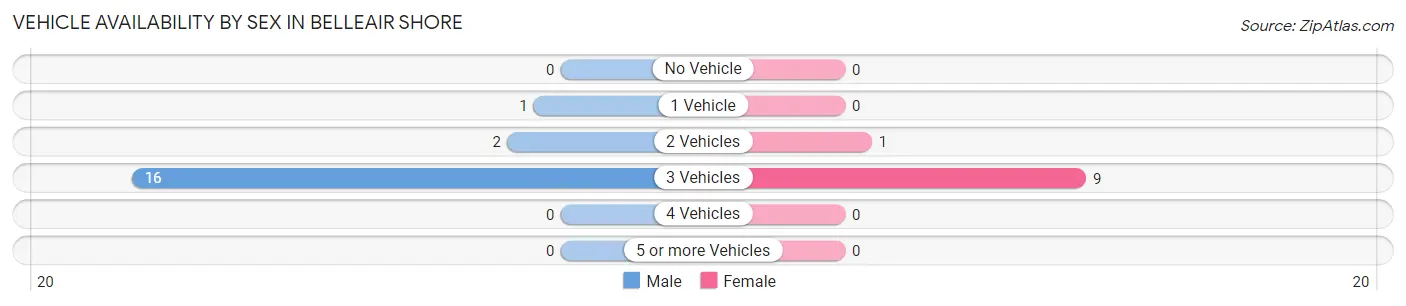
| Vehicles Available | Male | Female |
| No Vehicle | 0 (0.0%) | 0 (0.0%) |
| 1 Vehicle | 1 (5.3%) | 0 (0.0%) |
| 2 Vehicles | 2 (10.5%) | 1 (10.0%) |
| 3 Vehicles | 16 (84.2%) | 9 (90.0%) |
| 4 Vehicles | 0 (0.0%) | 0 (0.0%) |
| 5 or more Vehicles | 0 (0.0%) | 0 (0.0%) |
| Total | 19 (100.0%) | 10 (100.0%) |
Commute Time in Belleair Shore
The most frequently occuring commute durations in Belleair Shore are 20 to 24 minutes (3 commuters, 42.9%), 15 to 19 minutes (2 commuters, 28.6%), and 25 to 29 minutes (2 commuters, 28.6%).
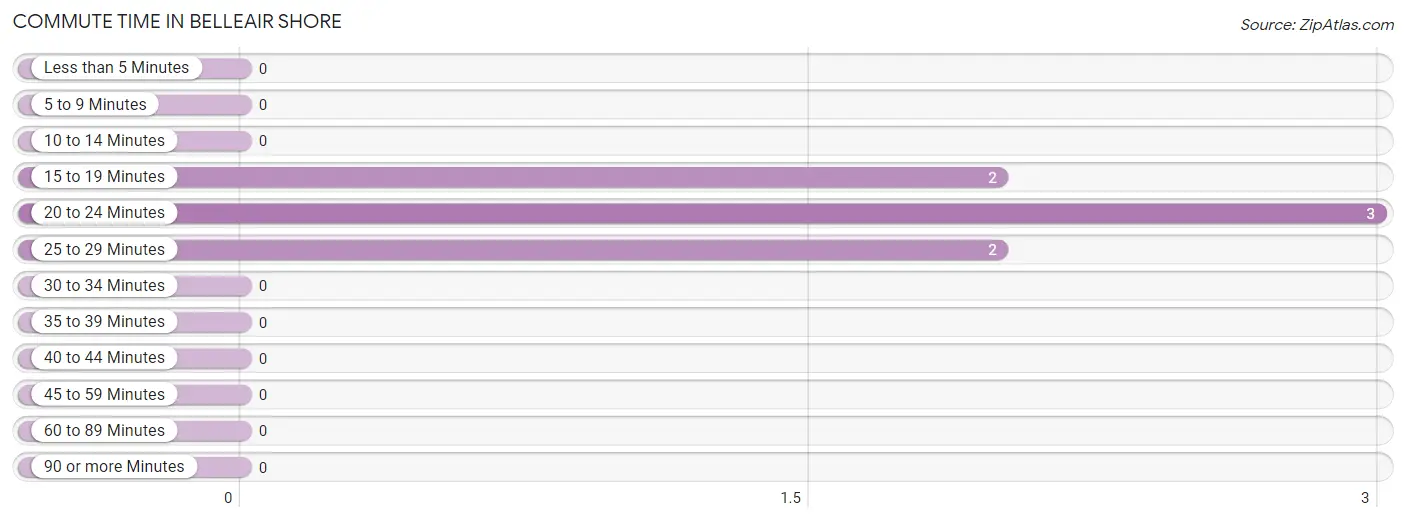
| Commute Time | # Commuters | % Commuters |
| Less than 5 Minutes | 0 | 0.0% |
| 5 to 9 Minutes | 0 | 0.0% |
| 10 to 14 Minutes | 0 | 0.0% |
| 15 to 19 Minutes | 2 | 28.6% |
| 20 to 24 Minutes | 3 | 42.9% |
| 25 to 29 Minutes | 2 | 28.6% |
| 30 to 34 Minutes | 0 | 0.0% |
| 35 to 39 Minutes | 0 | 0.0% |
| 40 to 44 Minutes | 0 | 0.0% |
| 45 to 59 Minutes | 0 | 0.0% |
| 60 to 89 Minutes | 0 | 0.0% |
| 90 or more Minutes | 0 | 0.0% |
Commute Time by Sex in Belleair Shore
The most common commute times in Belleair Shore are 15 to 19 minutes (2 commuters, 40.0%) for males and 20 to 24 minutes (1 commuters, 50.0%) for females.
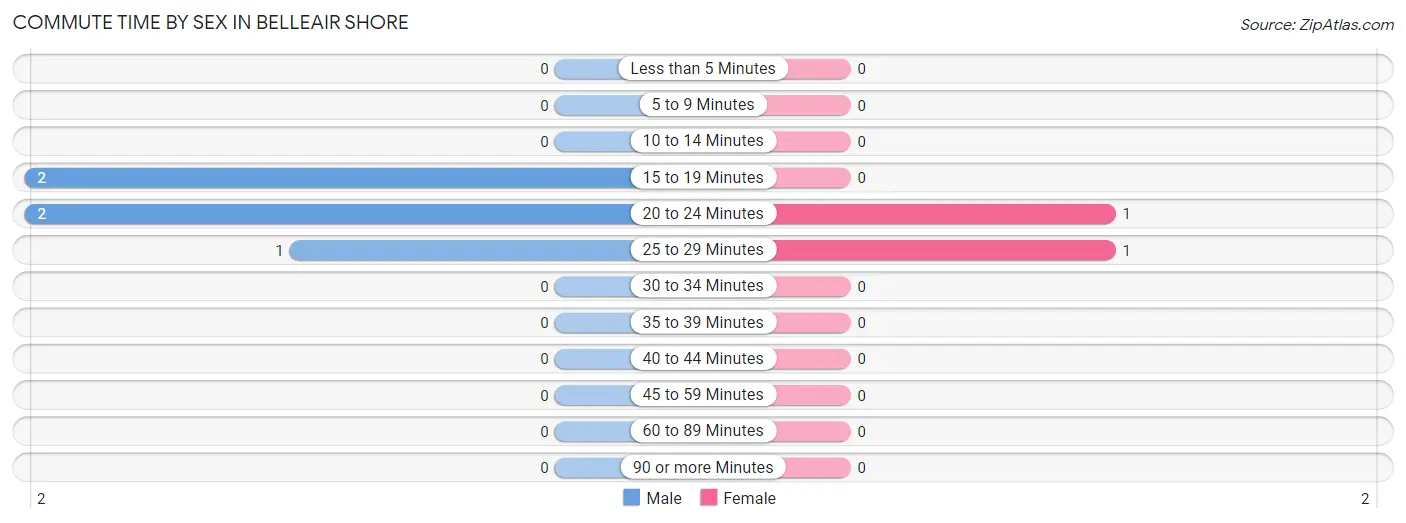
| Commute Time | Male | Female |
| Less than 5 Minutes | 0 (0.0%) | 0 (0.0%) |
| 5 to 9 Minutes | 0 (0.0%) | 0 (0.0%) |
| 10 to 14 Minutes | 0 (0.0%) | 0 (0.0%) |
| 15 to 19 Minutes | 2 (40.0%) | 0 (0.0%) |
| 20 to 24 Minutes | 2 (40.0%) | 1 (50.0%) |
| 25 to 29 Minutes | 1 (20.0%) | 1 (50.0%) |
| 30 to 34 Minutes | 0 (0.0%) | 0 (0.0%) |
| 35 to 39 Minutes | 0 (0.0%) | 0 (0.0%) |
| 40 to 44 Minutes | 0 (0.0%) | 0 (0.0%) |
| 45 to 59 Minutes | 0 (0.0%) | 0 (0.0%) |
| 60 to 89 Minutes | 0 (0.0%) | 0 (0.0%) |
| 90 or more Minutes | 0 (0.0%) | 0 (0.0%) |
Time of Departure to Work by Sex in Belleair Shore
The most frequent times of departure to work in Belleair Shore are 8:30 AM to 8:59 AM (3, 60.0%) for males and 6:00 AM to 6:29 AM (1, 50.0%) for females.
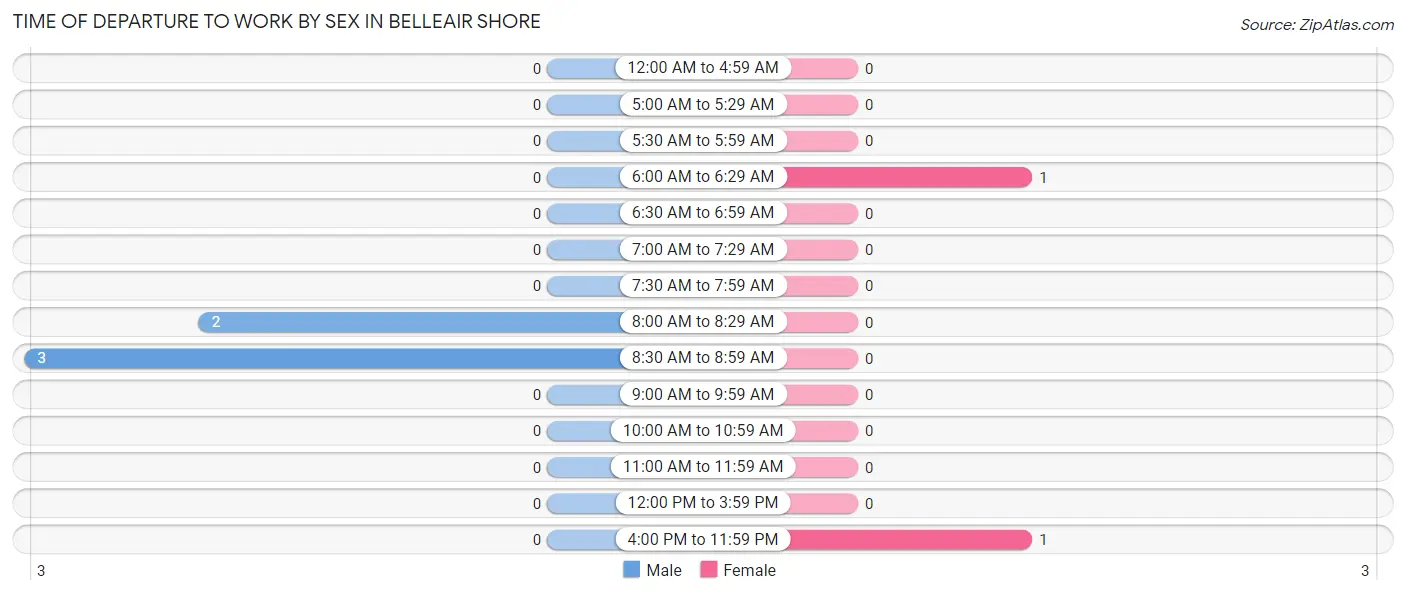
| Time of Departure | Male | Female |
| 12:00 AM to 4:59 AM | 0 (0.0%) | 0 (0.0%) |
| 5:00 AM to 5:29 AM | 0 (0.0%) | 0 (0.0%) |
| 5:30 AM to 5:59 AM | 0 (0.0%) | 0 (0.0%) |
| 6:00 AM to 6:29 AM | 0 (0.0%) | 1 (50.0%) |
| 6:30 AM to 6:59 AM | 0 (0.0%) | 0 (0.0%) |
| 7:00 AM to 7:29 AM | 0 (0.0%) | 0 (0.0%) |
| 7:30 AM to 7:59 AM | 0 (0.0%) | 0 (0.0%) |
| 8:00 AM to 8:29 AM | 2 (40.0%) | 0 (0.0%) |
| 8:30 AM to 8:59 AM | 3 (60.0%) | 0 (0.0%) |
| 9:00 AM to 9:59 AM | 0 (0.0%) | 0 (0.0%) |
| 10:00 AM to 10:59 AM | 0 (0.0%) | 0 (0.0%) |
| 11:00 AM to 11:59 AM | 0 (0.0%) | 0 (0.0%) |
| 12:00 PM to 3:59 PM | 0 (0.0%) | 0 (0.0%) |
| 4:00 PM to 11:59 PM | 0 (0.0%) | 1 (50.0%) |
| Total | 5 (100.0%) | 2 (100.0%) |
Housing Occupancy in Belleair Shore
Occupancy by Ownership in Belleair Shore
Of the total 28 dwellings in Belleair Shore, owner-occupied units account for 28 (100.0%), while renter-occupied units make up 0 (0.0%).
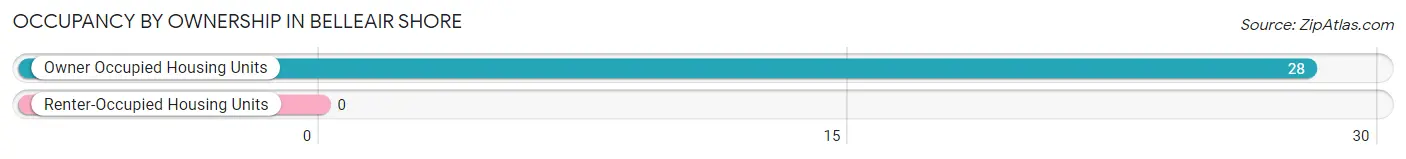
| Occupancy | # Housing Units | % Housing Units |
| Owner Occupied Housing Units | 28 | 100.0% |
| Renter-Occupied Housing Units | 0 | 0.0% |
| Total Occupied Housing Units | 28 | 100.0% |
Occupancy by Household Size in Belleair Shore
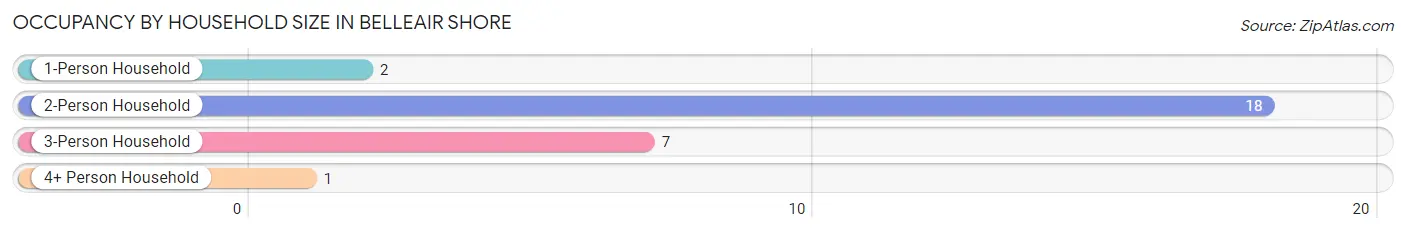
| Household Size | # Housing Units | % Housing Units |
| 1-Person Household | 2 | 7.1% |
| 2-Person Household | 18 | 64.3% |
| 3-Person Household | 7 | 25.0% |
| 4+ Person Household | 1 | 3.6% |
| Total Housing Units | 28 | 100.0% |
Occupancy by Ownership by Household Size in Belleair Shore
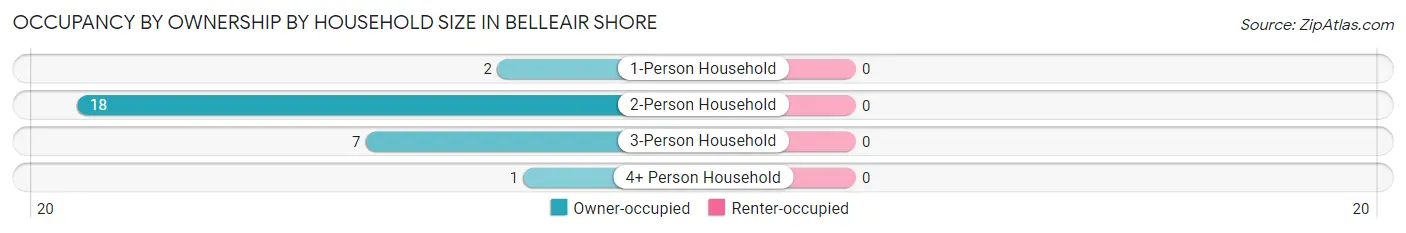
| Household Size | Owner-occupied | Renter-occupied |
| 1-Person Household | 2 (100.0%) | 0 (0.0%) |
| 2-Person Household | 18 (100.0%) | 0 (0.0%) |
| 3-Person Household | 7 (100.0%) | 0 (0.0%) |
| 4+ Person Household | 1 (100.0%) | 0 (0.0%) |
| Total Housing Units | 28 (100.0%) | 0 (0.0%) |
Occupancy by Educational Attainment in Belleair Shore
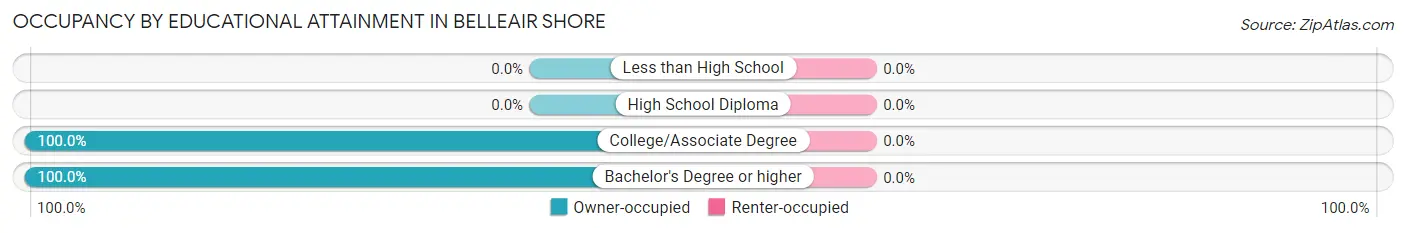
| Household Size | Owner-occupied | Renter-occupied |
| Less than High School | 0 (0.0%) | 0 (0.0%) |
| High School Diploma | 0 (0.0%) | 0 (0.0%) |
| College/Associate Degree | 13 (100.0%) | 0 (0.0%) |
| Bachelor's Degree or higher | 15 (100.0%) | 0 (0.0%) |
Occupancy by Age of Householder in Belleair Shore
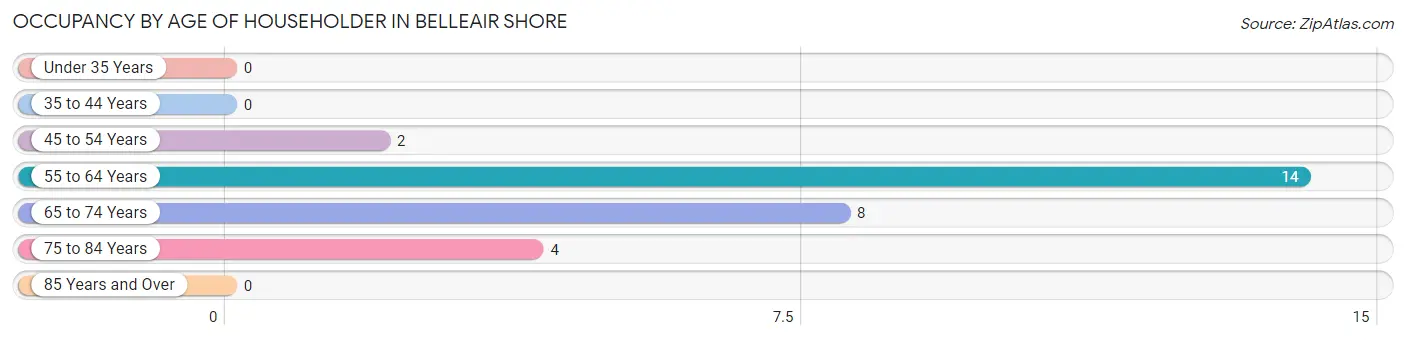
| Age Bracket | # Households | % Households |
| Under 35 Years | 0 | 0.0% |
| 35 to 44 Years | 0 | 0.0% |
| 45 to 54 Years | 2 | 7.1% |
| 55 to 64 Years | 14 | 50.0% |
| 65 to 74 Years | 8 | 28.6% |
| 75 to 84 Years | 4 | 14.3% |
| 85 Years and Over | 0 | 0.0% |
| Total | 28 | 100.0% |
Housing Finances in Belleair Shore
Median Income by Occupancy in Belleair Shore
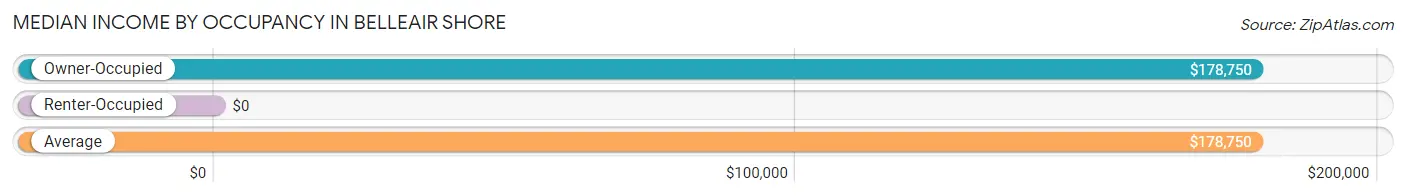
| Occupancy Type | # Households | Median Income |
| Owner-Occupied | 28 (100.0%) | $178,750 |
| Renter-Occupied | 0 (0.0%) | $0 |
| Average | 28 (100.0%) | $178,750 |
Occupancy by Householder Income Bracket in Belleair Shore
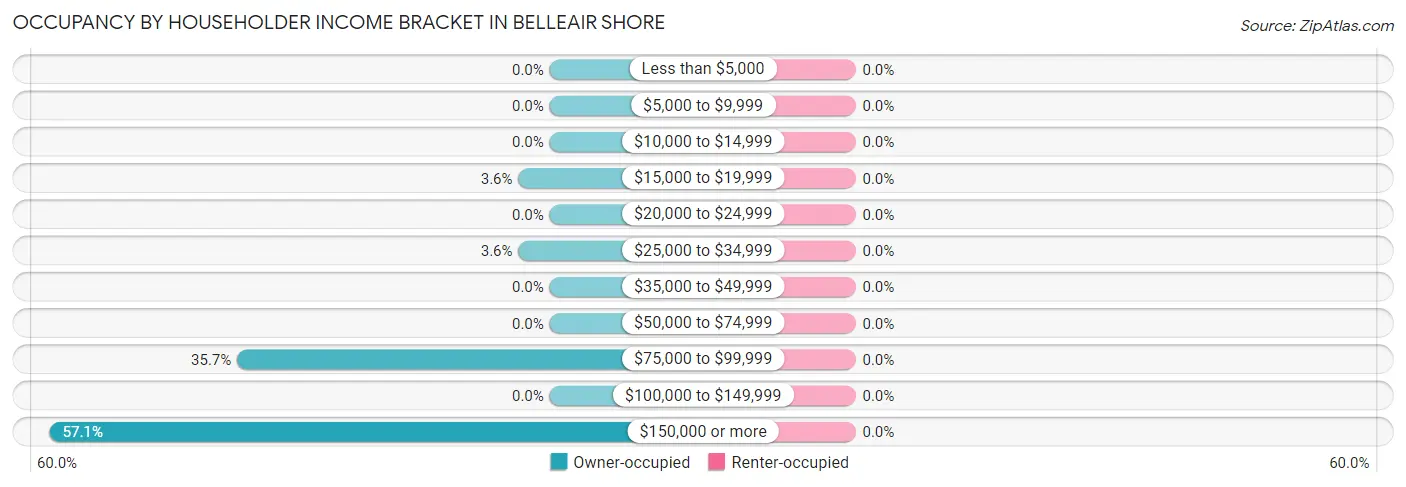
| Income Bracket | Owner-occupied | Renter-occupied |
| Less than $5,000 | 0 (0.0%) | 0 (0.0%) |
| $5,000 to $9,999 | 0 (0.0%) | 0 (0.0%) |
| $10,000 to $14,999 | 0 (0.0%) | 0 (0.0%) |
| $15,000 to $19,999 | 1 (3.6%) | 0 (0.0%) |
| $20,000 to $24,999 | 0 (0.0%) | 0 (0.0%) |
| $25,000 to $34,999 | 1 (3.6%) | 0 (0.0%) |
| $35,000 to $49,999 | 0 (0.0%) | 0 (0.0%) |
| $50,000 to $74,999 | 0 (0.0%) | 0 (0.0%) |
| $75,000 to $99,999 | 10 (35.7%) | 0 (0.0%) |
| $100,000 to $149,999 | 0 (0.0%) | 0 (0.0%) |
| $150,000 or more | 16 (57.1%) | 0 (0.0%) |
| Total | 28 (100.0%) | 0 (0.0%) |
Monthly Housing Cost Tiers in Belleair Shore
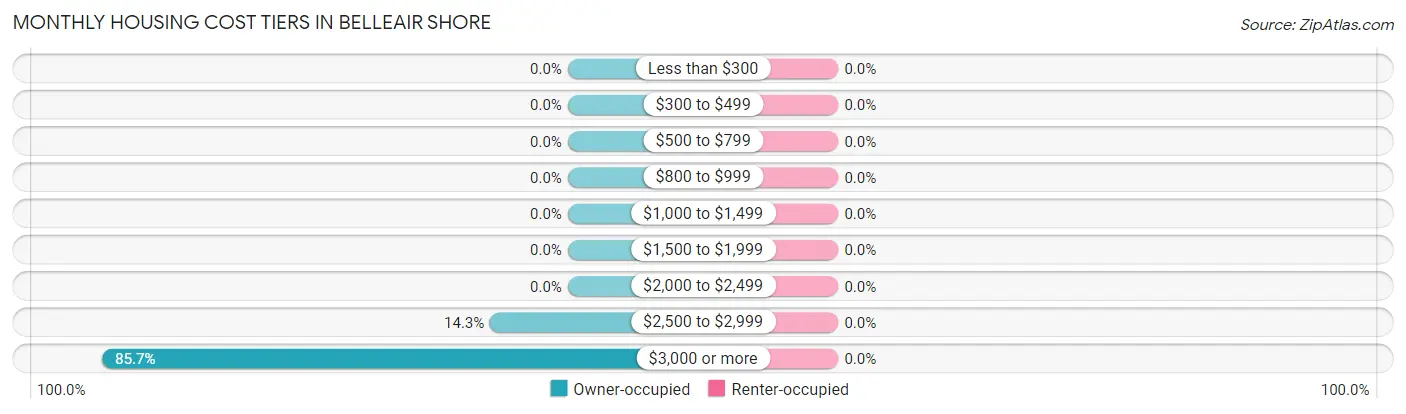
| Monthly Cost | Owner-occupied | Renter-occupied |
| Less than $300 | 0 (0.0%) | 0 (0.0%) |
| $300 to $499 | 0 (0.0%) | 0 (0.0%) |
| $500 to $799 | 0 (0.0%) | 0 (0.0%) |
| $800 to $999 | 0 (0.0%) | 0 (0.0%) |
| $1,000 to $1,499 | 0 (0.0%) | 0 (0.0%) |
| $1,500 to $1,999 | 0 (0.0%) | 0 (0.0%) |
| $2,000 to $2,499 | 0 (0.0%) | 0 (0.0%) |
| $2,500 to $2,999 | 4 (14.3%) | 0 (0.0%) |
| $3,000 or more | 24 (85.7%) | 0 (0.0%) |
| Total | 28 (100.0%) | 0 (0.0%) |
Physical Housing Characteristics in Belleair Shore
Housing Structures in Belleair Shore
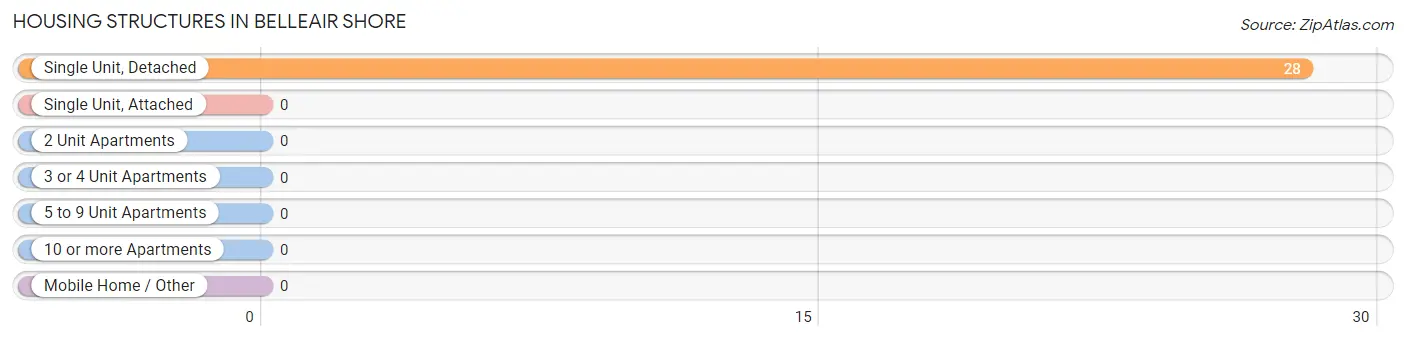
| Structure Type | # Housing Units | % Housing Units |
| Single Unit, Detached | 28 | 100.0% |
| Single Unit, Attached | 0 | 0.0% |
| 2 Unit Apartments | 0 | 0.0% |
| 3 or 4 Unit Apartments | 0 | 0.0% |
| 5 to 9 Unit Apartments | 0 | 0.0% |
| 10 or more Apartments | 0 | 0.0% |
| Mobile Home / Other | 0 | 0.0% |
| Total | 28 | 100.0% |
Housing Structures by Occupancy in Belleair Shore
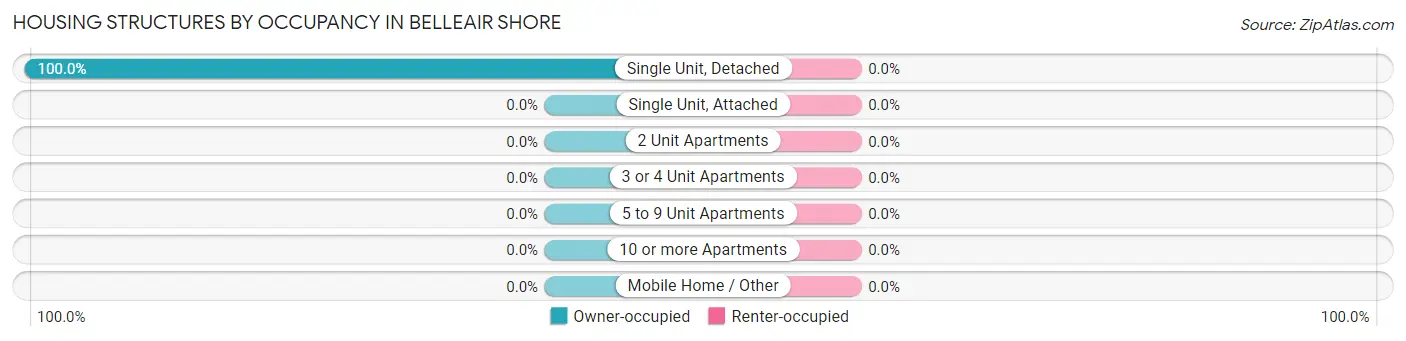
| Structure Type | Owner-occupied | Renter-occupied |
| Single Unit, Detached | 28 (100.0%) | 0 (0.0%) |
| Single Unit, Attached | 0 (0.0%) | 0 (0.0%) |
| 2 Unit Apartments | 0 (0.0%) | 0 (0.0%) |
| 3 or 4 Unit Apartments | 0 (0.0%) | 0 (0.0%) |
| 5 to 9 Unit Apartments | 0 (0.0%) | 0 (0.0%) |
| 10 or more Apartments | 0 (0.0%) | 0 (0.0%) |
| Mobile Home / Other | 0 (0.0%) | 0 (0.0%) |
| Total | 28 (100.0%) | 0 (0.0%) |
Housing Structures by Number of Rooms in Belleair Shore
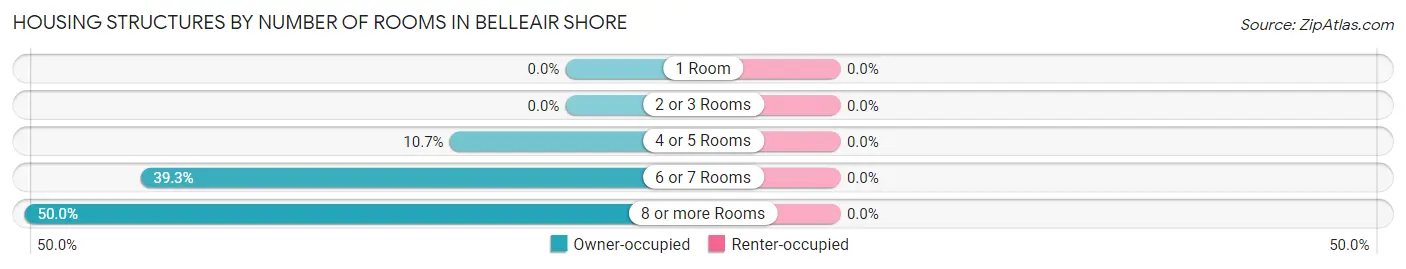
| Number of Rooms | Owner-occupied | Renter-occupied |
| 1 Room | 0 (0.0%) | 0 (0.0%) |
| 2 or 3 Rooms | 0 (0.0%) | 0 (0.0%) |
| 4 or 5 Rooms | 3 (10.7%) | 0 (0.0%) |
| 6 or 7 Rooms | 11 (39.3%) | 0 (0.0%) |
| 8 or more Rooms | 14 (50.0%) | 0 (0.0%) |
| Total | 28 (100.0%) | 0 (0.0%) |
Housing Structure by Heating Type in Belleair Shore
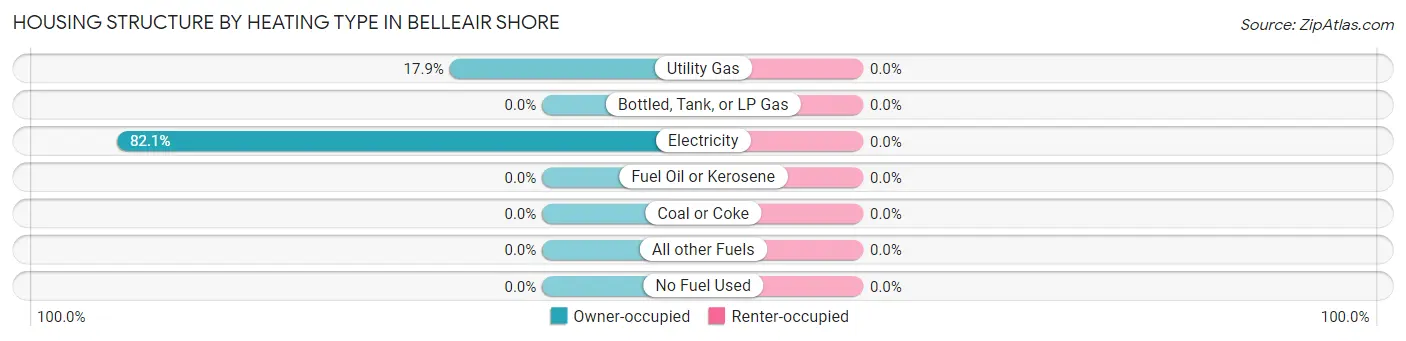
| Heating Type | Owner-occupied | Renter-occupied |
| Utility Gas | 5 (17.9%) | 0 (0.0%) |
| Bottled, Tank, or LP Gas | 0 (0.0%) | 0 (0.0%) |
| Electricity | 23 (82.1%) | 0 (0.0%) |
| Fuel Oil or Kerosene | 0 (0.0%) | 0 (0.0%) |
| Coal or Coke | 0 (0.0%) | 0 (0.0%) |
| All other Fuels | 0 (0.0%) | 0 (0.0%) |
| No Fuel Used | 0 (0.0%) | 0 (0.0%) |
| Total | 28 (100.0%) | 0 (0.0%) |
Household Vehicle Usage in Belleair Shore
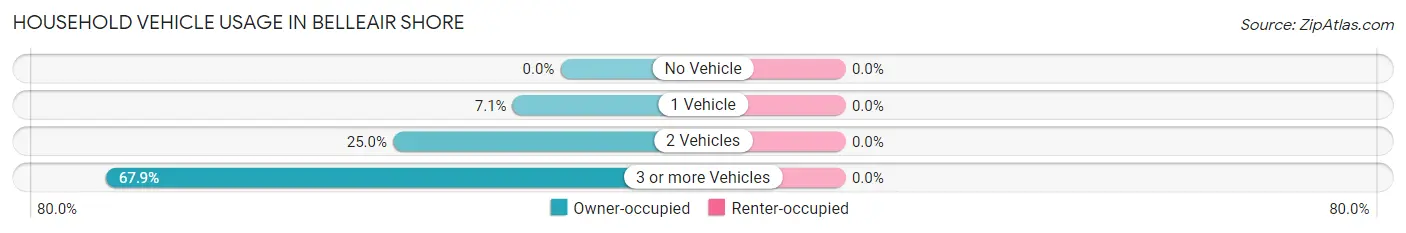
| Vehicles per Household | Owner-occupied | Renter-occupied |
| No Vehicle | 0 (0.0%) | 0 (0.0%) |
| 1 Vehicle | 2 (7.1%) | 0 (0.0%) |
| 2 Vehicles | 7 (25.0%) | 0 (0.0%) |
| 3 or more Vehicles | 19 (67.9%) | 0 (0.0%) |
| Total | 28 (100.0%) | 0 (0.0%) |
Real Estate & Mortgages in Belleair Shore
Real Estate and Mortgage Overview in Belleair Shore
| Characteristic | Without Mortgage | With Mortgage |
| Housing Units | 18 | 10 |
| Median Property Value | $2,000,001 | $2,000,001 |
| Median Household Income | $93,929 | $10 |
| Monthly Housing Costs | $1,501 | $10 |
| Real Estate Taxes | $10,001 | $0 |
Property Value by Mortgage Status in Belleair Shore
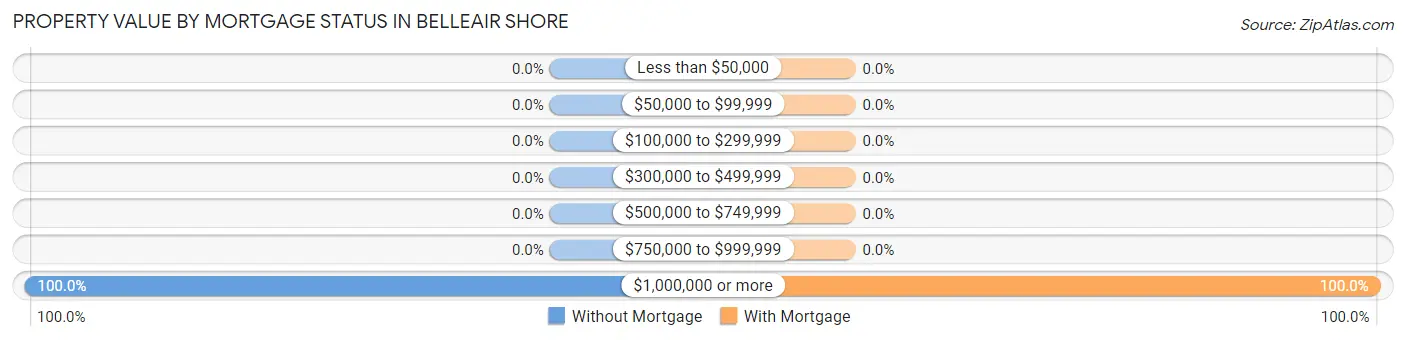
| Property Value | Without Mortgage | With Mortgage |
| Less than $50,000 | 0 (0.0%) | 0 (0.0%) |
| $50,000 to $99,999 | 0 (0.0%) | 0 (0.0%) |
| $100,000 to $299,999 | 0 (0.0%) | 0 (0.0%) |
| $300,000 to $499,999 | 0 (0.0%) | 0 (0.0%) |
| $500,000 to $749,999 | 0 (0.0%) | 0 (0.0%) |
| $750,000 to $999,999 | 0 (0.0%) | 0 (0.0%) |
| $1,000,000 or more | 18 (100.0%) | 10 (100.0%) |
| Total | 18 (100.0%) | 10 (100.0%) |
Household Income by Mortgage Status in Belleair Shore
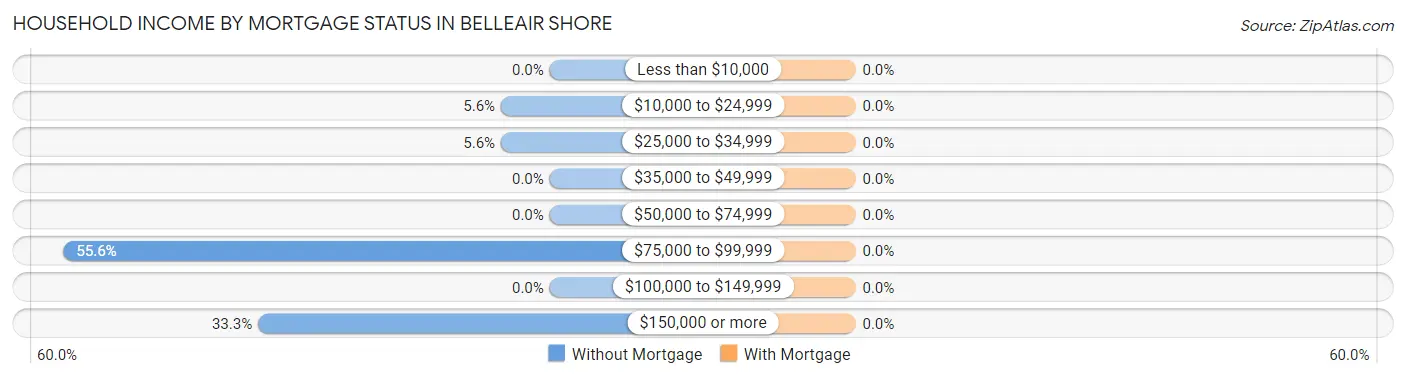
| Household Income | Without Mortgage | With Mortgage |
| Less than $10,000 | 0 (0.0%) | 0 (0.0%) |
| $10,000 to $24,999 | 1 (5.6%) | 0 (0.0%) |
| $25,000 to $34,999 | 1 (5.6%) | 0 (0.0%) |
| $35,000 to $49,999 | 0 (0.0%) | 0 (0.0%) |
| $50,000 to $74,999 | 0 (0.0%) | 0 (0.0%) |
| $75,000 to $99,999 | 10 (55.6%) | 0 (0.0%) |
| $100,000 to $149,999 | 0 (0.0%) | 0 (0.0%) |
| $150,000 or more | 6 (33.3%) | 0 (0.0%) |
| Total | 18 (100.0%) | 10 (100.0%) |
Property Value to Household Income Ratio in Belleair Shore
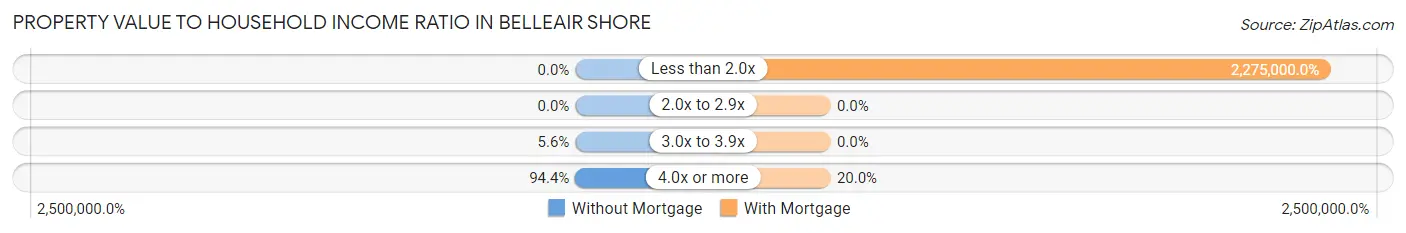
| Value-to-Income Ratio | Without Mortgage | With Mortgage |
| Less than 2.0x | 0 (0.0%) | 227,500 (2,275,000.0%) |
| 2.0x to 2.9x | 0 (0.0%) | 0 (0.0%) |
| 3.0x to 3.9x | 1 (5.6%) | 0 (0.0%) |
| 4.0x or more | 17 (94.4%) | 2 (20.0%) |
| Total | 18 (100.0%) | 10 (100.0%) |
Real Estate Taxes by Mortgage Status in Belleair Shore
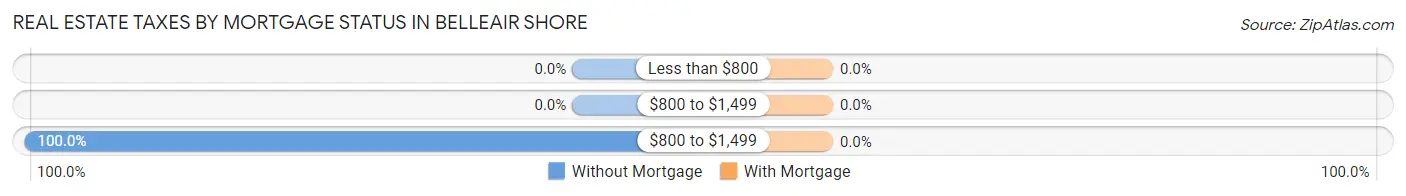
| Property Taxes | Without Mortgage | With Mortgage |
| Less than $800 | 0 (0.0%) | 0 (0.0%) |
| $800 to $1,499 | 0 (0.0%) | 0 (0.0%) |
| $800 to $1,499 | 18 (100.0%) | 0 (0.0%) |
| Total | 18 (100.0%) | 10 (100.0%) |
Health & Disability in Belleair Shore
Health Insurance Coverage by Age in Belleair Shore
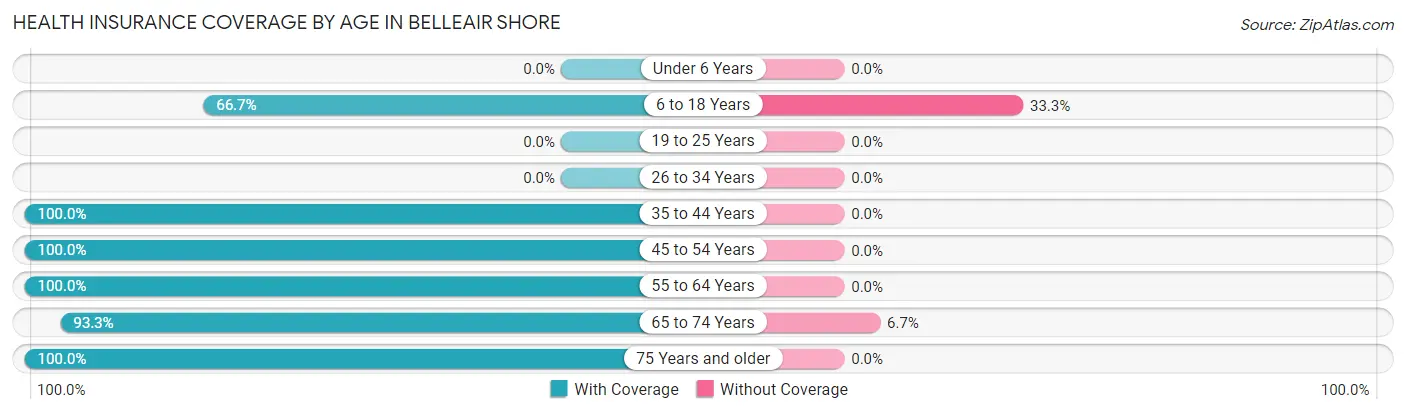
| Age Bracket | With Coverage | Without Coverage |
| Under 6 Years | 0 (0.0%) | 0 (0.0%) |
| 6 to 18 Years | 6 (66.7%) | 3 (33.3%) |
| 19 to 25 Years | 0 (0.0%) | 0 (0.0%) |
| 26 to 34 Years | 0 (0.0%) | 0 (0.0%) |
| 35 to 44 Years | 1 (100.0%) | 0 (0.0%) |
| 45 to 54 Years | 3 (100.0%) | 0 (0.0%) |
| 55 to 64 Years | 28 (100.0%) | 0 (0.0%) |
| 65 to 74 Years | 14 (93.3%) | 1 (6.7%) |
| 75 Years and older | 11 (100.0%) | 0 (0.0%) |
| Total | 63 (94.0%) | 4 (6.0%) |
Health Insurance Coverage by Citizenship Status in Belleair Shore
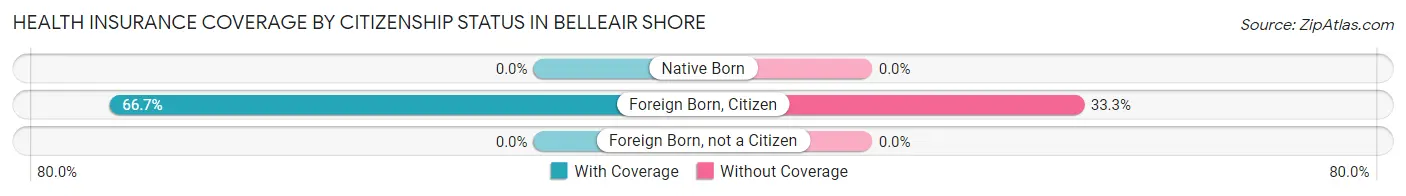
| Citizenship Status | With Coverage | Without Coverage |
| Native Born | 0 (0.0%) | 0 (0.0%) |
| Foreign Born, Citizen | 6 (66.7%) | 3 (33.3%) |
| Foreign Born, not a Citizen | 0 (0.0%) | 0 (0.0%) |
Health Insurance Coverage by Household Income in Belleair Shore
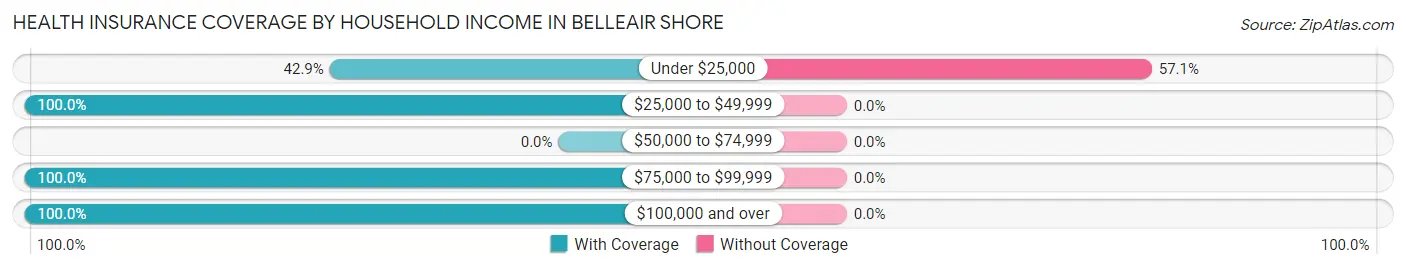
| Household Income | With Coverage | Without Coverage |
| Under $25,000 | 3 (42.9%) | 4 (57.1%) |
| $25,000 to $49,999 | 3 (100.0%) | 0 (0.0%) |
| $50,000 to $74,999 | 0 (0.0%) | 0 (0.0%) |
| $75,000 to $99,999 | 24 (100.0%) | 0 (0.0%) |
| $100,000 and over | 33 (100.0%) | 0 (0.0%) |
Public vs Private Health Insurance Coverage by Age in Belleair Shore
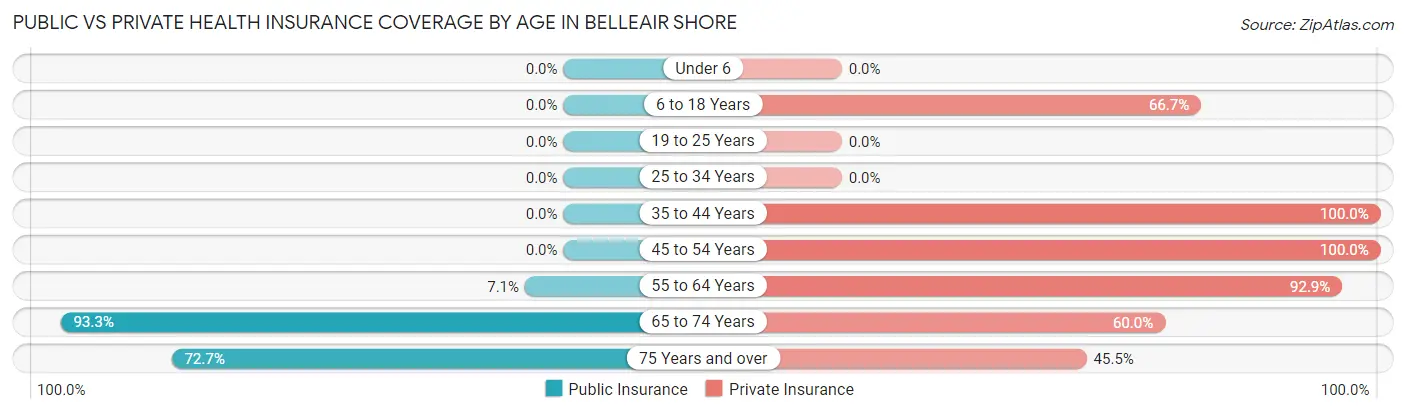
| Age Bracket | Public Insurance | Private Insurance |
| Under 6 | 0 (0.0%) | 0 (0.0%) |
| 6 to 18 Years | 0 (0.0%) | 6 (66.7%) |
| 19 to 25 Years | 0 (0.0%) | 0 (0.0%) |
| 25 to 34 Years | 0 (0.0%) | 0 (0.0%) |
| 35 to 44 Years | 0 (0.0%) | 1 (100.0%) |
| 45 to 54 Years | 0 (0.0%) | 3 (100.0%) |
| 55 to 64 Years | 2 (7.1%) | 26 (92.9%) |
| 65 to 74 Years | 14 (93.3%) | 9 (60.0%) |
| 75 Years and over | 8 (72.7%) | 5 (45.5%) |
| Total | 24 (35.8%) | 50 (74.6%) |
Disability Status by Sex by Age in Belleair Shore
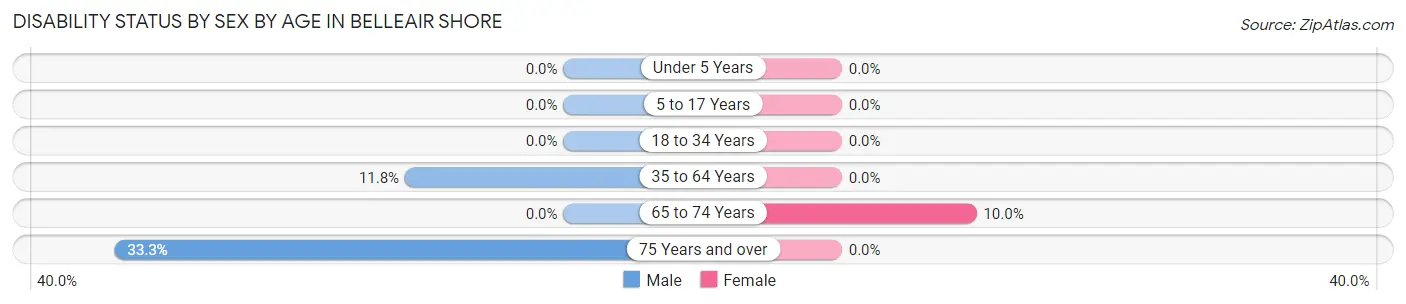
| Age Bracket | Male | Female |
| Under 5 Years | 0 (0.0%) | 0 (0.0%) |
| 5 to 17 Years | 0 (0.0%) | 0 (0.0%) |
| 18 to 34 Years | 0 (0.0%) | 0 (0.0%) |
| 35 to 64 Years | 2 (11.8%) | 0 (0.0%) |
| 65 to 74 Years | 0 (0.0%) | 1 (10.0%) |
| 75 Years and over | 2 (33.3%) | 0 (0.0%) |
Disability Class by Sex by Age in Belleair Shore
Disability Class: Hearing Difficulty
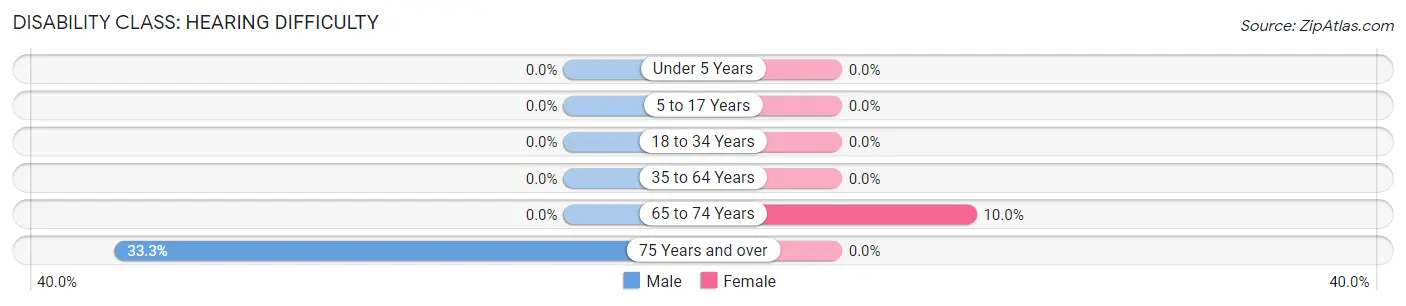
| Age Bracket | Male | Female |
| Under 5 Years | 0 (0.0%) | 0 (0.0%) |
| 5 to 17 Years | 0 (0.0%) | 0 (0.0%) |
| 18 to 34 Years | 0 (0.0%) | 0 (0.0%) |
| 35 to 64 Years | 0 (0.0%) | 0 (0.0%) |
| 65 to 74 Years | 0 (0.0%) | 1 (10.0%) |
| 75 Years and over | 2 (33.3%) | 0 (0.0%) |
Disability Class: Vision Difficulty
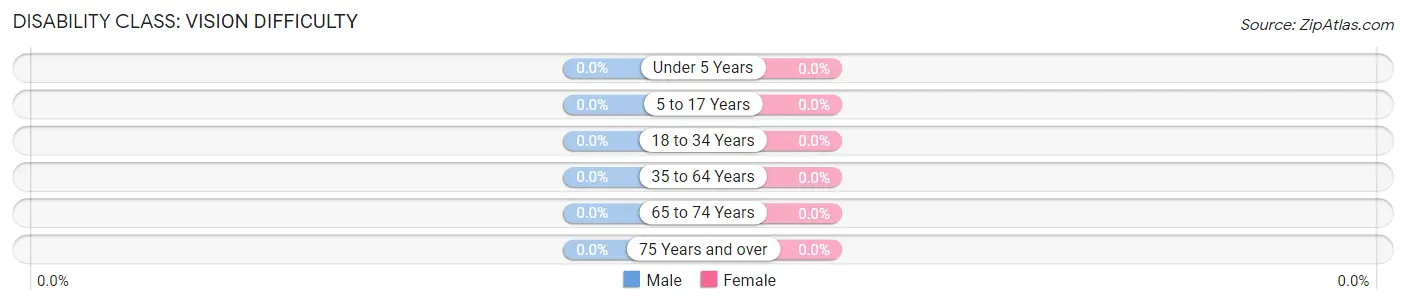
| Age Bracket | Male | Female |
| Under 5 Years | 0 (0.0%) | 0 (0.0%) |
| 5 to 17 Years | 0 (0.0%) | 0 (0.0%) |
| 18 to 34 Years | 0 (0.0%) | 0 (0.0%) |
| 35 to 64 Years | 0 (0.0%) | 0 (0.0%) |
| 65 to 74 Years | 0 (0.0%) | 0 (0.0%) |
| 75 Years and over | 0 (0.0%) | 0 (0.0%) |
Disability Class: Cognitive Difficulty
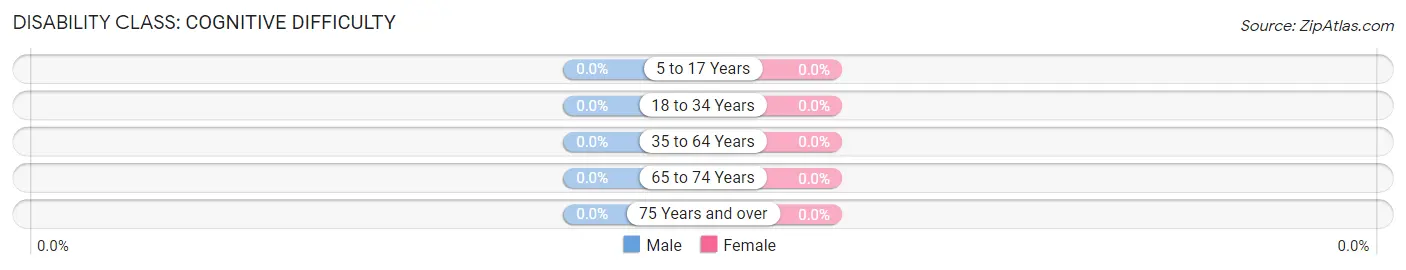
| Age Bracket | Male | Female |
| 5 to 17 Years | 0 (0.0%) | 0 (0.0%) |
| 18 to 34 Years | 0 (0.0%) | 0 (0.0%) |
| 35 to 64 Years | 0 (0.0%) | 0 (0.0%) |
| 65 to 74 Years | 0 (0.0%) | 0 (0.0%) |
| 75 Years and over | 0 (0.0%) | 0 (0.0%) |
Disability Class: Ambulatory Difficulty
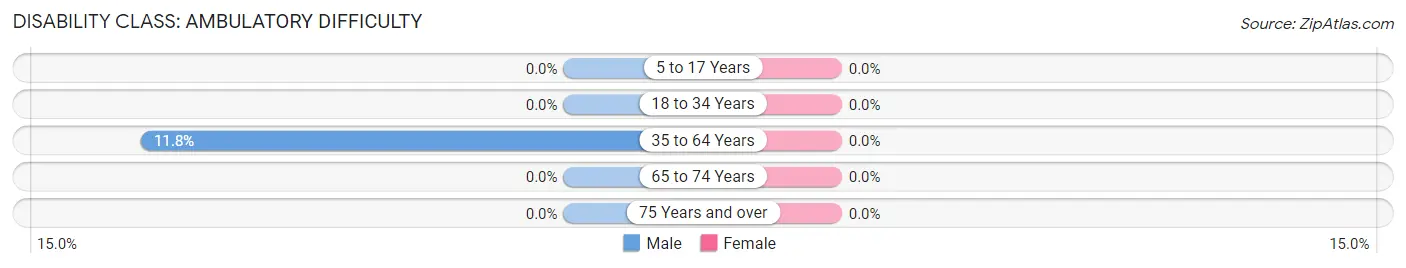
| Age Bracket | Male | Female |
| 5 to 17 Years | 0 (0.0%) | 0 (0.0%) |
| 18 to 34 Years | 0 (0.0%) | 0 (0.0%) |
| 35 to 64 Years | 2 (11.8%) | 0 (0.0%) |
| 65 to 74 Years | 0 (0.0%) | 0 (0.0%) |
| 75 Years and over | 0 (0.0%) | 0 (0.0%) |
Disability Class: Self-Care Difficulty
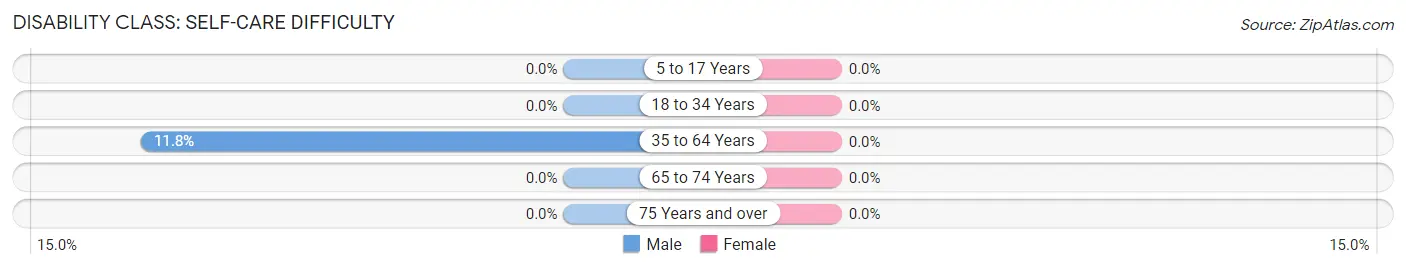
| Age Bracket | Male | Female |
| 5 to 17 Years | 0 (0.0%) | 0 (0.0%) |
| 18 to 34 Years | 0 (0.0%) | 0 (0.0%) |
| 35 to 64 Years | 2 (11.8%) | 0 (0.0%) |
| 65 to 74 Years | 0 (0.0%) | 0 (0.0%) |
| 75 Years and over | 0 (0.0%) | 0 (0.0%) |
Technology Access in Belleair Shore
Computing Device Access in Belleair Shore
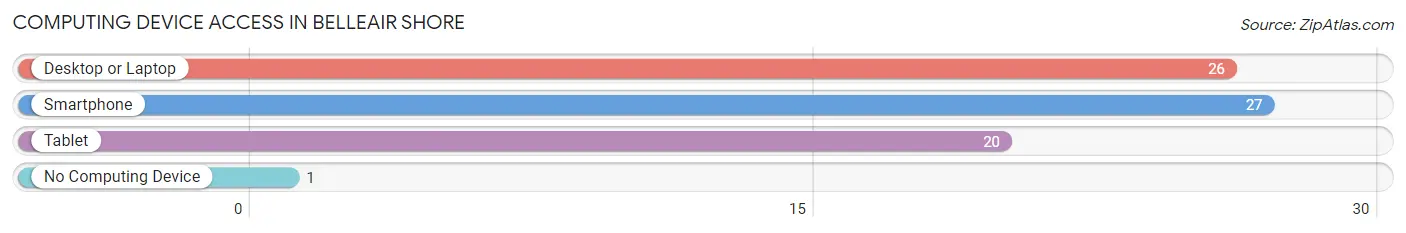
| Device Type | # Households | % Households |
| Desktop or Laptop | 26 | 92.9% |
| Smartphone | 27 | 96.4% |
| Tablet | 20 | 71.4% |
| No Computing Device | 1 | 3.6% |
| Total | 28 | 100.0% |
Internet Access in Belleair Shore
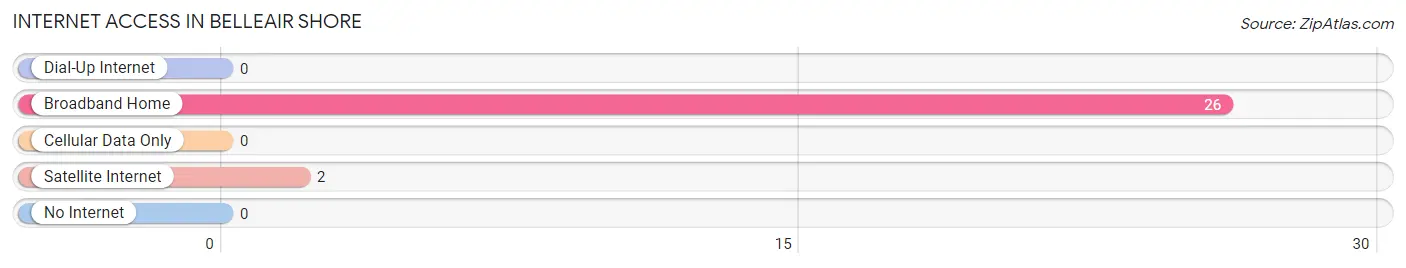
| Internet Type | # Households | % Households |
| Dial-Up Internet | 0 | 0.0% |
| Broadband Home | 26 | 92.9% |
| Cellular Data Only | 0 | 0.0% |
| Satellite Internet | 2 | 7.1% |
| No Internet | 0 | 0.0% |
| Total | 28 | 100.0% |
Belleair Shore Summary
Belleair Shore is a small town located in Pinellas County, Florida, United States. It is situated on the Gulf of Mexico, just south of Clearwater Beach. The town has a population of approximately 200 people and covers an area of 0.2 square miles.
Geography
Belleair Shore is located on the Gulf of Mexico, just south of Clearwater Beach. The town is situated on a barrier island, which is separated from the mainland by the Intracoastal Waterway. The town is bordered by the Gulf of Mexico to the west, the Intracoastal Waterway to the east, and the town of Belleair Beach to the north. The town is located approximately 25 miles west of Tampa and 25 miles north of St. Petersburg.
The town is characterized by its white sand beaches, which are popular with tourists and locals alike. The town also has a number of parks and recreational areas, including the Belleair Beach Park, which features a playground, picnic area, and a fishing pier.
History
Belleair Shore was first settled in the late 19th century by a group of fishermen from the nearby town of Belleair Beach. The town was officially incorporated in 1925 and was named after the nearby Belleair Beach.
In the early 20th century, the town was a popular destination for tourists, who would come to enjoy the white sand beaches and the warm Gulf waters. The town also had a number of hotels and resorts, which attracted visitors from all over the country.
In the 1950s, the town began to decline in popularity as more people began to move to the nearby cities of Clearwater and St. Petersburg. The town was eventually annexed by the city of Belleair Beach in 1975.
Economy
The economy of Belleair Shore is largely based on tourism. The town is home to a number of hotels and resorts, which attract visitors from all over the country. The town also has a number of restaurants, bars, and shops, which cater to both tourists and locals.
The town also has a number of marinas, which provide services to boaters and fishermen. The town is also home to a number of charter fishing companies, which offer deep sea fishing trips.
Demographics
As of the 2010 census, the population of Belleair Shore was 200 people. The town has a median household income of $75,000 and a median home value of $1.2 million. The town is predominantly white, with 95% of the population being white and 5% being of other races.
Conclusion
Belleair Shore is a small town located in Pinellas County, Florida, United States. It is situated on the Gulf of Mexico, just south of Clearwater Beach. The town has a population of approximately 200 people and covers an area of 0.2 square miles. The town is characterized by its white sand beaches, which are popular with tourists and locals alike. The economy of Belleair Shore is largely based on tourism, with a number of hotels and resorts, restaurants, bars, and shops catering to both tourists and locals. The town is predominantly white, with 95% of the population being white and 5% being of other races.
Common Questions
What is Per Capita Income in Belleair Shore?
Per Capita income in Belleair Shore is $154,318.
What is the Median Household income in Belleair Shore?
Median Household Income in Belleair Shore is $178,750.
What is Inequality or Gini Index in Belleair Shore?
Inequality or Gini Index in Belleair Shore is 0.56.
What is the Total Population of Belleair Shore?
Total Population of Belleair Shore is 67.
What is the Total Male Population of Belleair Shore?
Total Male Population of Belleair Shore is 35.
What is the Total Female Population of Belleair Shore?
Total Female Population of Belleair Shore is 32.
What is the Ratio of Males per 100 Females in Belleair Shore?
There are 109.38 Males per 100 Females in Belleair Shore.
What is the Ratio of Females per 100 Males in Belleair Shore?
There are 91.43 Females per 100 Males in Belleair Shore.
What is the Median Population Age in Belleair Shore?
Median Population Age in Belleair Shore is 59.8 Years.
What is the Average Family Size in Belleair Shore
Average Family Size in Belleair Shore is 2.4 People.
What is the Average Household Size in Belleair Shore
Average Household Size in Belleair Shore is 2.4 People.
How Large is the Labor Force in Belleair Shore?
There are 29 People in the Labor Forcein in Belleair Shore.
What is the Percentage of People in the Labor Force in Belleair Shore?
46.8% of People are in the Labor Force in Belleair Shore.