Jan Phyl Village, FL Map & Demographics
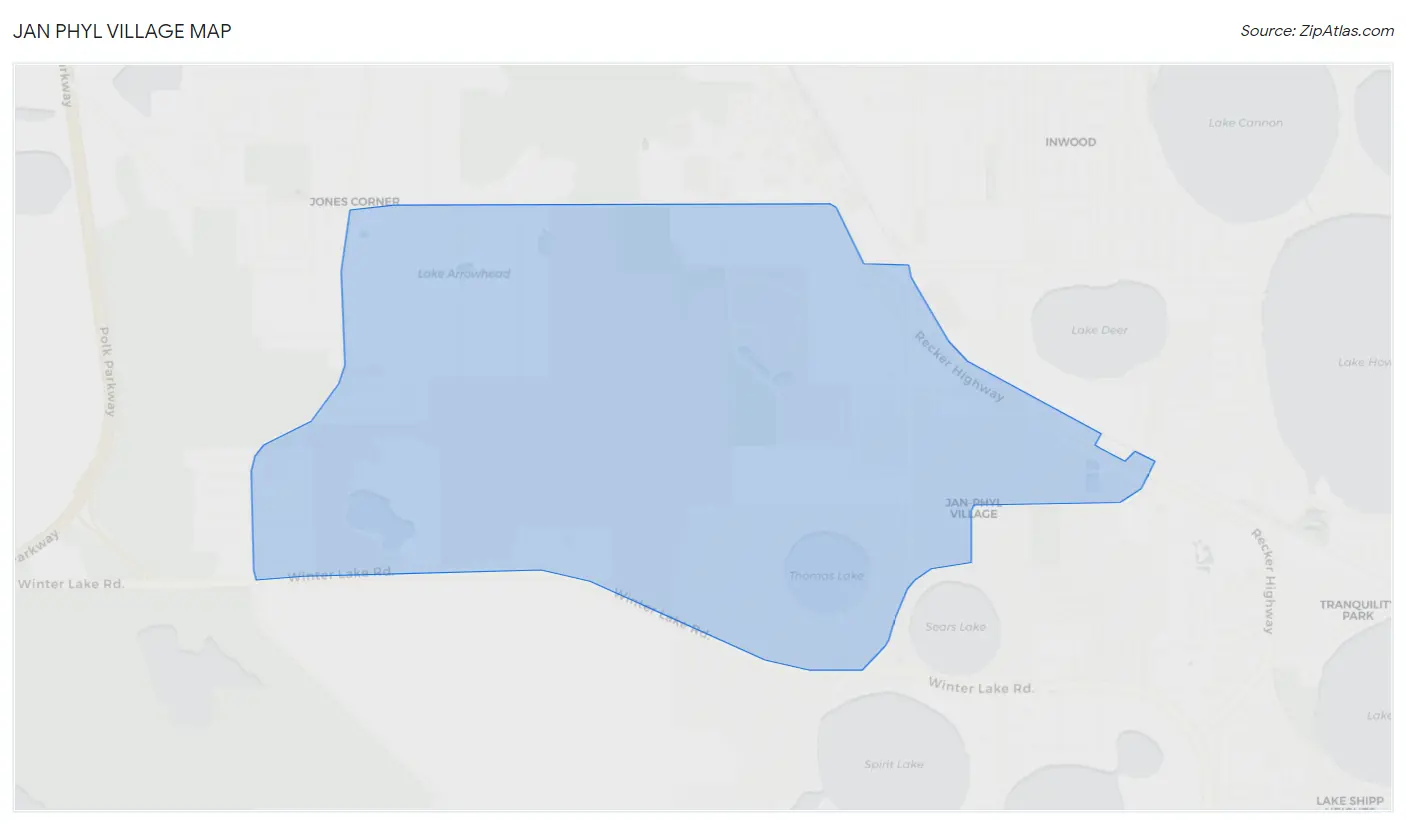
Jan Phyl Village Map
Jan Phyl Village Overview
$27,007
PER CAPITA INCOME
$69,858
AVG FAMILY INCOME
$63,023
AVG HOUSEHOLD INCOME
11.6%
WAGE / INCOME GAP [ % ]
88.4¢/ $1
WAGE / INCOME GAP [ $ ]
0.44
INEQUALITY / GINI INDEX
6,237
TOTAL POPULATION
2,844
MALE POPULATION
3,393
FEMALE POPULATION
83.82
MALES / 100 FEMALES
119.30
FEMALES / 100 MALES
36.0
MEDIAN AGE
3.5
AVG FAMILY SIZE
2.8
AVG HOUSEHOLD SIZE
2,937
LABOR FORCE [ PEOPLE ]
59.9%
PERCENT IN LABOR FORCE
3.7%
UNEMPLOYMENT RATE
Income in Jan Phyl Village
Income Overview in Jan Phyl Village
Per Capita Income in Jan Phyl Village is $27,007, while median incomes of families and households are $69,858 and $63,023 respectively.
| Characteristic | Number | Measure |
| Per Capita Income | 6,237 | $27,007 |
| Median Family Income | 1,536 | $69,858 |
| Mean Family Income | 1,536 | $82,785 |
| Median Household Income | 2,199 | $63,023 |
| Mean Household Income | 2,199 | $72,174 |
| Income Deficit | 1,536 | $0 |
| Wage / Income Gap (%) | 6,237 | 11.60% |
| Wage / Income Gap ($) | 6,237 | 88.40¢ per $1 |
| Gini / Inequality Index | 6,237 | 0.44 |
Earnings by Sex in Jan Phyl Village
Average Earnings in Jan Phyl Village are $35,759, $40,027 for men and $35,382 for women, a difference of 11.6%.
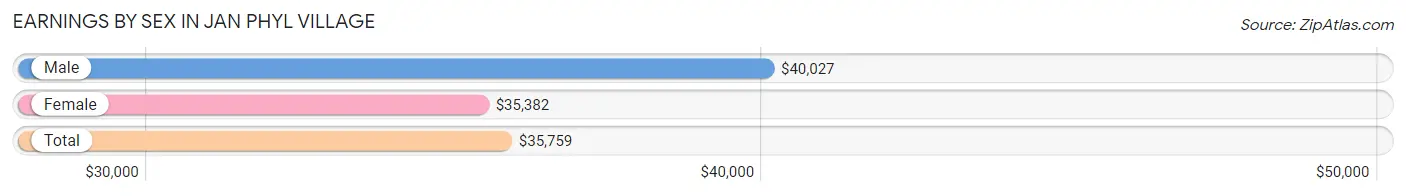
| Sex | Number | Average Earnings |
| Male | 1,302 (43.5%) | $40,027 |
| Female | 1,690 (56.5%) | $35,382 |
| Total | 2,992 (100.0%) | $35,759 |
Earnings by Sex by Income Bracket in Jan Phyl Village
The most common earnings brackets in Jan Phyl Village are $75,000 to $99,999 for men (209 | 16.1%) and $35,000 to $39,999 for women (256 | 15.1%).
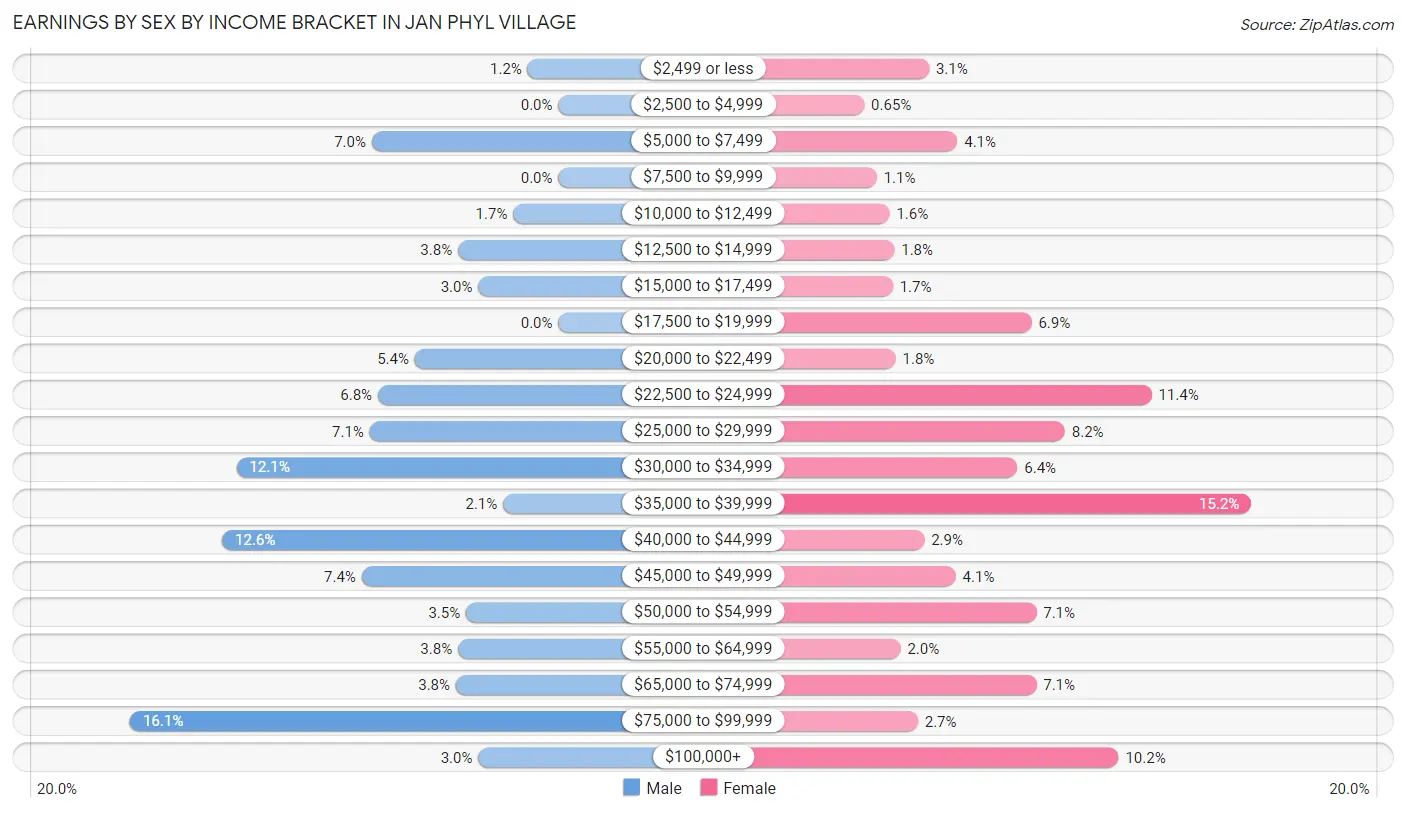
| Income | Male | Female |
| $2,499 or less | 15 (1.1%) | 52 (3.1%) |
| $2,500 to $4,999 | 0 (0.0%) | 11 (0.6%) |
| $5,000 to $7,499 | 91 (7.0%) | 70 (4.1%) |
| $7,500 to $9,999 | 0 (0.0%) | 19 (1.1%) |
| $10,000 to $12,499 | 22 (1.7%) | 27 (1.6%) |
| $12,500 to $14,999 | 49 (3.8%) | 30 (1.8%) |
| $15,000 to $17,499 | 39 (3.0%) | 29 (1.7%) |
| $17,500 to $19,999 | 0 (0.0%) | 117 (6.9%) |
| $20,000 to $22,499 | 70 (5.4%) | 31 (1.8%) |
| $22,500 to $24,999 | 88 (6.8%) | 193 (11.4%) |
| $25,000 to $29,999 | 92 (7.1%) | 138 (8.2%) |
| $30,000 to $34,999 | 157 (12.1%) | 108 (6.4%) |
| $35,000 to $39,999 | 27 (2.1%) | 256 (15.1%) |
| $40,000 to $44,999 | 164 (12.6%) | 49 (2.9%) |
| $45,000 to $49,999 | 96 (7.4%) | 69 (4.1%) |
| $50,000 to $54,999 | 45 (3.5%) | 120 (7.1%) |
| $55,000 to $64,999 | 49 (3.8%) | 34 (2.0%) |
| $65,000 to $74,999 | 50 (3.8%) | 120 (7.1%) |
| $75,000 to $99,999 | 209 (16.1%) | 45 (2.7%) |
| $100,000+ | 39 (3.0%) | 172 (10.2%) |
| Total | 1,302 (100.0%) | 1,690 (100.0%) |
Earnings by Sex by Educational Attainment in Jan Phyl Village
Average earnings in Jan Phyl Village are $42,283 for men and $35,916 for women, a difference of 15.1%. Men with an educational attainment of college or associate's degree enjoy the highest average annual earnings of $74,408, while those with less than high school education earn the least with $31,632. Women with an educational attainment of bachelor's degree earn the most with the average annual earnings of $69,444, while those with less than high school education have the smallest earnings of $23,866.
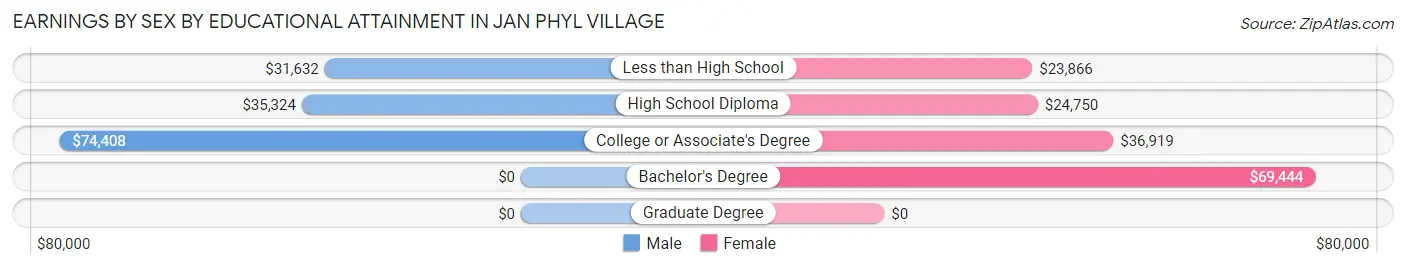
| Educational Attainment | Male Income | Female Income |
| Less than High School | $31,632 | $23,866 |
| High School Diploma | $35,324 | $24,750 |
| College or Associate's Degree | $74,408 | $36,919 |
| Bachelor's Degree | - | - |
| Graduate Degree | - | - |
| Total | $42,283 | $35,916 |
Family Income in Jan Phyl Village
Family Income Brackets in Jan Phyl Village
According to the Jan Phyl Village family income data, there are 366 families falling into the $50,000 to $74,999 income range, which is the most common income bracket and makes up 23.8% of all families.
| Income Bracket | # Families | % Families |
| Less than $10,000 | 75 | 4.9% |
| $10,000 to $14,999 | 0 | 0.0% |
| $15,000 to $24,999 | 78 | 5.1% |
| $25,000 to $34,999 | 137 | 8.9% |
| $35,000 to $49,999 | 200 | 13.0% |
| $50,000 to $74,999 | 366 | 23.8% |
| $75,000 to $99,999 | 207 | 13.5% |
| $100,000 to $149,999 | 326 | 21.2% |
| $150,000 to $199,999 | 37 | 2.4% |
| $200,000+ | 108 | 7.0% |
Family Income by Famaliy Size in Jan Phyl Village
5-person families (96 | 6.2%) account for the highest median family income in Jan Phyl Village with $121,321 per family, while 2-person families (592 | 38.5%) have the highest median income of $37,500 per family member.
| Income Bracket | # Families | Median Income |
| 2-Person Families | 592 (38.5%) | $75,000 |
| 3-Person Families | 448 (29.2%) | $69,817 |
| 4-Person Families | 285 (18.5%) | $0 |
| 5-Person Families | 96 (6.2%) | $121,321 |
| 6-Person Families | 15 (1.0%) | $0 |
| 7+ Person Families | 100 (6.5%) | $0 |
| Total | 1,536 (100.0%) | $69,858 |
Family Income by Number of Earners in Jan Phyl Village
| Number of Earners | # Families | Median Income |
| No Earners | 249 (16.2%) | $0 |
| 1 Earner | 592 (38.5%) | $64,250 |
| 2 Earners | 526 (34.2%) | $76,250 |
| 3+ Earners | 169 (11.0%) | $121,863 |
| Total | 1,536 (100.0%) | $69,858 |
Household Income in Jan Phyl Village
Household Income Brackets in Jan Phyl Village
With 389 households falling in the category, the $50,000 to $74,999 income range is the most frequent in Jan Phyl Village, accounting for 17.7% of all households.
| Income Bracket | # Households | % Households |
| Less than $10,000 | 286 | 13.0% |
| $10,000 to $14,999 | 0 | 0.0% |
| $15,000 to $24,999 | 125 | 5.7% |
| $25,000 to $34,999 | 242 | 11.0% |
| $35,000 to $49,999 | 332 | 15.1% |
| $50,000 to $74,999 | 389 | 17.7% |
| $75,000 to $99,999 | 262 | 11.9% |
| $100,000 to $149,999 | 356 | 16.2% |
| $150,000 to $199,999 | 84 | 3.8% |
| $200,000+ | 123 | 5.6% |
Household Income by Householder Age in Jan Phyl Village
The median household income in Jan Phyl Village is $63,023, with the highest median household income of $93,875 found in the 45 to 64 years age bracket for the primary householder. A total of 868 households (39.5%) fall into this category.
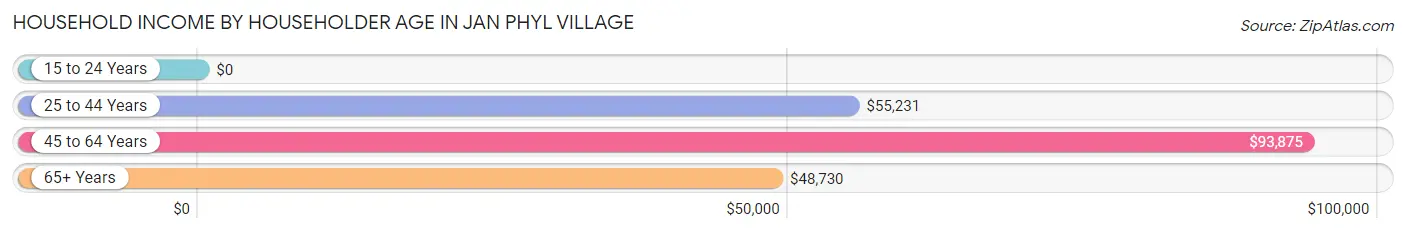
| Income Bracket | # Households | Median Income |
| 15 to 24 Years | 0 (0.0%) | $0 |
| 25 to 44 Years | 792 (36.0%) | $55,231 |
| 45 to 64 Years | 868 (39.5%) | $93,875 |
| 65+ Years | 539 (24.5%) | $48,730 |
| Total | 2,199 (100.0%) | $63,023 |
Poverty in Jan Phyl Village
Income Below Poverty by Sex and Age in Jan Phyl Village
With 20.2% poverty level for males and 23.7% for females among the residents of Jan Phyl Village, 6 to 11 year old males and 25 to 34 year old females are the most vulnerable to poverty, with 208 males (65.0%) and 224 females (42.2%) in their respective age groups living below the poverty level.
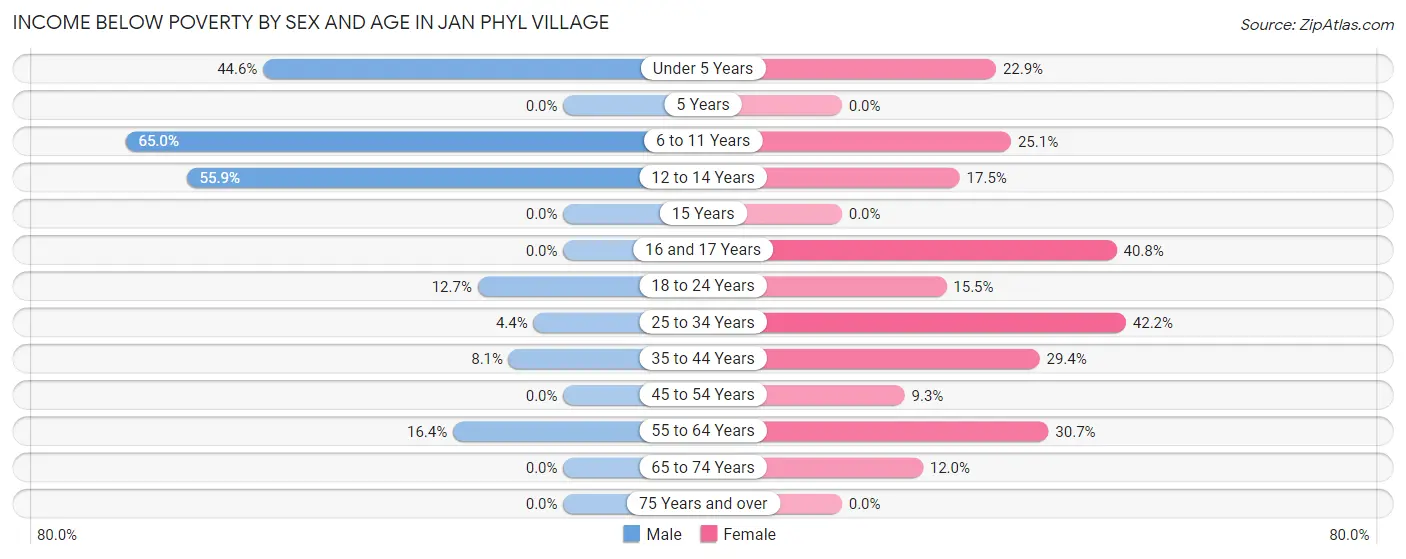
| Age Bracket | Male | Female |
| Under 5 Years | 115 (44.6%) | 57 (22.9%) |
| 5 Years | 0 (0.0%) | 0 (0.0%) |
| 6 to 11 Years | 208 (65.0%) | 53 (25.1%) |
| 12 to 14 Years | 99 (55.9%) | 14 (17.5%) |
| 15 Years | 0 (0.0%) | 0 (0.0%) |
| 16 and 17 Years | 0 (0.0%) | 51 (40.8%) |
| 18 to 24 Years | 38 (12.7%) | 50 (15.5%) |
| 25 to 34 Years | 17 (4.4%) | 224 (42.2%) |
| 35 to 44 Years | 22 (8.1%) | 96 (29.4%) |
| 45 to 54 Years | 0 (0.0%) | 53 (9.3%) |
| 55 to 64 Years | 76 (16.4%) | 158 (30.7%) |
| 65 to 74 Years | 0 (0.0%) | 48 (12.0%) |
| 75 Years and over | 0 (0.0%) | 0 (0.0%) |
| Total | 575 (20.2%) | 804 (23.7%) |
Income Above Poverty by Sex and Age in Jan Phyl Village
According to the poverty statistics in Jan Phyl Village, males aged 15 years and females aged 75 years and over are the age groups that are most secure financially, with 100.0% of males and 100.0% of females in these age groups living above the poverty line.
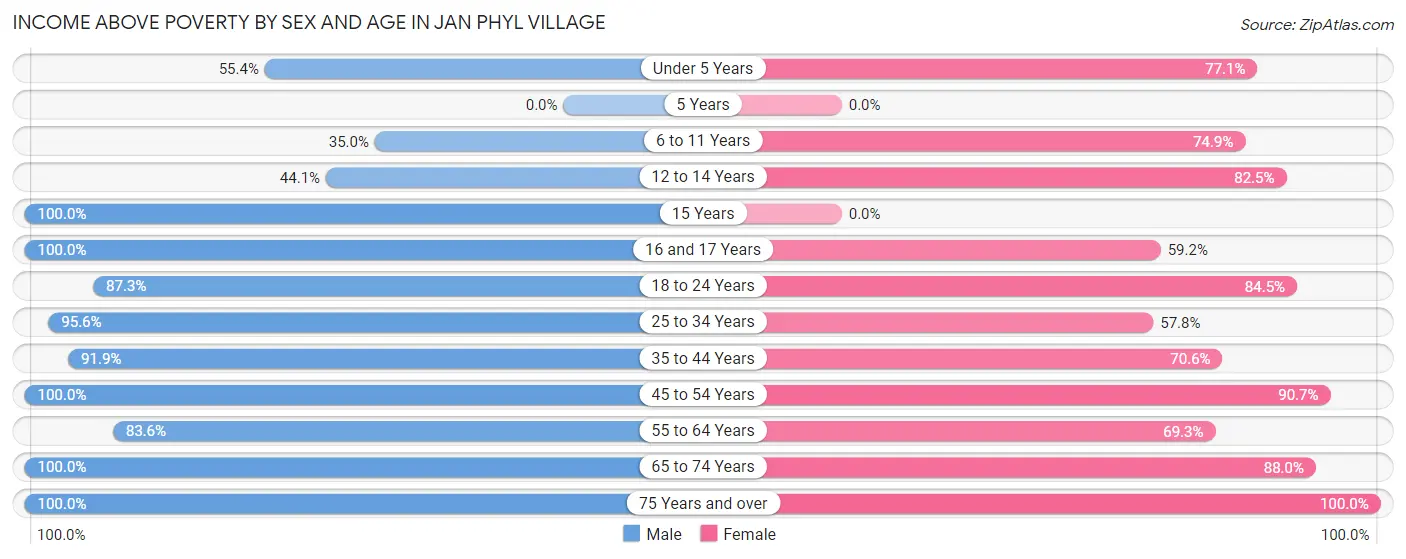
| Age Bracket | Male | Female |
| Under 5 Years | 143 (55.4%) | 192 (77.1%) |
| 5 Years | 0 (0.0%) | 0 (0.0%) |
| 6 to 11 Years | 112 (35.0%) | 158 (74.9%) |
| 12 to 14 Years | 78 (44.1%) | 66 (82.5%) |
| 15 Years | 38 (100.0%) | 0 (0.0%) |
| 16 and 17 Years | 110 (100.0%) | 74 (59.2%) |
| 18 to 24 Years | 261 (87.3%) | 272 (84.5%) |
| 25 to 34 Years | 368 (95.6%) | 307 (57.8%) |
| 35 to 44 Years | 250 (91.9%) | 231 (70.6%) |
| 45 to 54 Years | 138 (100.0%) | 515 (90.7%) |
| 55 to 64 Years | 388 (83.6%) | 357 (69.3%) |
| 65 to 74 Years | 201 (100.0%) | 351 (88.0%) |
| 75 Years and over | 182 (100.0%) | 66 (100.0%) |
| Total | 2,269 (79.8%) | 2,589 (76.3%) |
Income Below Poverty Among Married-Couple Families in Jan Phyl Village
The poverty statistics for married-couple families in Jan Phyl Village show that 8.5% or 73 of the total 859 families live below the poverty line. Families with 5 or more children have the highest poverty rate of 100.0%, comprising of 46 families. On the other hand, families with no children have the lowest poverty rate of 0.0%, which includes 0 families.
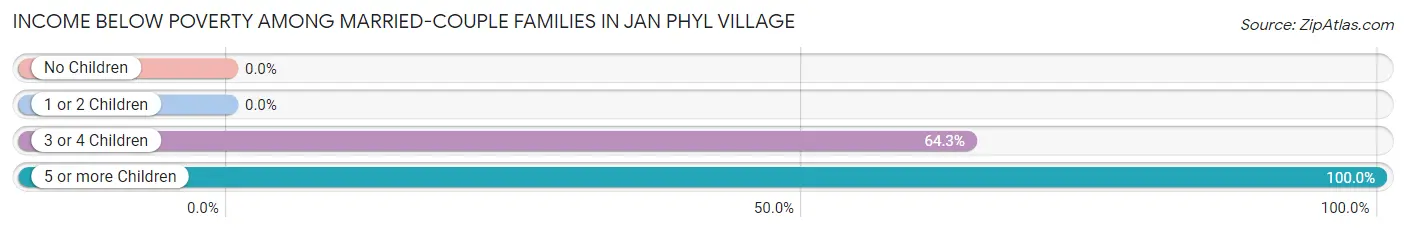
| Children | Above Poverty | Below Poverty |
| No Children | 423 (100.0%) | 0 (0.0%) |
| 1 or 2 Children | 348 (100.0%) | 0 (0.0%) |
| 3 or 4 Children | 15 (35.7%) | 27 (64.3%) |
| 5 or more Children | 0 (0.0%) | 46 (100.0%) |
| Total | 786 (91.5%) | 73 (8.5%) |
Income Below Poverty Among Single-Parent Households in Jan Phyl Village
According to the poverty data in Jan Phyl Village, 11.7% or 17 single-father households and 26.1% or 139 single-mother households are living below the poverty line. Among single-father households, those with 1 or 2 children have the highest poverty rate, with 17 households (24.3%) experiencing poverty. Likewise, among single-mother households, those with 3 or 4 children have the highest poverty rate, with 63 households (70.0%) falling below the poverty line.
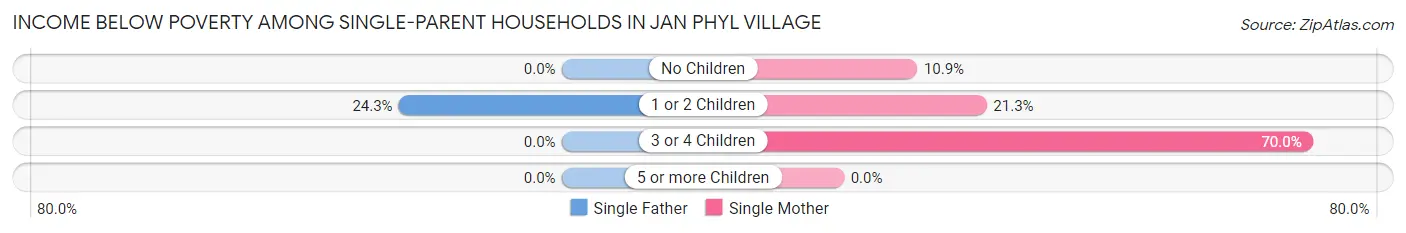
| Children | Single Father | Single Mother |
| No Children | 0 (0.0%) | 19 (10.9%) |
| 1 or 2 Children | 17 (24.3%) | 57 (21.3%) |
| 3 or 4 Children | 0 (0.0%) | 63 (70.0%) |
| 5 or more Children | 0 (0.0%) | 0 (0.0%) |
| Total | 17 (11.7%) | 139 (26.1%) |
Income Below Poverty Among Married-Couple vs Single-Parent Households in Jan Phyl Village
The poverty data for Jan Phyl Village shows that 73 of the married-couple family households (8.5%) and 156 of the single-parent households (23.0%) are living below the poverty level. Within the married-couple family households, those with 5 or more children have the highest poverty rate, with 46 households (100.0%) falling below the poverty line. Among the single-parent households, those with 3 or 4 children have the highest poverty rate, with 63 household (70.0%) living below poverty.
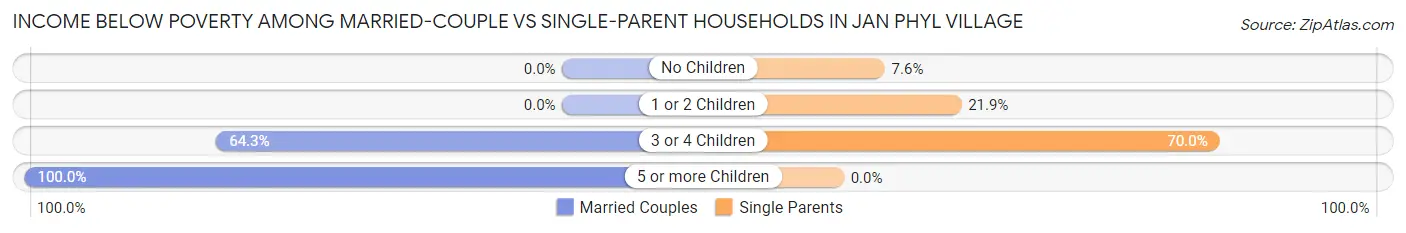
| Children | Married-Couple Families | Single-Parent Households |
| No Children | 0 (0.0%) | 19 (7.6%) |
| 1 or 2 Children | 0 (0.0%) | 74 (21.9%) |
| 3 or 4 Children | 27 (64.3%) | 63 (70.0%) |
| 5 or more Children | 46 (100.0%) | 0 (0.0%) |
| Total | 73 (8.5%) | 156 (23.0%) |
Race in Jan Phyl Village
The most populous races in Jan Phyl Village are White / Caucasian (4,045 | 64.8%), Black / African American (1,409 | 22.6%), and Hispanic or Latino (1,392 | 22.3%).
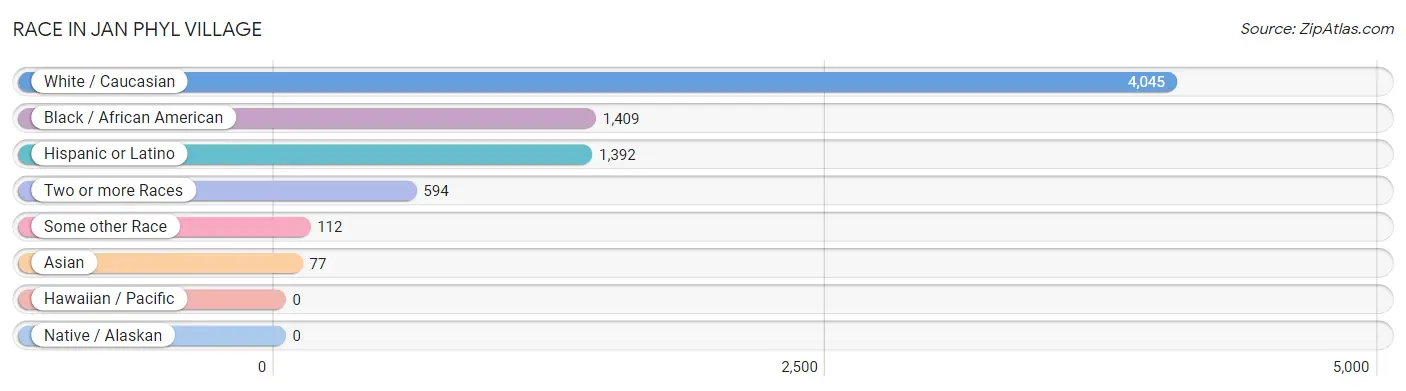
| Race | # Population | % Population |
| Asian | 77 | 1.2% |
| Black / African American | 1,409 | 22.6% |
| Hawaiian / Pacific | 0 | 0.0% |
| Hispanic or Latino | 1,392 | 22.3% |
| Native / Alaskan | 0 | 0.0% |
| White / Caucasian | 4,045 | 64.8% |
| Two or more Races | 594 | 9.5% |
| Some other Race | 112 | 1.8% |
| Total | 6,237 | 100.0% |
Ancestry in Jan Phyl Village
The most populous ancestries reported in Jan Phyl Village are American (964 | 15.5%), Puerto Rican (889 | 14.2%), Mexican (447 | 7.2%), Haitian (322 | 5.2%), and Jamaican (268 | 4.3%), together accounting for 46.3% of all Jan Phyl Village residents.
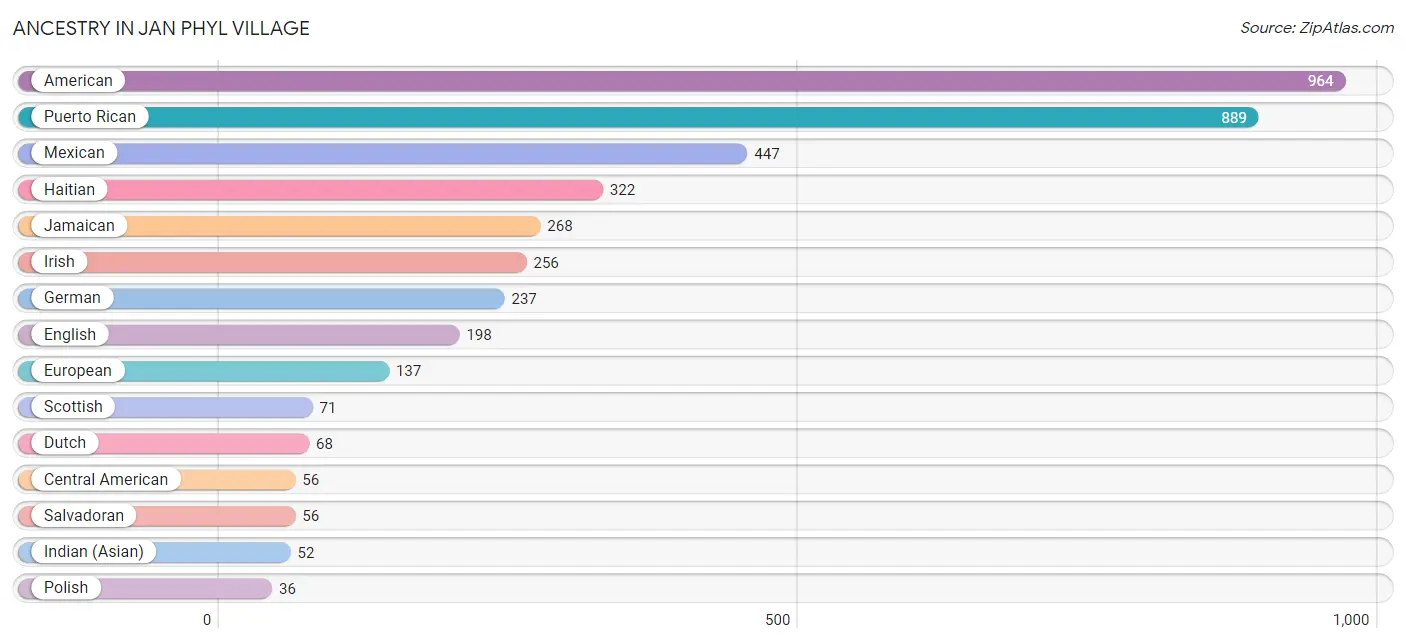
| Ancestry | # Population | % Population |
| American | 964 | 15.5% |
| Austrian | 8 | 0.1% |
| Belgian | 18 | 0.3% |
| British | 21 | 0.3% |
| Burmese | 17 | 0.3% |
| Canadian | 19 | 0.3% |
| Celtic | 14 | 0.2% |
| Central American | 56 | 0.9% |
| Cherokee | 23 | 0.4% |
| Creek | 14 | 0.2% |
| Dutch | 68 | 1.1% |
| English | 198 | 3.2% |
| European | 137 | 2.2% |
| German | 237 | 3.8% |
| Haitian | 322 | 5.2% |
| Hopi | 14 | 0.2% |
| Indian (Asian) | 52 | 0.8% |
| Irish | 256 | 4.1% |
| Italian | 17 | 0.3% |
| Jamaican | 268 | 4.3% |
| Lithuanian | 15 | 0.2% |
| Mexican | 447 | 7.2% |
| Polish | 36 | 0.6% |
| Puerto Rican | 889 | 14.2% |
| Salvadoran | 56 | 0.9% |
| Scottish | 71 | 1.1% |
| Sri Lankan | 25 | 0.4% |
| Swedish | 9 | 0.1% |
| Swiss | 9 | 0.1% |
| Ukrainian | 15 | 0.2% |
| Welsh | 14 | 0.2% | View All 31 Rows |
Immigrants in Jan Phyl Village
The most numerous immigrant groups reported in Jan Phyl Village came from Latin America (452 | 7.2%), Caribbean (250 | 4.0%), Central America (202 | 3.2%), Mexico (202 | 3.2%), and Haiti (162 | 2.6%), together accounting for 20.3% of all Jan Phyl Village residents.
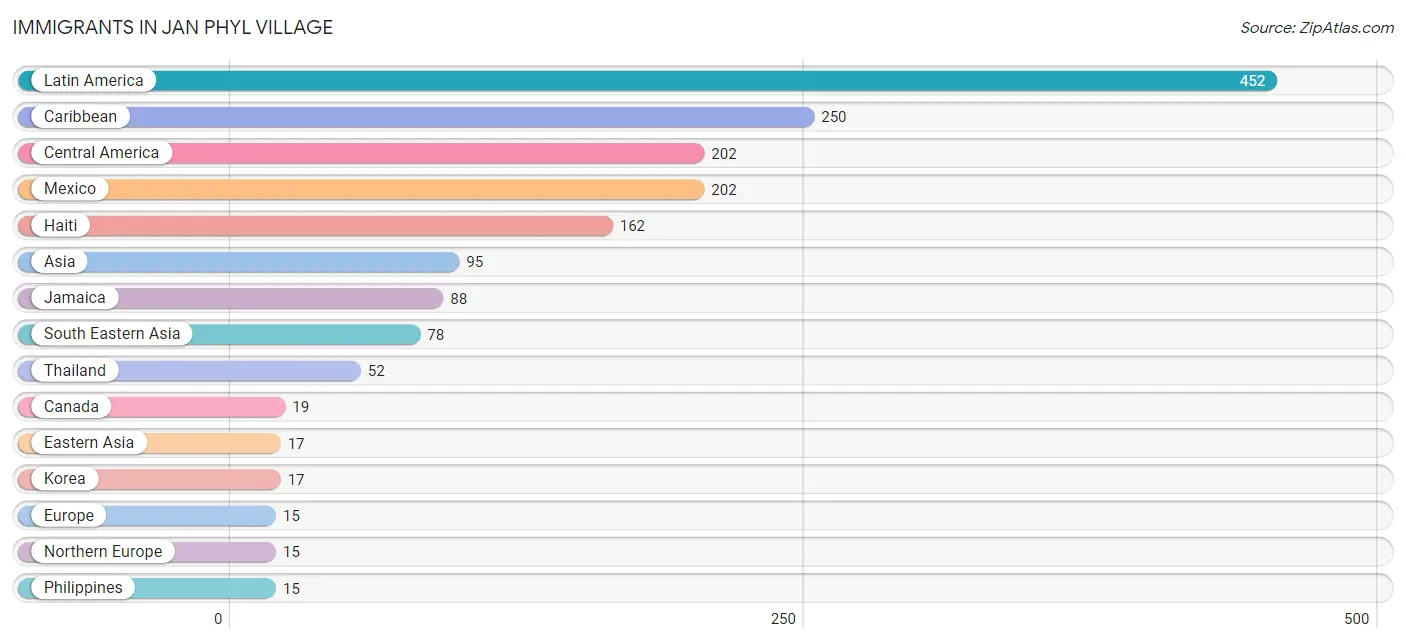
| Immigration Origin | # Population | % Population |
| Asia | 95 | 1.5% |
| Canada | 19 | 0.3% |
| Caribbean | 250 | 4.0% |
| Central America | 202 | 3.2% |
| Eastern Asia | 17 | 0.3% |
| Europe | 15 | 0.2% |
| Haiti | 162 | 2.6% |
| Jamaica | 88 | 1.4% |
| Korea | 17 | 0.3% |
| Latin America | 452 | 7.2% |
| Mexico | 202 | 3.2% |
| Northern Europe | 15 | 0.2% |
| Philippines | 15 | 0.2% |
| Scotland | 15 | 0.2% |
| South Eastern Asia | 78 | 1.3% |
| Thailand | 52 | 0.8% |
| Vietnam | 11 | 0.2% | View All 17 Rows |
Sex and Age in Jan Phyl Village
Sex and Age in Jan Phyl Village
The most populous age groups in Jan Phyl Village are 20 to 24 Years (277 | 9.7%) for men and 45 to 49 Years (399 | 11.8%) for women.
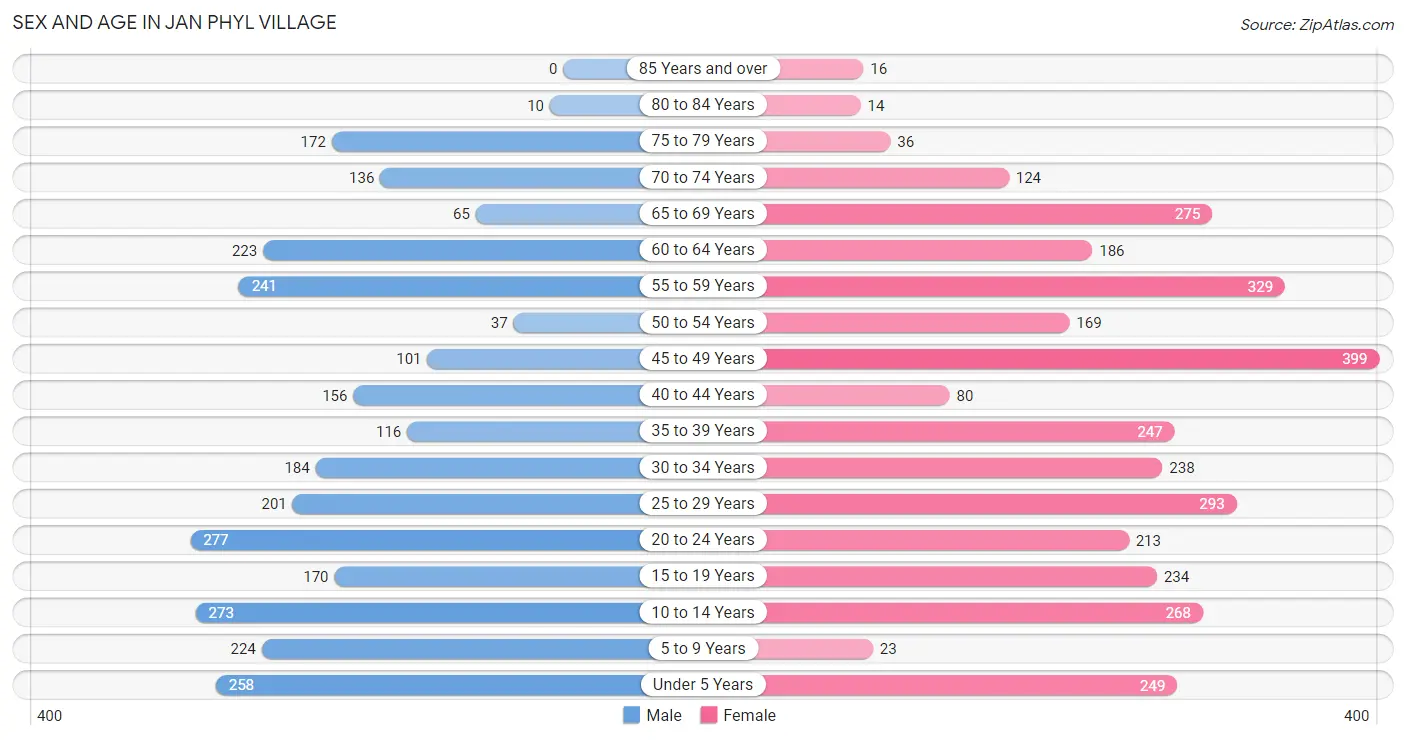
| Age Bracket | Male | Female |
| Under 5 Years | 258 (9.1%) | 249 (7.3%) |
| 5 to 9 Years | 224 (7.9%) | 23 (0.7%) |
| 10 to 14 Years | 273 (9.6%) | 268 (7.9%) |
| 15 to 19 Years | 170 (6.0%) | 234 (6.9%) |
| 20 to 24 Years | 277 (9.7%) | 213 (6.3%) |
| 25 to 29 Years | 201 (7.1%) | 293 (8.6%) |
| 30 to 34 Years | 184 (6.5%) | 238 (7.0%) |
| 35 to 39 Years | 116 (4.1%) | 247 (7.3%) |
| 40 to 44 Years | 156 (5.5%) | 80 (2.4%) |
| 45 to 49 Years | 101 (3.5%) | 399 (11.8%) |
| 50 to 54 Years | 37 (1.3%) | 169 (5.0%) |
| 55 to 59 Years | 241 (8.5%) | 329 (9.7%) |
| 60 to 64 Years | 223 (7.8%) | 186 (5.5%) |
| 65 to 69 Years | 65 (2.3%) | 275 (8.1%) |
| 70 to 74 Years | 136 (4.8%) | 124 (3.6%) |
| 75 to 79 Years | 172 (6.0%) | 36 (1.1%) |
| 80 to 84 Years | 10 (0.4%) | 14 (0.4%) |
| 85 Years and over | 0 (0.0%) | 16 (0.5%) |
| Total | 2,844 (100.0%) | 3,393 (100.0%) |
Families and Households in Jan Phyl Village
Median Family Size in Jan Phyl Village
The median family size in Jan Phyl Village is 3.47 persons per family, with married-couple families (859 | 55.9%) accounting for the largest median family size of 3.74 persons per family. On the other hand, single male/father families (145 | 9.4%) represent the smallest median family size with 2.13 persons per family.
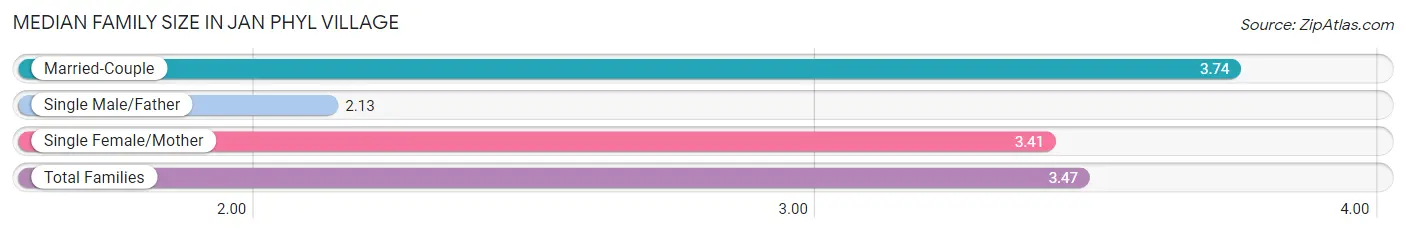
| Family Type | # Families | Family Size |
| Married-Couple | 859 (55.9%) | 3.74 |
| Single Male/Father | 145 (9.4%) | 2.13 |
| Single Female/Mother | 532 (34.6%) | 3.41 |
| Total Families | 1,536 (100.0%) | 3.47 |
Median Household Size in Jan Phyl Village
The median household size in Jan Phyl Village is 2.84 persons per household, with married-couple households (859 | 39.1%) accounting for the largest median household size of 3.74 persons per household. non-family households (663 | 30.1%) represent the smallest median household size with 1.13 persons per household.
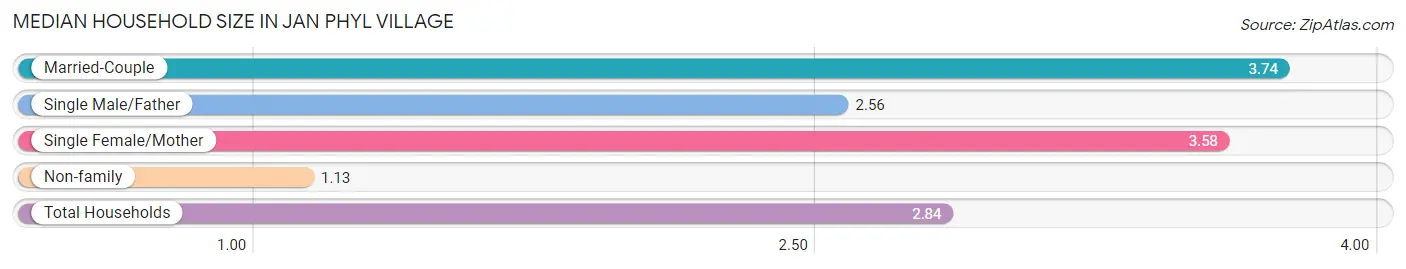
| Household Type | # Households | Household Size |
| Married-Couple | 859 (39.1%) | 3.74 |
| Single Male/Father | 145 (6.6%) | 2.56 |
| Single Female/Mother | 532 (24.2%) | 3.58 |
| Non-family | 663 (30.1%) | 1.13 |
| Total Households | 2,199 (100.0%) | 2.84 |
Household Size by Marriage Status in Jan Phyl Village
Out of a total of 2,199 households in Jan Phyl Village, 1,536 (69.9%) are family households, while 663 (30.1%) are nonfamily households. The most numerous type of family households are 2-person households, comprising 522, and the most common type of nonfamily households are 1-person households, comprising 583.
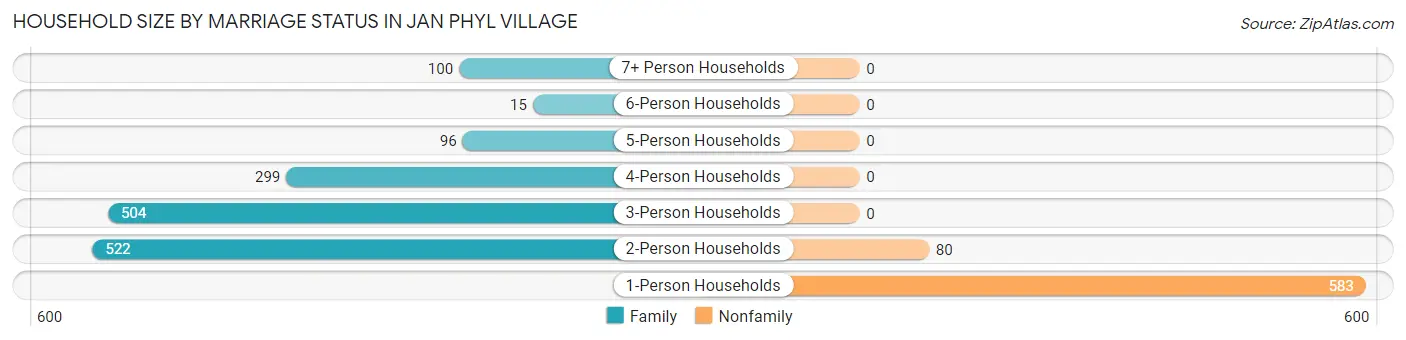
| Household Size | Family Households | Nonfamily Households |
| 1-Person Households | - | 583 (26.5%) |
| 2-Person Households | 522 (23.7%) | 80 (3.6%) |
| 3-Person Households | 504 (22.9%) | 0 (0.0%) |
| 4-Person Households | 299 (13.6%) | 0 (0.0%) |
| 5-Person Households | 96 (4.4%) | 0 (0.0%) |
| 6-Person Households | 15 (0.7%) | 0 (0.0%) |
| 7+ Person Households | 100 (4.5%) | 0 (0.0%) |
| Total | 1,536 (69.9%) | 663 (30.1%) |
Female Fertility in Jan Phyl Village
Fertility by Age in Jan Phyl Village
Average fertility rate in Jan Phyl Village is 39.0 births per 1,000 women. Women in the age bracket of 20 to 34 years have the highest fertility rate with 93.0 births per 1,000 women. Women in the age bracket of 20 to 34 years acount for 100.0% of all women with births.
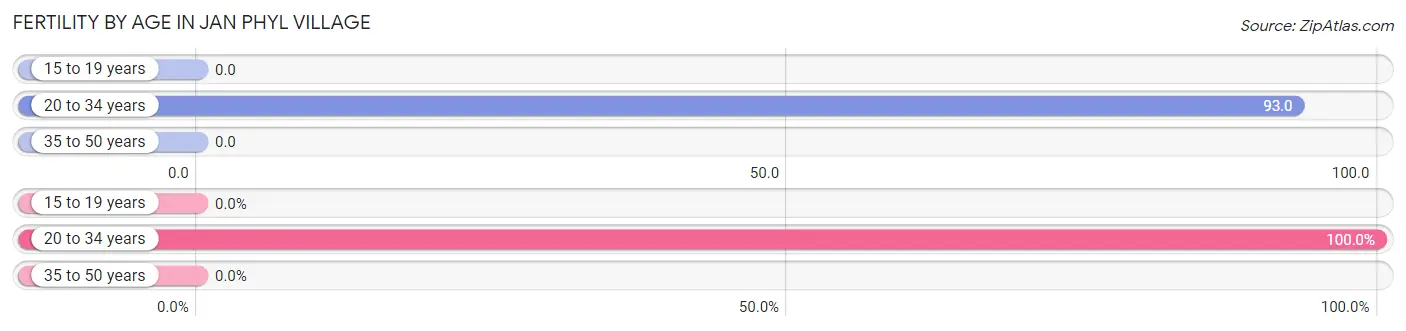
| Age Bracket | Women with Births | Births / 1,000 Women |
| 15 to 19 years | 0 (0.0%) | 0.0 |
| 20 to 34 years | 69 (100.0%) | 93.0 |
| 35 to 50 years | 0 (0.0%) | 0.0 |
| Total | 69 (100.0%) | 39.0 |
Fertility by Age by Marriage Status in Jan Phyl Village
81.2% of women with births (69) in Jan Phyl Village are married. The highest percentage of unmarried women with births falls into 20 to 34 years age bracket with 18.8% of them unmarried at the time of birth, while the lowest percentage of unmarried women with births belong to 20 to 34 years age bracket with 18.8% of them unmarried.
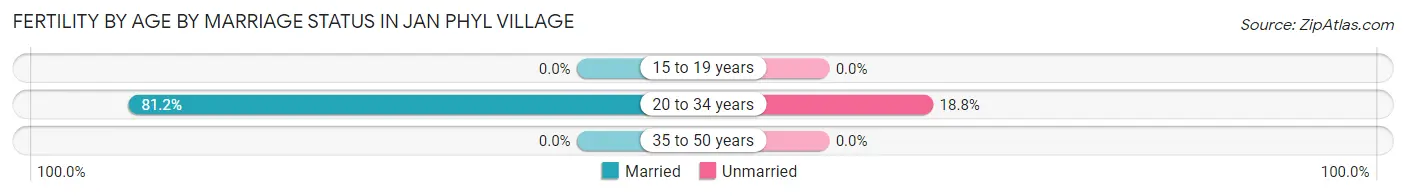
| Age Bracket | Married | Unmarried |
| 15 to 19 years | 0 (0.0%) | 0 (0.0%) |
| 20 to 34 years | 56 (81.2%) | 13 (18.8%) |
| 35 to 50 years | 0 (0.0%) | 0 (0.0%) |
| Total | 56 (81.2%) | 13 (18.8%) |
Fertility by Education in Jan Phyl Village
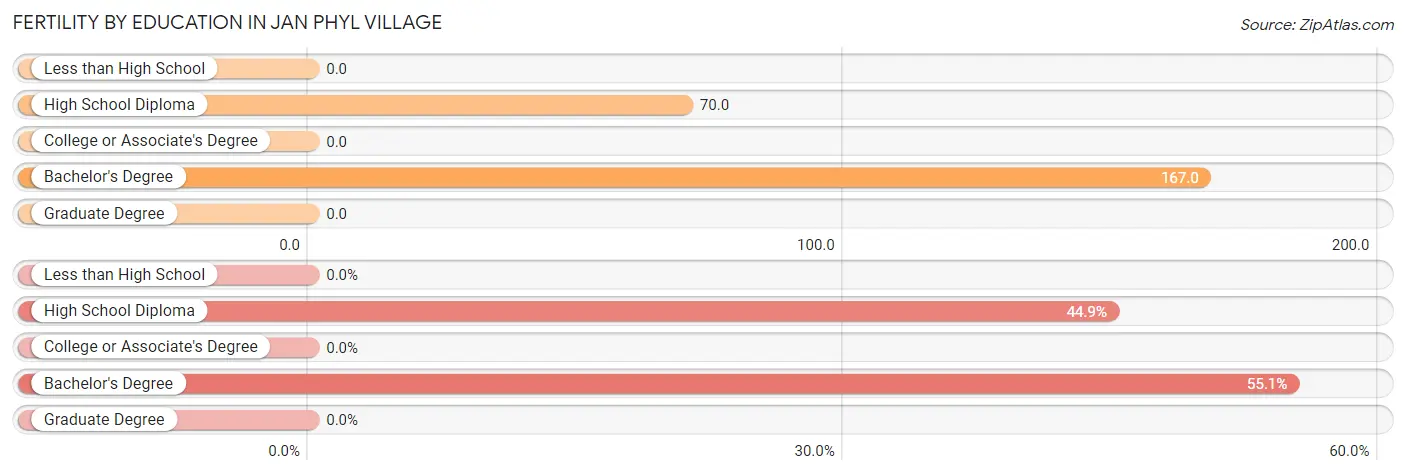
| Educational Attainment | Women with Births | Births / 1,000 Women |
| Less than High School | 0 (0.0%) | 0.0 |
| High School Diploma | 31 (44.9%) | 70.0 |
| College or Associate's Degree | 0 (0.0%) | 0.0 |
| Bachelor's Degree | 38 (55.1%) | 167.0 |
| Graduate Degree | 0 (0.0%) | 0.0 |
| Total | 69 (100.0%) | 39.0 |
Fertility by Education by Marriage Status in Jan Phyl Village
18.8% of women with births in Jan Phyl Village are unmarried. Women with the educational attainment of bachelor's degree are most likely to be married with 100.0% of them married at childbirth, while women with the educational attainment of high school diploma are least likely to be married with 41.9% of them unmarried at childbirth.
| Educational Attainment | Married | Unmarried |
| Less than High School | 0 (0.0%) | 0 (0.0%) |
| High School Diploma | 18 (58.1%) | 13 (41.9%) |
| College or Associate's Degree | 0 (0.0%) | 0 (0.0%) |
| Bachelor's Degree | 38 (100.0%) | 0 (0.0%) |
| Graduate Degree | 0 (0.0%) | 0 (0.0%) |
| Total | 56 (81.2%) | 13 (18.8%) |
Employment Characteristics in Jan Phyl Village
Employment by Class of Employer in Jan Phyl Village
Among the 2,781 employed individuals in Jan Phyl Village, private company employees (2,078 | 74.7%), local government employees (285 | 10.2%), and not-for-profit organizations (162 | 5.8%) make up the most common classes of employment.
| Employer Class | # Employees | % Employees |
| Private Company Employees | 2,078 | 74.7% |
| Self-Employed (Incorporated) | 17 | 0.6% |
| Self-Employed (Not Incorporated) | 69 | 2.5% |
| Not-for-profit Organizations | 162 | 5.8% |
| Local Government Employees | 285 | 10.2% |
| State Government Employees | 153 | 5.5% |
| Federal Government Employees | 0 | 0.0% |
| Unpaid Family Workers | 17 | 0.6% |
| Total | 2,781 | 100.0% |
Employment Status by Age in Jan Phyl Village
According to the labor force statistics for Jan Phyl Village, out of the total population over 16 years of age (4,904), 59.9% or 2,937 individuals are in the labor force, with 3.7% or 109 of them unemployed. The age group with the highest labor force participation rate is 45 to 54 years, with 94.1% or 664 individuals in the labor force. Within the labor force, the 45 to 54 years age range has the highest percentage of unemployed individuals, with 7.8% or 52 of them being unemployed.
| Age Bracket | In Labor Force | Unemployed |
| 16 to 19 Years | 38 (10.4%) | 0 (0.0%) |
| 20 to 24 Years | 271 (55.3%) | 19 (7.0%) |
| 25 to 29 Years | 445 (90.1%) | 19 (4.3%) |
| 30 to 34 Years | 356 (84.4%) | 19 (5.3%) |
| 35 to 44 Years | 488 (81.5%) | 0 (0.0%) |
| 45 to 54 Years | 664 (94.1%) | 52 (7.8%) |
| 55 to 59 Years | 283 (49.6%) | 0 (0.0%) |
| 60 to 64 Years | 239 (58.4%) | 0 (0.0%) |
| 65 to 74 Years | 90 (15.0%) | 0 (0.0%) |
| 75 Years and over | 65 (26.2%) | 0 (0.0%) |
| Total | 2,937 (59.9%) | 109 (3.7%) |
Employment Status by Educational Attainment in Jan Phyl Village
According to labor force statistics for Jan Phyl Village, 77.3% of individuals (2,474) out of the total population between 25 and 64 years of age (3,200) are in the labor force, with 3.6% or 89 of them being unemployed. The group with the highest labor force participation rate are those with the educational attainment of bachelor's degree or higher, with 89.6% or 473 individuals in the labor force. Within the labor force, individuals with high school diploma education have the highest percentage of unemployment, with 9.6% or 79 of them being unemployed.
| Educational Attainment | In Labor Force | Unemployed |
| Less than High School | 431 (63.4%) | 18 (2.6%) |
| High School Diploma | 824 (80.6%) | 98 (9.6%) |
| College / Associate Degree | 747 (77.0%) | 0 (0.0%) |
| Bachelor's Degree or higher | 473 (89.6%) | 0 (0.0%) |
| Total | 2,474 (77.3%) | 115 (3.6%) |
Employment Occupations by Sex in Jan Phyl Village
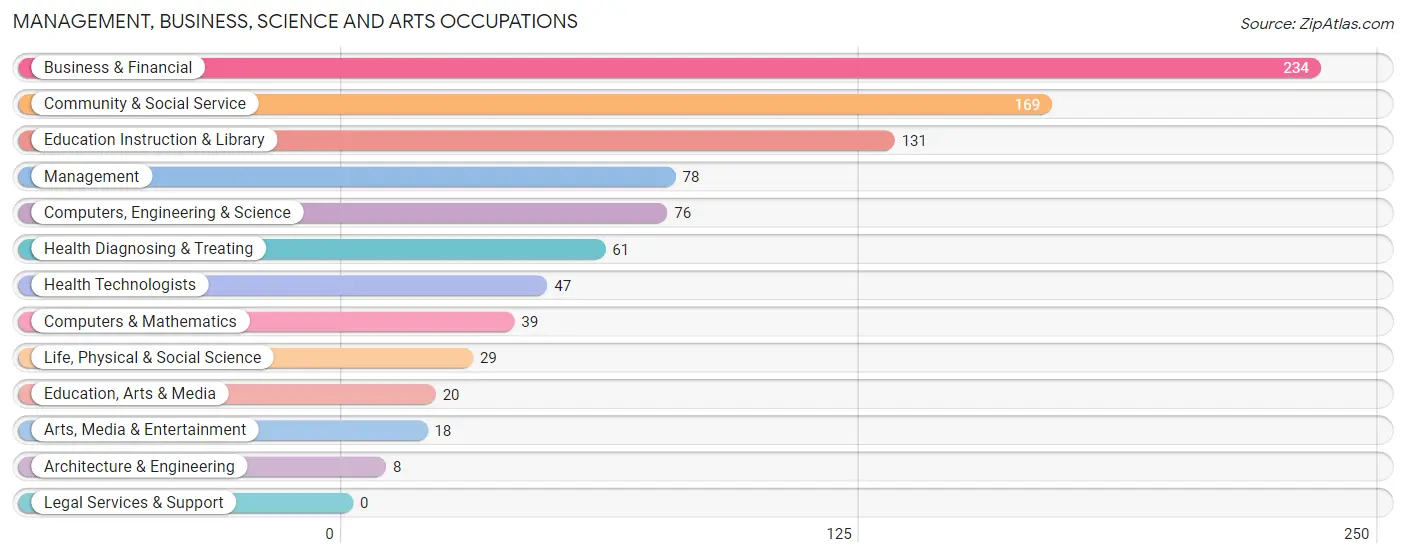
Management, Business, Science and Arts Occupations
The most common Management, Business, Science and Arts occupations in Jan Phyl Village are Business & Financial (234 | 8.3%), Community & Social Service (169 | 6.0%), Education Instruction & Library (131 | 4.6%), Management (78 | 2.8%), and Computers, Engineering & Science (76 | 2.7%).
Management, Business, Science and Arts Occupations by Sex
Within the Management, Business, Science and Arts occupations in Jan Phyl Village, the most male-oriented occupations are Architecture & Engineering (100.0%), Arts, Media & Entertainment (100.0%), and Management (69.2%), while the most female-oriented occupations are Education, Arts & Media (100.0%), Health Diagnosing & Treating (100.0%), and Health Technologists (100.0%).
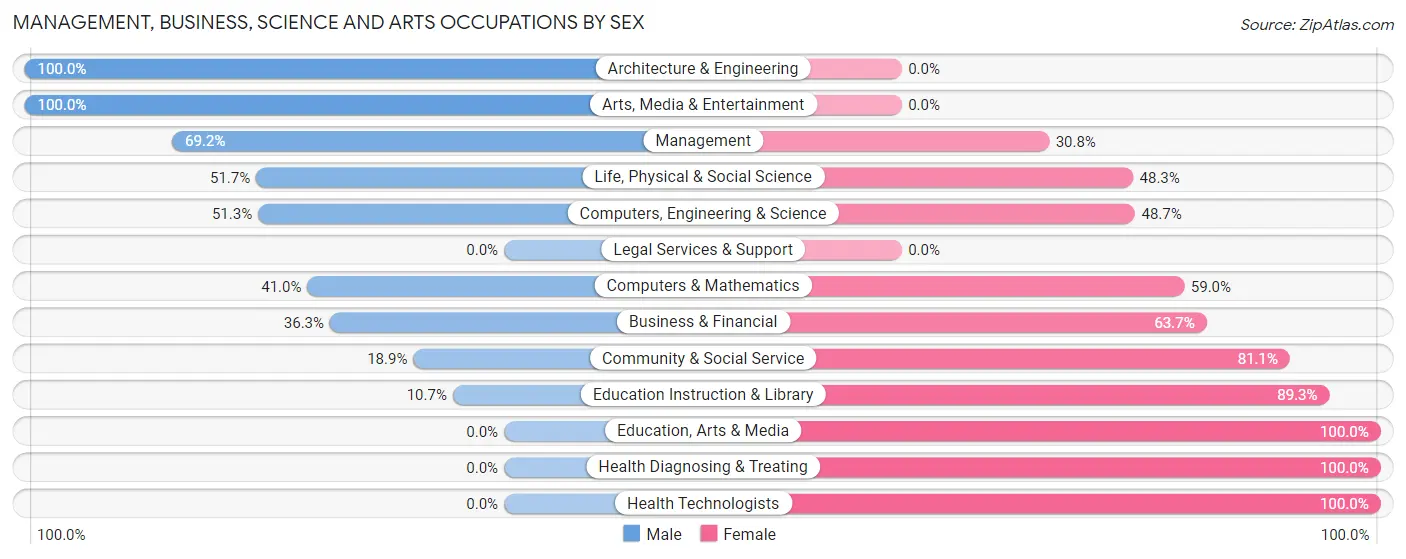
| Occupation | Male | Female |
| Management | 54 (69.2%) | 24 (30.8%) |
| Business & Financial | 85 (36.3%) | 149 (63.7%) |
| Computers, Engineering & Science | 39 (51.3%) | 37 (48.7%) |
| Computers & Mathematics | 16 (41.0%) | 23 (59.0%) |
| Architecture & Engineering | 8 (100.0%) | 0 (0.0%) |
| Life, Physical & Social Science | 15 (51.7%) | 14 (48.3%) |
| Community & Social Service | 32 (18.9%) | 137 (81.1%) |
| Education, Arts & Media | 0 (0.0%) | 20 (100.0%) |
| Legal Services & Support | 0 (0.0%) | 0 (0.0%) |
| Education Instruction & Library | 14 (10.7%) | 117 (89.3%) |
| Arts, Media & Entertainment | 18 (100.0%) | 0 (0.0%) |
| Health Diagnosing & Treating | 0 (0.0%) | 61 (100.0%) |
| Health Technologists | 0 (0.0%) | 47 (100.0%) |
| Total (Category) | 210 (34.0%) | 408 (66.0%) |
| Total (Overall) | 1,268 (44.8%) | 1,562 (55.2%) |
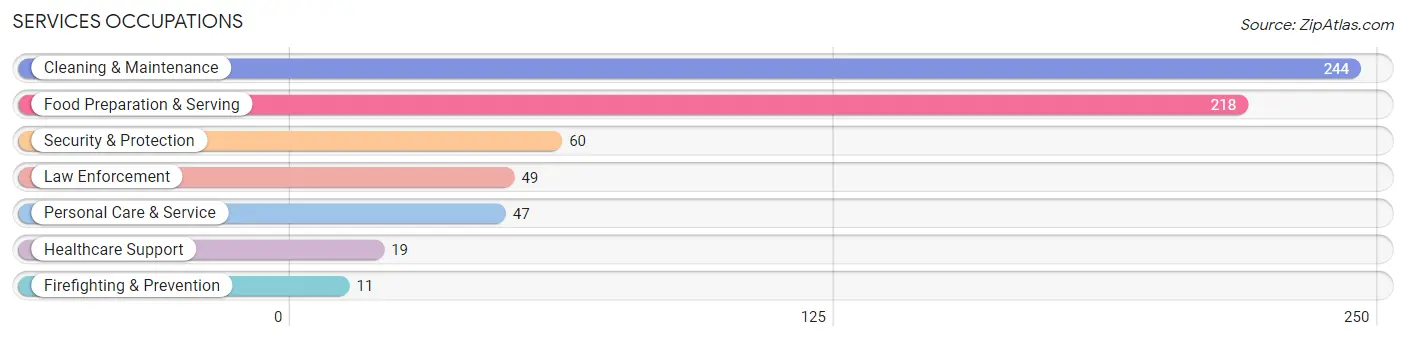
Services Occupations
The most common Services occupations in Jan Phyl Village are Cleaning & Maintenance (244 | 8.6%), Food Preparation & Serving (218 | 7.7%), Security & Protection (60 | 2.1%), Law Enforcement (49 | 1.7%), and Personal Care & Service (47 | 1.7%).
Services Occupations by Sex
Within the Services occupations in Jan Phyl Village, the most male-oriented occupations are Firefighting & Prevention (100.0%), Security & Protection (43.3%), and Cleaning & Maintenance (35.7%), while the most female-oriented occupations are Healthcare Support (100.0%), Personal Care & Service (100.0%), and Food Preparation & Serving (76.1%).
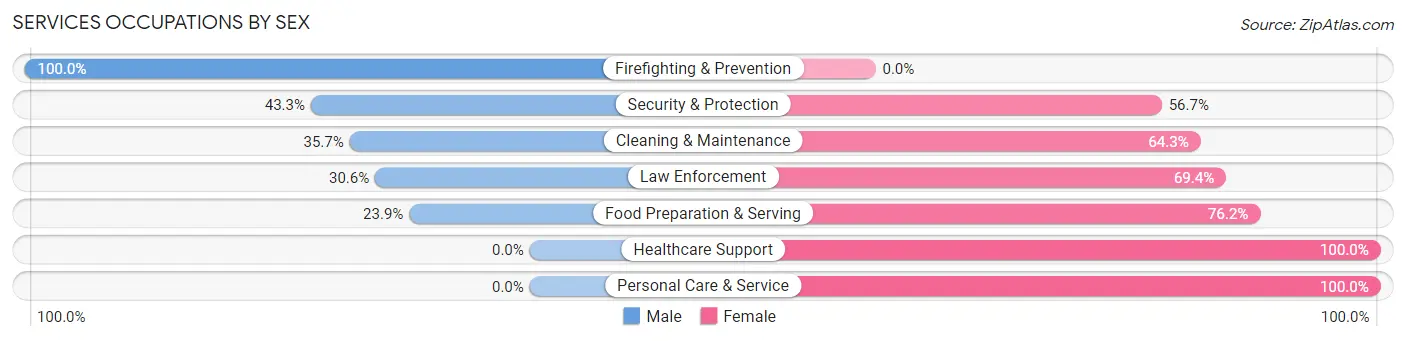
| Occupation | Male | Female |
| Healthcare Support | 0 (0.0%) | 19 (100.0%) |
| Security & Protection | 26 (43.3%) | 34 (56.7%) |
| Firefighting & Prevention | 11 (100.0%) | 0 (0.0%) |
| Law Enforcement | 15 (30.6%) | 34 (69.4%) |
| Food Preparation & Serving | 52 (23.8%) | 166 (76.1%) |
| Cleaning & Maintenance | 87 (35.7%) | 157 (64.3%) |
| Personal Care & Service | 0 (0.0%) | 47 (100.0%) |
| Total (Category) | 165 (28.1%) | 423 (71.9%) |
| Total (Overall) | 1,268 (44.8%) | 1,562 (55.2%) |
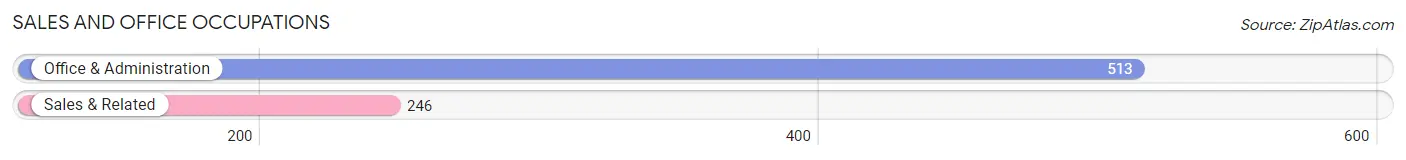
Sales and Office Occupations
The most common Sales and Office occupations in Jan Phyl Village are Office & Administration (513 | 18.1%), and Sales & Related (246 | 8.7%).
Sales and Office Occupations by Sex
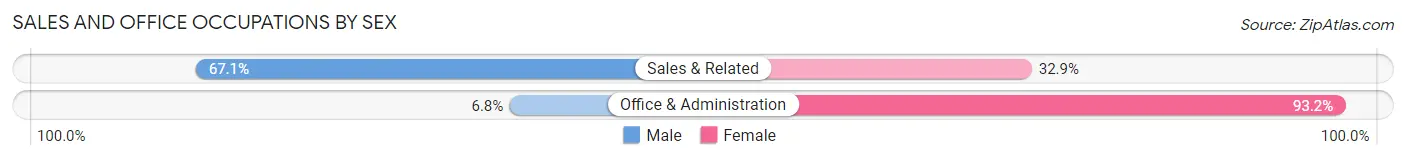
| Occupation | Male | Female |
| Sales & Related | 165 (67.1%) | 81 (32.9%) |
| Office & Administration | 35 (6.8%) | 478 (93.2%) |
| Total (Category) | 200 (26.4%) | 559 (73.7%) |
| Total (Overall) | 1,268 (44.8%) | 1,562 (55.2%) |
Natural Resources, Construction and Maintenance Occupations
The most common Natural Resources, Construction and Maintenance occupations in Jan Phyl Village are Installation, Maintenance & Repair (162 | 5.7%), and Construction & Extraction (133 | 4.7%).
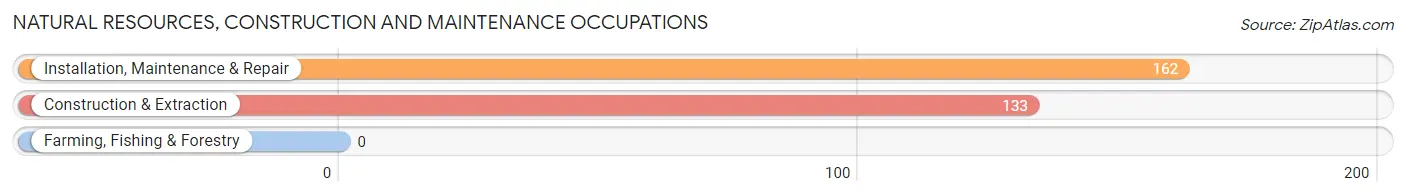
Natural Resources, Construction and Maintenance Occupations by Sex
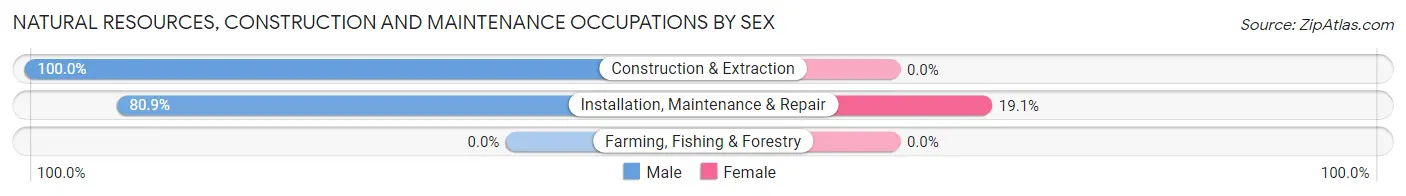
| Occupation | Male | Female |
| Farming, Fishing & Forestry | 0 (0.0%) | 0 (0.0%) |
| Construction & Extraction | 133 (100.0%) | 0 (0.0%) |
| Installation, Maintenance & Repair | 131 (80.9%) | 31 (19.1%) |
| Total (Category) | 264 (89.5%) | 31 (10.5%) |
| Total (Overall) | 1,268 (44.8%) | 1,562 (55.2%) |
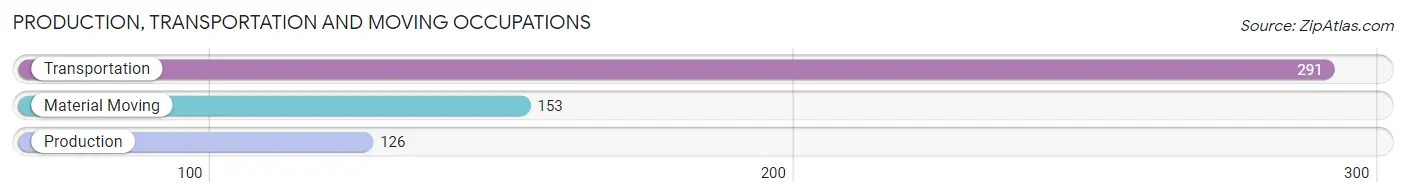
Production, Transportation and Moving Occupations
The most common Production, Transportation and Moving occupations in Jan Phyl Village are Transportation (291 | 10.3%), Material Moving (153 | 5.4%), and Production (126 | 4.4%).
Production, Transportation and Moving Occupations by Sex
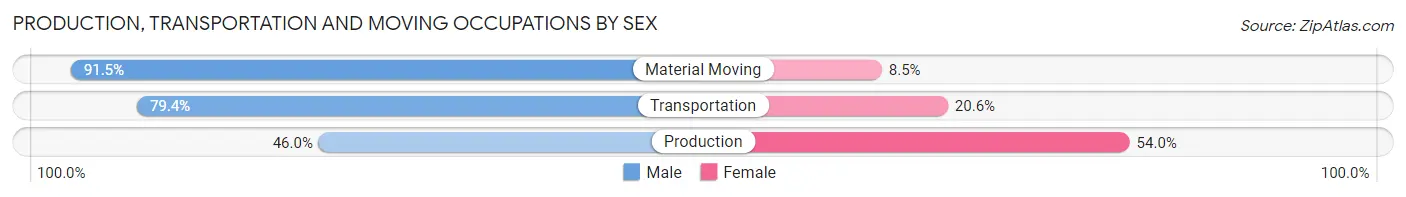
| Occupation | Male | Female |
| Production | 58 (46.0%) | 68 (54.0%) |
| Transportation | 231 (79.4%) | 60 (20.6%) |
| Material Moving | 140 (91.5%) | 13 (8.5%) |
| Total (Category) | 429 (75.3%) | 141 (24.7%) |
| Total (Overall) | 1,268 (44.8%) | 1,562 (55.2%) |
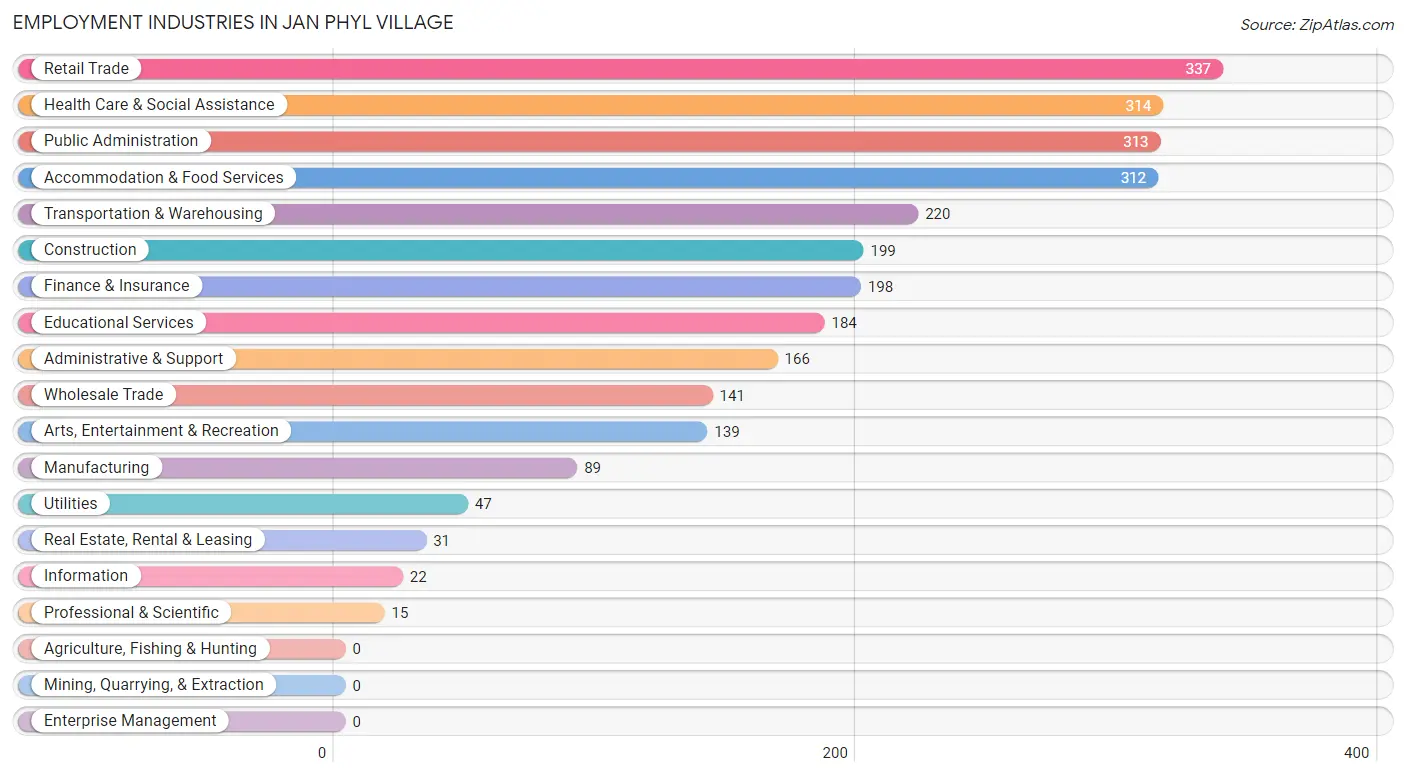
Employment Industries by Sex in Jan Phyl Village
Employment Industries in Jan Phyl Village
The major employment industries in Jan Phyl Village include Retail Trade (337 | 11.9%), Health Care & Social Assistance (314 | 11.1%), Public Administration (313 | 11.1%), Accommodation & Food Services (312 | 11.0%), and Transportation & Warehousing (220 | 7.8%).
Employment Industries by Sex in Jan Phyl Village
The Jan Phyl Village industries that see more men than women are Wholesale Trade (100.0%), Utilities (100.0%), and Real Estate, Rental & Leasing (100.0%), whereas the industries that tend to have a higher number of women are Information (100.0%), Administrative & Support (94.6%), and Health Care & Social Assistance (94.3%).
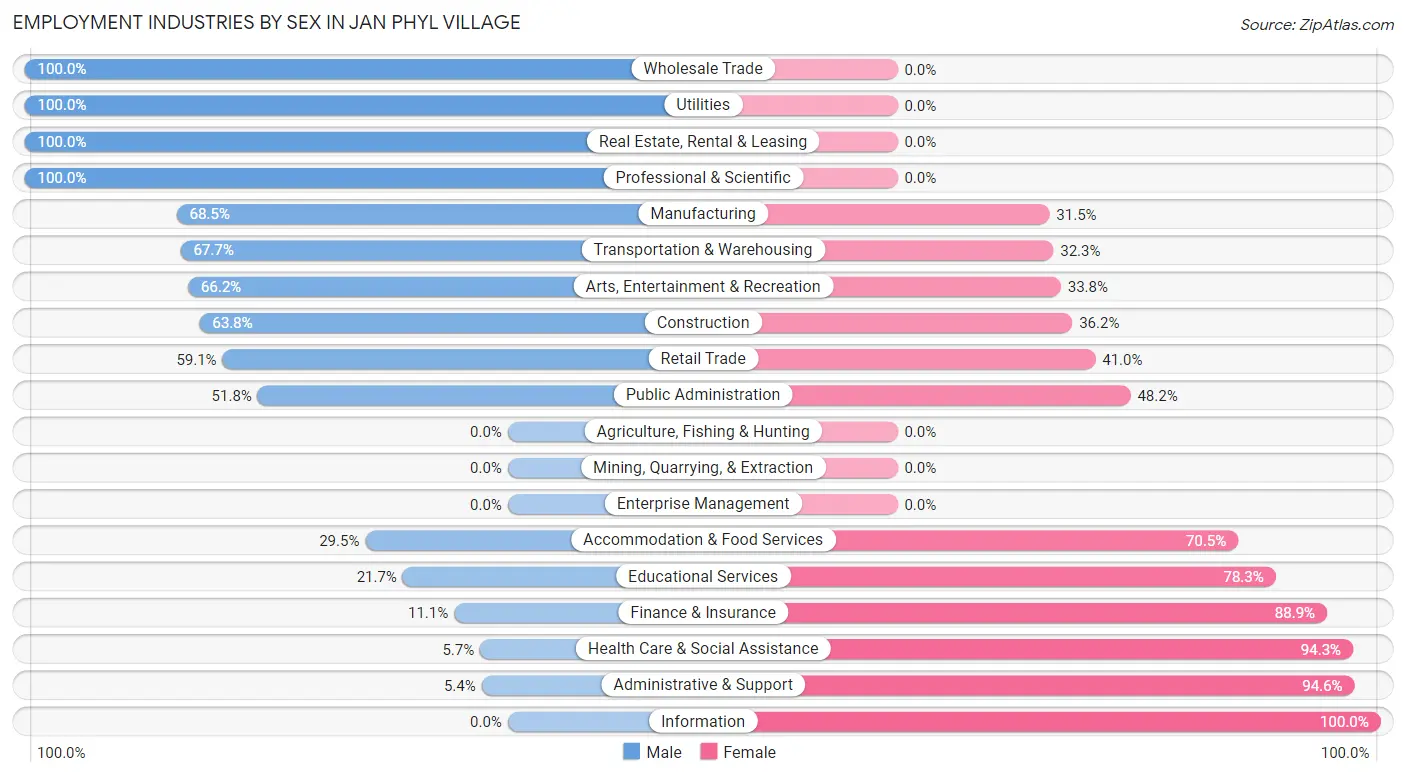
| Industry | Male | Female |
| Agriculture, Fishing & Hunting | 0 (0.0%) | 0 (0.0%) |
| Mining, Quarrying, & Extraction | 0 (0.0%) | 0 (0.0%) |
| Construction | 127 (63.8%) | 72 (36.2%) |
| Manufacturing | 61 (68.5%) | 28 (31.5%) |
| Wholesale Trade | 141 (100.0%) | 0 (0.0%) |
| Retail Trade | 199 (59.1%) | 138 (40.9%) |
| Transportation & Warehousing | 149 (67.7%) | 71 (32.3%) |
| Utilities | 47 (100.0%) | 0 (0.0%) |
| Information | 0 (0.0%) | 22 (100.0%) |
| Finance & Insurance | 22 (11.1%) | 176 (88.9%) |
| Real Estate, Rental & Leasing | 31 (100.0%) | 0 (0.0%) |
| Professional & Scientific | 15 (100.0%) | 0 (0.0%) |
| Enterprise Management | 0 (0.0%) | 0 (0.0%) |
| Administrative & Support | 9 (5.4%) | 157 (94.6%) |
| Educational Services | 40 (21.7%) | 144 (78.3%) |
| Health Care & Social Assistance | 18 (5.7%) | 296 (94.3%) |
| Arts, Entertainment & Recreation | 92 (66.2%) | 47 (33.8%) |
| Accommodation & Food Services | 92 (29.5%) | 220 (70.5%) |
| Public Administration | 162 (51.8%) | 151 (48.2%) |
| Total | 1,268 (44.8%) | 1,562 (55.2%) |
Education in Jan Phyl Village
School Enrollment in Jan Phyl Village
The most common levels of schooling among the 1,465 students in Jan Phyl Village are middle school (415 | 28.3%), high school (377 | 25.7%), and elementary school (308 | 21.0%).
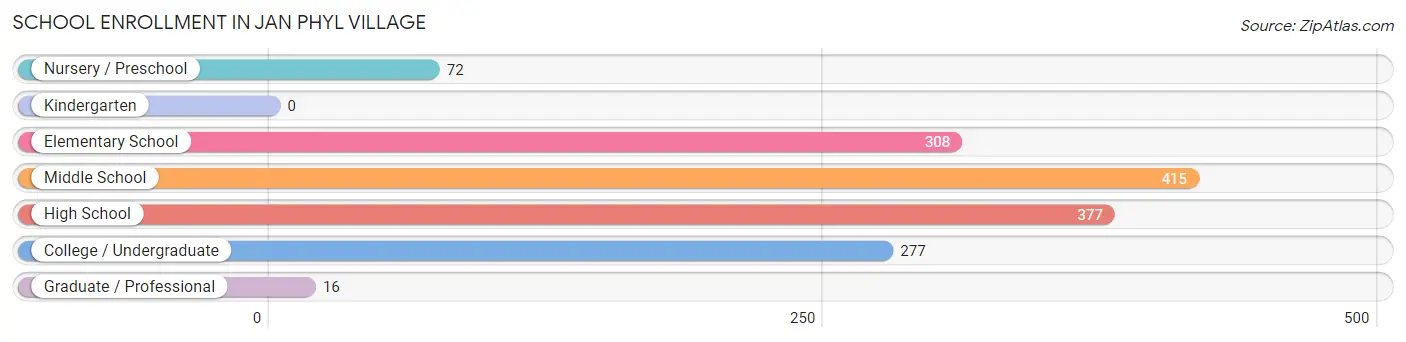
| School Level | # Students | % Students |
| Nursery / Preschool | 72 | 4.9% |
| Kindergarten | 0 | 0.0% |
| Elementary School | 308 | 21.0% |
| Middle School | 415 | 28.3% |
| High School | 377 | 25.7% |
| College / Undergraduate | 277 | 18.9% |
| Graduate / Professional | 16 | 1.1% |
| Total | 1,465 | 100.0% |
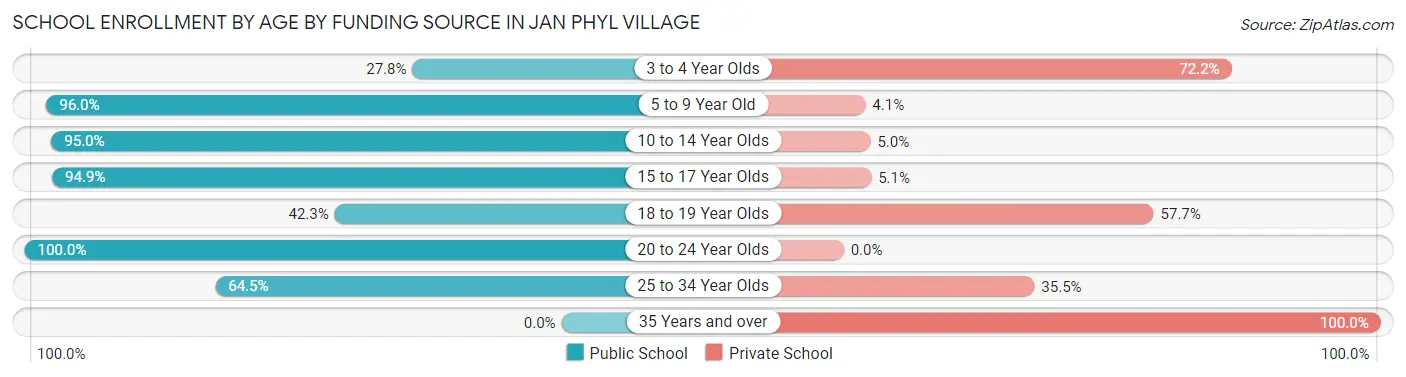
School Enrollment by Age by Funding Source in Jan Phyl Village
Out of a total of 1,465 students who are enrolled in schools in Jan Phyl Village, 202 (13.8%) attend a private institution, while the remaining 1,263 (86.2%) are enrolled in public schools. The age group of 35 years and over has the highest likelihood of being enrolled in private schools, with 16 (100.0% in the age bracket) enrolled. Conversely, the age group of 20 to 24 year olds has the lowest likelihood of being enrolled in a private school, with 143 (100.0% in the age bracket) attending a public institution.
| Age Bracket | Public School | Private School |
| 3 to 4 Year Olds | 20 (27.8%) | 52 (72.2%) |
| 5 to 9 Year Old | 237 (96.0%) | 10 (4.1%) |
| 10 to 14 Year Olds | 514 (95.0%) | 27 (5.0%) |
| 15 to 17 Year Olds | 259 (94.9%) | 14 (5.1%) |
| 18 to 19 Year Olds | 41 (42.3%) | 56 (57.7%) |
| 20 to 24 Year Olds | 143 (100.0%) | 0 (0.0%) |
| 25 to 34 Year Olds | 49 (64.5%) | 27 (35.5%) |
| 35 Years and over | 0 (0.0%) | 16 (100.0%) |
| Total | 1,263 (86.2%) | 202 (13.8%) |
Educational Attainment by Field of Study in Jan Phyl Village
Business (275 | 43.0%), education (106 | 16.6%), arts & humanities (85 | 13.3%), science & technology (57 | 8.9%), and social sciences (34 | 5.3%) are the most common fields of study among 640 individuals in Jan Phyl Village who have obtained a bachelor's degree or higher.
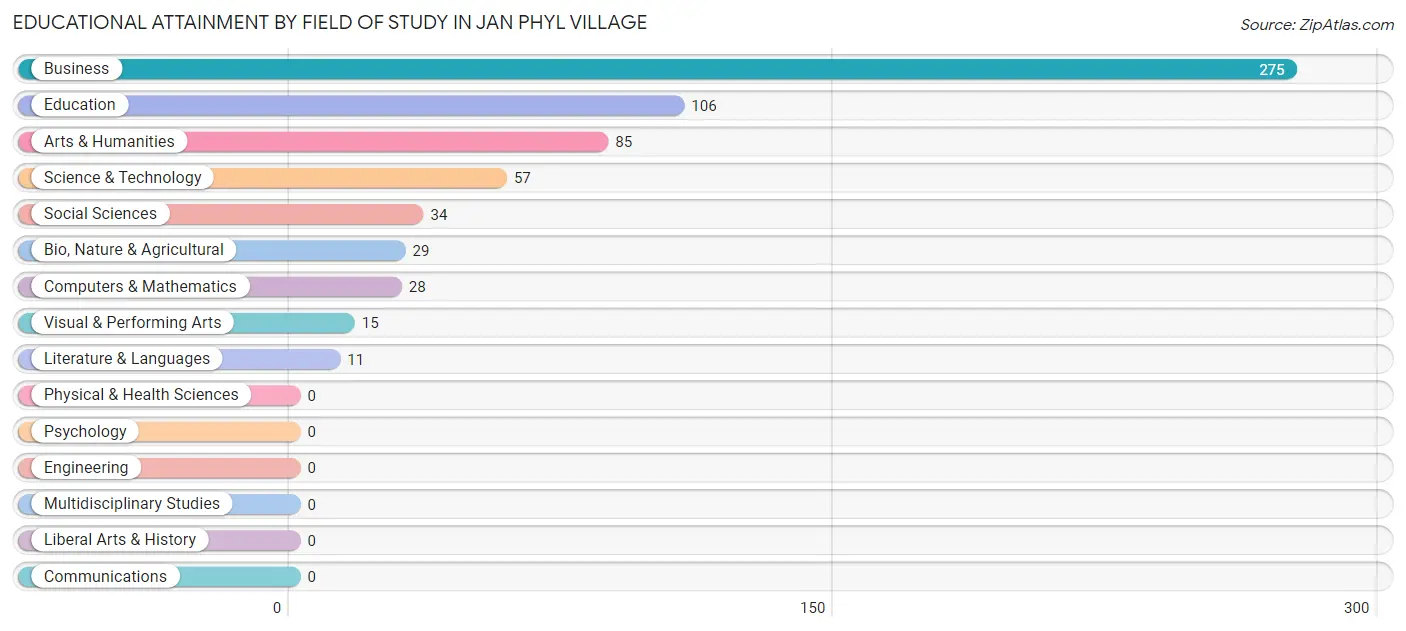
| Field of Study | # Graduates | % Graduates |
| Computers & Mathematics | 28 | 4.4% |
| Bio, Nature & Agricultural | 29 | 4.5% |
| Physical & Health Sciences | 0 | 0.0% |
| Psychology | 0 | 0.0% |
| Social Sciences | 34 | 5.3% |
| Engineering | 0 | 0.0% |
| Multidisciplinary Studies | 0 | 0.0% |
| Science & Technology | 57 | 8.9% |
| Business | 275 | 43.0% |
| Education | 106 | 16.6% |
| Literature & Languages | 11 | 1.7% |
| Liberal Arts & History | 0 | 0.0% |
| Visual & Performing Arts | 15 | 2.3% |
| Communications | 0 | 0.0% |
| Arts & Humanities | 85 | 13.3% |
| Total | 640 | 100.0% |
Transportation & Commute in Jan Phyl Village
Vehicle Availability by Sex in Jan Phyl Village
The most prevalent vehicle ownership categories in Jan Phyl Village are males with 2 vehicles (586, accounting for 46.7%) and females with 2 vehicles (811, making up 38.4%).
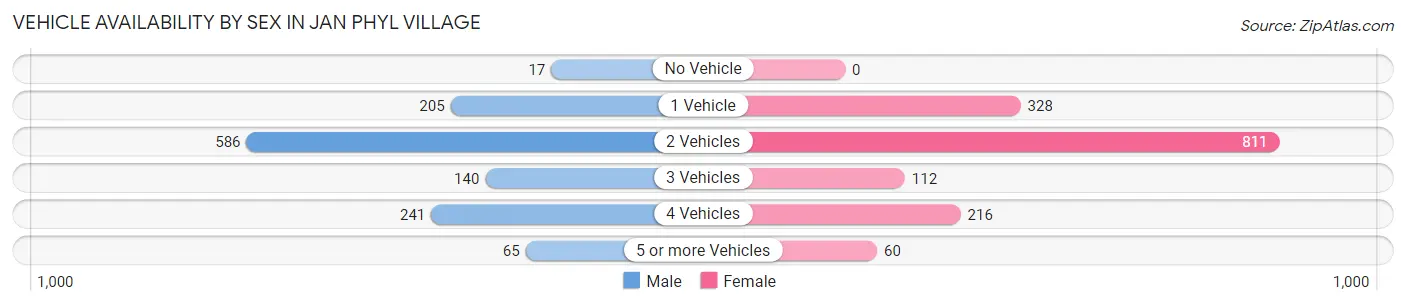
| Vehicles Available | Male | Female |
| No Vehicle | 17 (1.4%) | 0 (0.0%) |
| 1 Vehicle | 205 (16.4%) | 328 (21.5%) |
| 2 Vehicles | 586 (46.7%) | 811 (53.1%) |
| 3 Vehicles | 140 (11.2%) | 112 (7.3%) |
| 4 Vehicles | 241 (19.2%) | 216 (14.1%) |
| 5 or more Vehicles | 65 (5.2%) | 60 (3.9%) |
| Total | 1,254 (100.0%) | 1,527 (100.0%) |
Commute Time in Jan Phyl Village
The most frequently occuring commute durations in Jan Phyl Village are 30 to 34 minutes (782 commuters, 29.9%), 15 to 19 minutes (416 commuters, 15.9%), and 25 to 29 minutes (275 commuters, 10.5%).
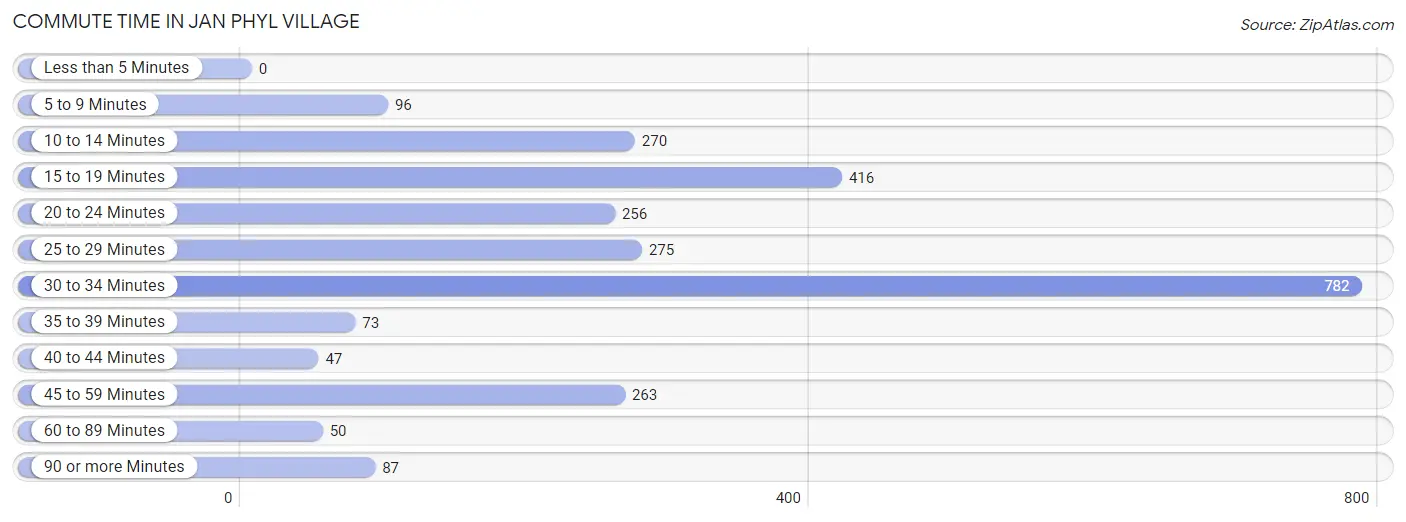
| Commute Time | # Commuters | % Commuters |
| Less than 5 Minutes | 0 | 0.0% |
| 5 to 9 Minutes | 96 | 3.7% |
| 10 to 14 Minutes | 270 | 10.3% |
| 15 to 19 Minutes | 416 | 15.9% |
| 20 to 24 Minutes | 256 | 9.8% |
| 25 to 29 Minutes | 275 | 10.5% |
| 30 to 34 Minutes | 782 | 29.9% |
| 35 to 39 Minutes | 73 | 2.8% |
| 40 to 44 Minutes | 47 | 1.8% |
| 45 to 59 Minutes | 263 | 10.1% |
| 60 to 89 Minutes | 50 | 1.9% |
| 90 or more Minutes | 87 | 3.3% |
Commute Time by Sex in Jan Phyl Village
The most common commute times in Jan Phyl Village are 30 to 34 minutes (434 commuters, 34.6%) for males and 30 to 34 minutes (348 commuters, 25.6%) for females.
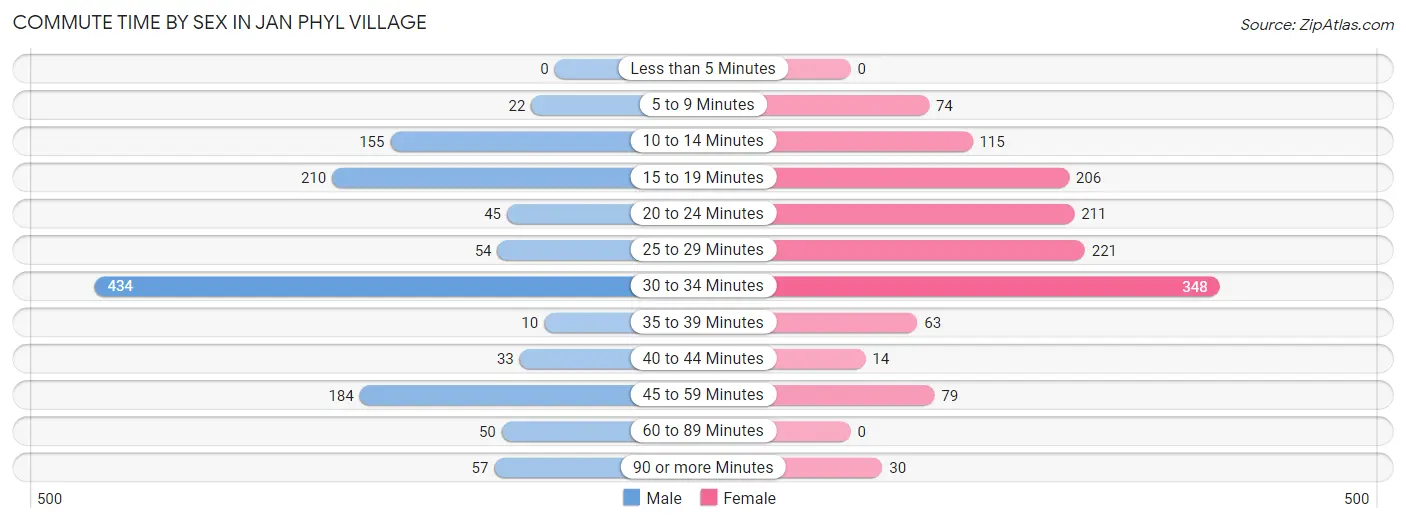
| Commute Time | Male | Female |
| Less than 5 Minutes | 0 (0.0%) | 0 (0.0%) |
| 5 to 9 Minutes | 22 (1.8%) | 74 (5.4%) |
| 10 to 14 Minutes | 155 (12.4%) | 115 (8.5%) |
| 15 to 19 Minutes | 210 (16.8%) | 206 (15.1%) |
| 20 to 24 Minutes | 45 (3.6%) | 211 (15.5%) |
| 25 to 29 Minutes | 54 (4.3%) | 221 (16.2%) |
| 30 to 34 Minutes | 434 (34.6%) | 348 (25.6%) |
| 35 to 39 Minutes | 10 (0.8%) | 63 (4.6%) |
| 40 to 44 Minutes | 33 (2.6%) | 14 (1.0%) |
| 45 to 59 Minutes | 184 (14.7%) | 79 (5.8%) |
| 60 to 89 Minutes | 50 (4.0%) | 0 (0.0%) |
| 90 or more Minutes | 57 (4.5%) | 30 (2.2%) |
Time of Departure to Work by Sex in Jan Phyl Village
The most frequent times of departure to work in Jan Phyl Village are 7:00 AM to 7:29 AM (249, 19.9%) for males and 7:30 AM to 7:59 AM (236, 17.3%) for females.
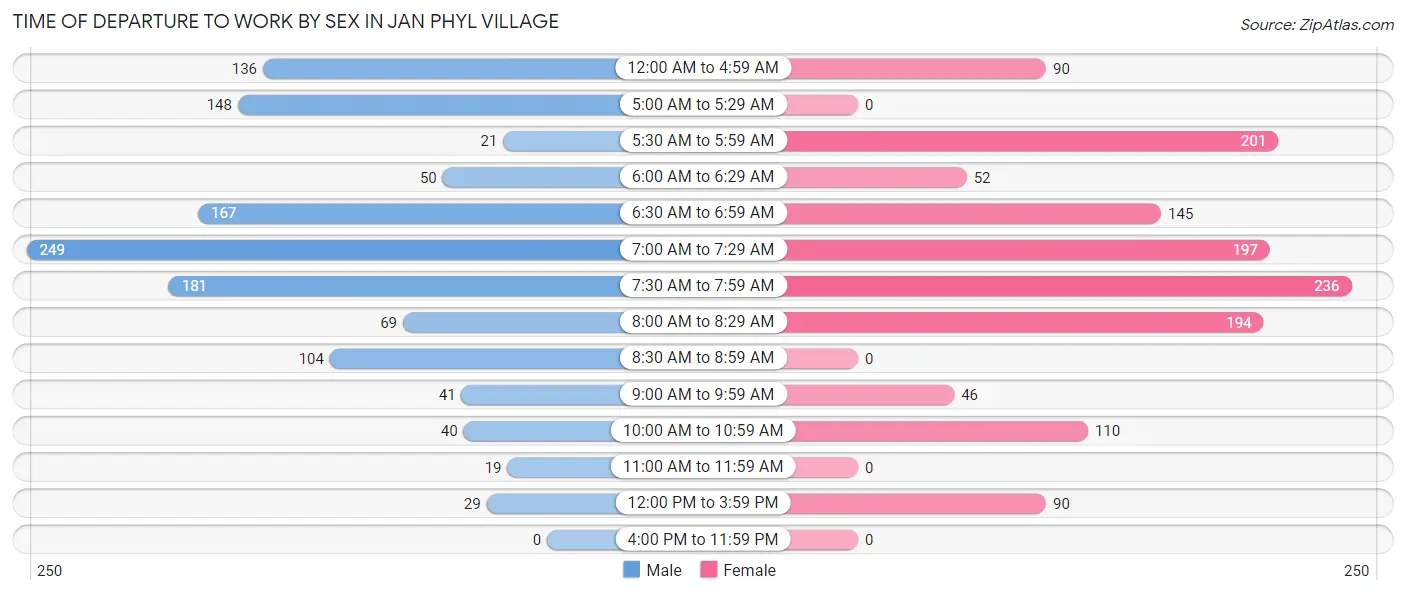
| Time of Departure | Male | Female |
| 12:00 AM to 4:59 AM | 136 (10.8%) | 90 (6.6%) |
| 5:00 AM to 5:29 AM | 148 (11.8%) | 0 (0.0%) |
| 5:30 AM to 5:59 AM | 21 (1.7%) | 201 (14.8%) |
| 6:00 AM to 6:29 AM | 50 (4.0%) | 52 (3.8%) |
| 6:30 AM to 6:59 AM | 167 (13.3%) | 145 (10.6%) |
| 7:00 AM to 7:29 AM | 249 (19.9%) | 197 (14.5%) |
| 7:30 AM to 7:59 AM | 181 (14.4%) | 236 (17.3%) |
| 8:00 AM to 8:29 AM | 69 (5.5%) | 194 (14.2%) |
| 8:30 AM to 8:59 AM | 104 (8.3%) | 0 (0.0%) |
| 9:00 AM to 9:59 AM | 41 (3.3%) | 46 (3.4%) |
| 10:00 AM to 10:59 AM | 40 (3.2%) | 110 (8.1%) |
| 11:00 AM to 11:59 AM | 19 (1.5%) | 0 (0.0%) |
| 12:00 PM to 3:59 PM | 29 (2.3%) | 90 (6.6%) |
| 4:00 PM to 11:59 PM | 0 (0.0%) | 0 (0.0%) |
| Total | 1,254 (100.0%) | 1,361 (100.0%) |
Housing Occupancy in Jan Phyl Village
Occupancy by Ownership in Jan Phyl Village
Of the total 2,199 dwellings in Jan Phyl Village, owner-occupied units account for 1,501 (68.3%), while renter-occupied units make up 698 (31.7%).
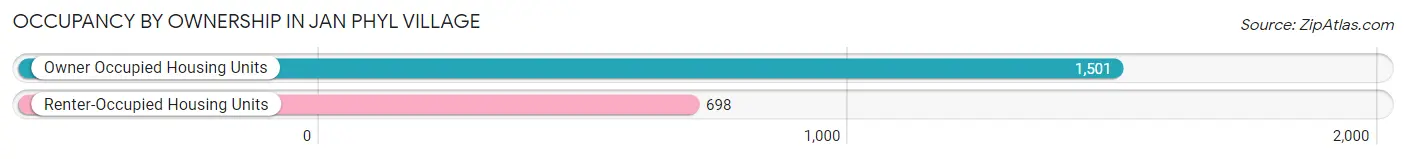
| Occupancy | # Housing Units | % Housing Units |
| Owner Occupied Housing Units | 1,501 | 68.3% |
| Renter-Occupied Housing Units | 698 | 31.7% |
| Total Occupied Housing Units | 2,199 | 100.0% |
Occupancy by Household Size in Jan Phyl Village
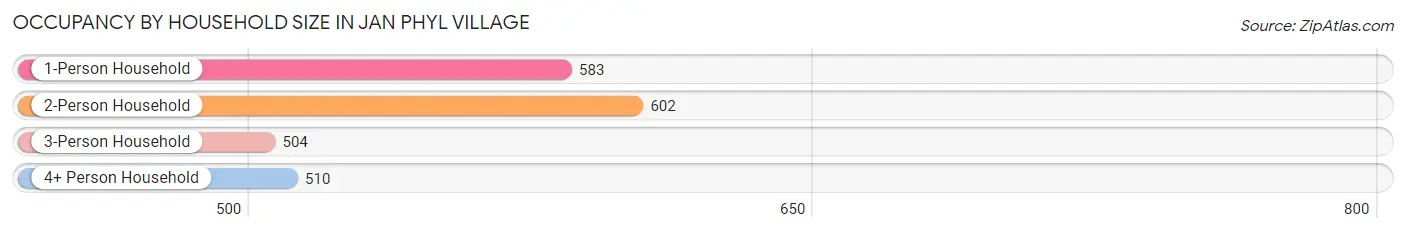
| Household Size | # Housing Units | % Housing Units |
| 1-Person Household | 583 | 26.5% |
| 2-Person Household | 602 | 27.4% |
| 3-Person Household | 504 | 22.9% |
| 4+ Person Household | 510 | 23.2% |
| Total Housing Units | 2,199 | 100.0% |
Occupancy by Ownership by Household Size in Jan Phyl Village
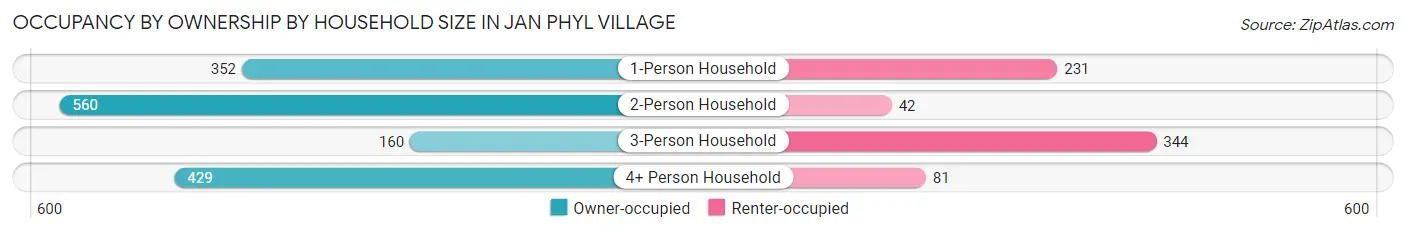
| Household Size | Owner-occupied | Renter-occupied |
| 1-Person Household | 352 (60.4%) | 231 (39.6%) |
| 2-Person Household | 560 (93.0%) | 42 (7.0%) |
| 3-Person Household | 160 (31.8%) | 344 (68.2%) |
| 4+ Person Household | 429 (84.1%) | 81 (15.9%) |
| Total Housing Units | 1,501 (68.3%) | 698 (31.7%) |
Occupancy by Educational Attainment in Jan Phyl Village
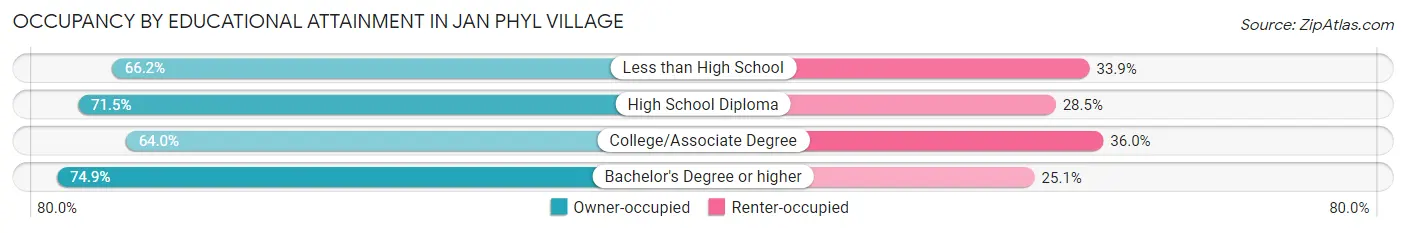
| Household Size | Owner-occupied | Renter-occupied |
| Less than High School | 340 (66.1%) | 174 (33.9%) |
| High School Diploma | 427 (71.5%) | 170 (28.5%) |
| College/Associate Degree | 472 (64.0%) | 266 (36.0%) |
| Bachelor's Degree or higher | 262 (74.9%) | 88 (25.1%) |
Occupancy by Age of Householder in Jan Phyl Village
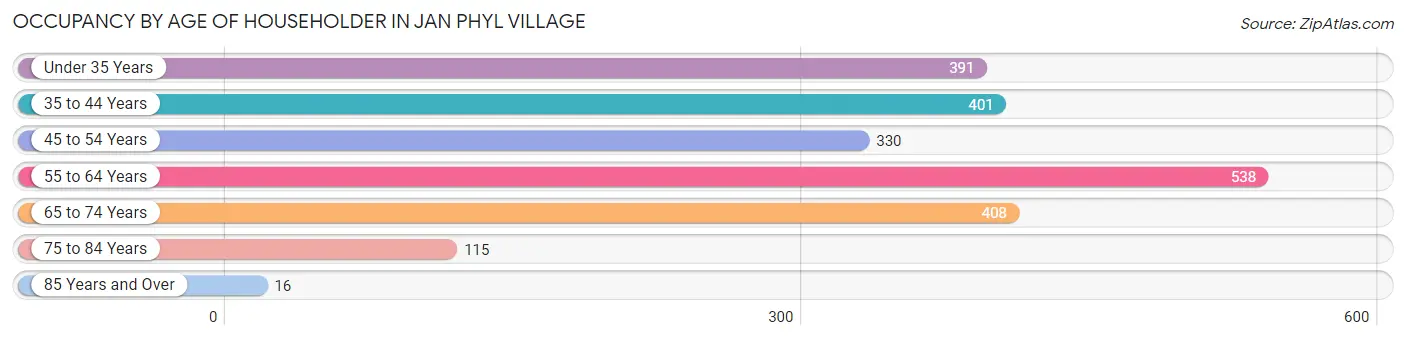
| Age Bracket | # Households | % Households |
| Under 35 Years | 391 | 17.8% |
| 35 to 44 Years | 401 | 18.2% |
| 45 to 54 Years | 330 | 15.0% |
| 55 to 64 Years | 538 | 24.5% |
| 65 to 74 Years | 408 | 18.5% |
| 75 to 84 Years | 115 | 5.2% |
| 85 Years and Over | 16 | 0.7% |
| Total | 2,199 | 100.0% |
Housing Finances in Jan Phyl Village
Median Income by Occupancy in Jan Phyl Village
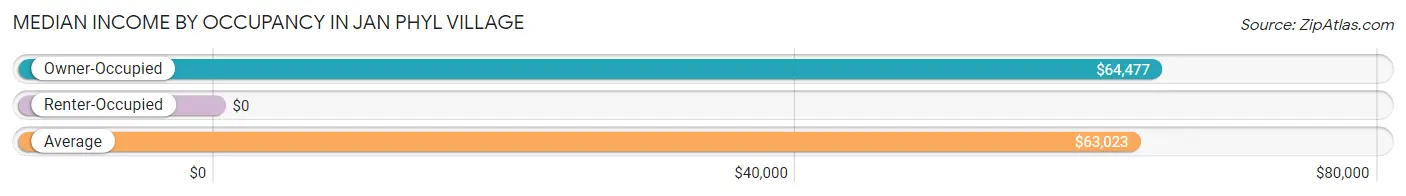
| Occupancy Type | # Households | Median Income |
| Owner-Occupied | 1,501 (68.3%) | $64,477 |
| Renter-Occupied | 698 (31.7%) | $0 |
| Average | 2,199 (100.0%) | $63,023 |
Occupancy by Householder Income Bracket in Jan Phyl Village
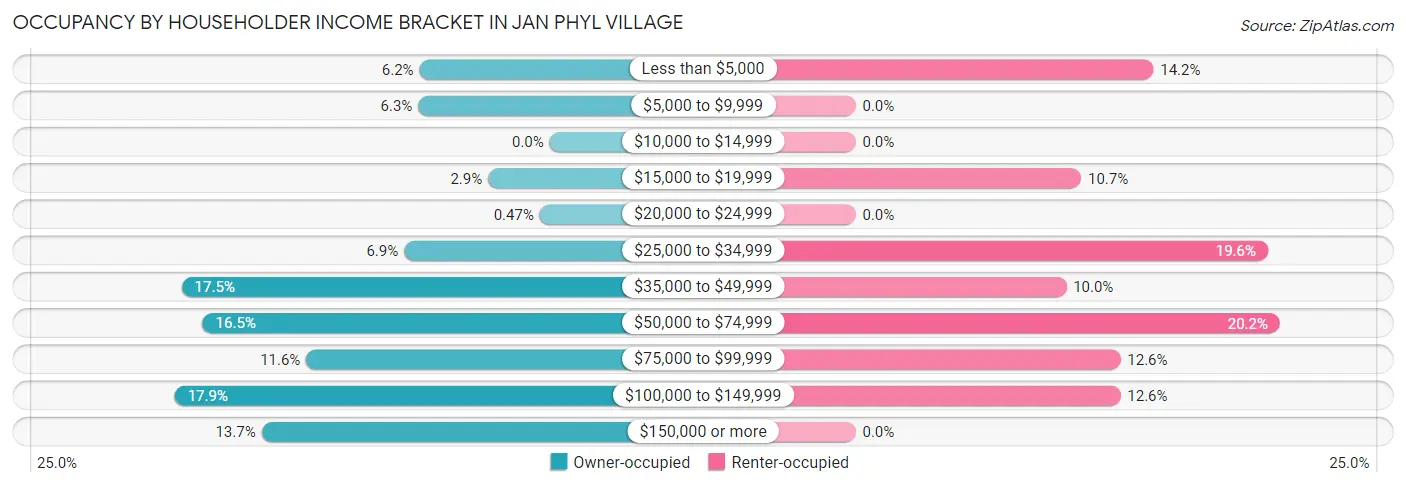
| Income Bracket | Owner-occupied | Renter-occupied |
| Less than $5,000 | 93 (6.2%) | 99 (14.2%) |
| $5,000 to $9,999 | 94 (6.3%) | 0 (0.0%) |
| $10,000 to $14,999 | 0 (0.0%) | 0 (0.0%) |
| $15,000 to $19,999 | 44 (2.9%) | 75 (10.7%) |
| $20,000 to $24,999 | 7 (0.5%) | 0 (0.0%) |
| $25,000 to $34,999 | 104 (6.9%) | 137 (19.6%) |
| $35,000 to $49,999 | 263 (17.5%) | 70 (10.0%) |
| $50,000 to $74,999 | 248 (16.5%) | 141 (20.2%) |
| $75,000 to $99,999 | 174 (11.6%) | 88 (12.6%) |
| $100,000 to $149,999 | 268 (17.8%) | 88 (12.6%) |
| $150,000 or more | 206 (13.7%) | 0 (0.0%) |
| Total | 1,501 (100.0%) | 698 (100.0%) |
Monthly Housing Cost Tiers in Jan Phyl Village
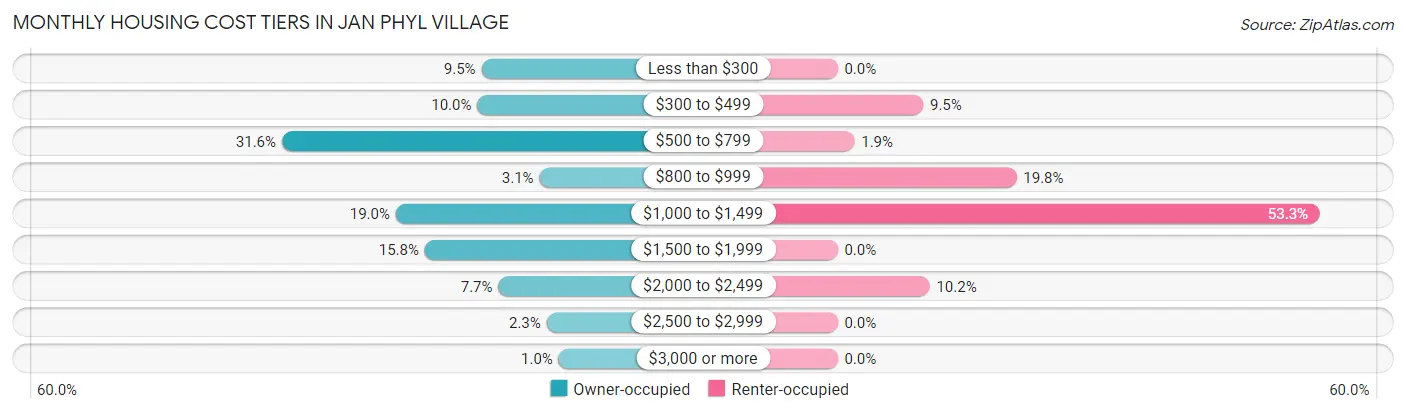
| Monthly Cost | Owner-occupied | Renter-occupied |
| Less than $300 | 143 (9.5%) | 0 (0.0%) |
| $300 to $499 | 150 (10.0%) | 66 (9.5%) |
| $500 to $799 | 474 (31.6%) | 13 (1.9%) |
| $800 to $999 | 47 (3.1%) | 138 (19.8%) |
| $1,000 to $1,499 | 285 (19.0%) | 372 (53.3%) |
| $1,500 to $1,999 | 237 (15.8%) | 0 (0.0%) |
| $2,000 to $2,499 | 115 (7.7%) | 71 (10.2%) |
| $2,500 to $2,999 | 35 (2.3%) | 0 (0.0%) |
| $3,000 or more | 15 (1.0%) | 0 (0.0%) |
| Total | 1,501 (100.0%) | 698 (100.0%) |
Physical Housing Characteristics in Jan Phyl Village
Housing Structures in Jan Phyl Village
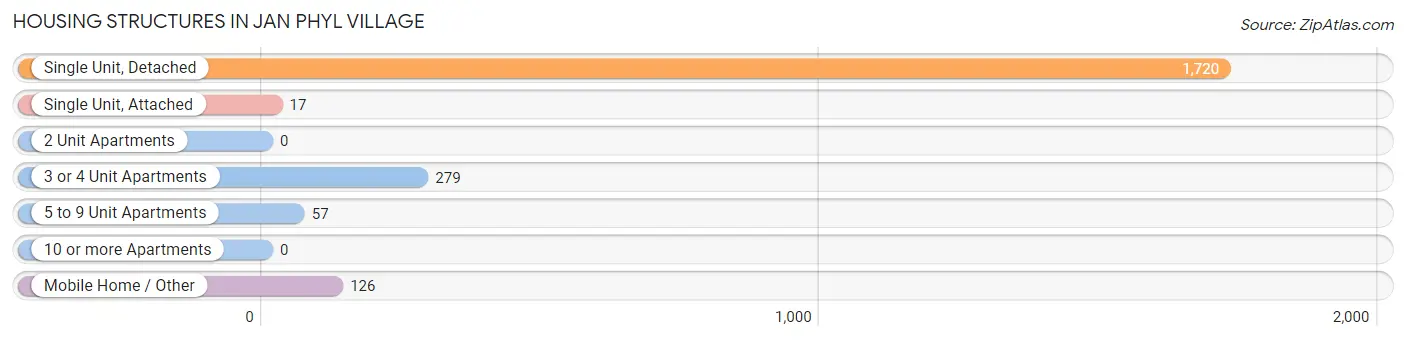
| Structure Type | # Housing Units | % Housing Units |
| Single Unit, Detached | 1,720 | 78.2% |
| Single Unit, Attached | 17 | 0.8% |
| 2 Unit Apartments | 0 | 0.0% |
| 3 or 4 Unit Apartments | 279 | 12.7% |
| 5 to 9 Unit Apartments | 57 | 2.6% |
| 10 or more Apartments | 0 | 0.0% |
| Mobile Home / Other | 126 | 5.7% |
| Total | 2,199 | 100.0% |
Housing Structures by Occupancy in Jan Phyl Village
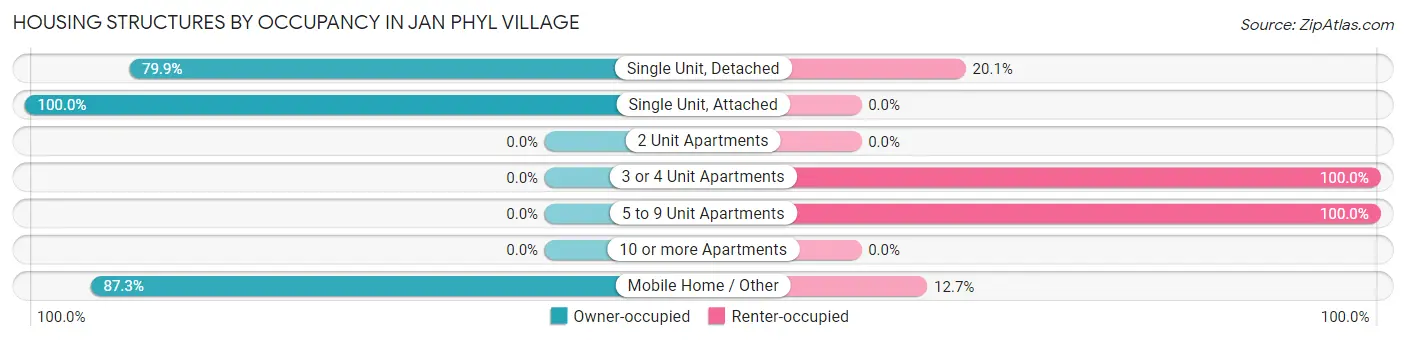
| Structure Type | Owner-occupied | Renter-occupied |
| Single Unit, Detached | 1,374 (79.9%) | 346 (20.1%) |
| Single Unit, Attached | 17 (100.0%) | 0 (0.0%) |
| 2 Unit Apartments | 0 (0.0%) | 0 (0.0%) |
| 3 or 4 Unit Apartments | 0 (0.0%) | 279 (100.0%) |
| 5 to 9 Unit Apartments | 0 (0.0%) | 57 (100.0%) |
| 10 or more Apartments | 0 (0.0%) | 0 (0.0%) |
| Mobile Home / Other | 110 (87.3%) | 16 (12.7%) |
| Total | 1,501 (68.3%) | 698 (31.7%) |
Housing Structures by Number of Rooms in Jan Phyl Village
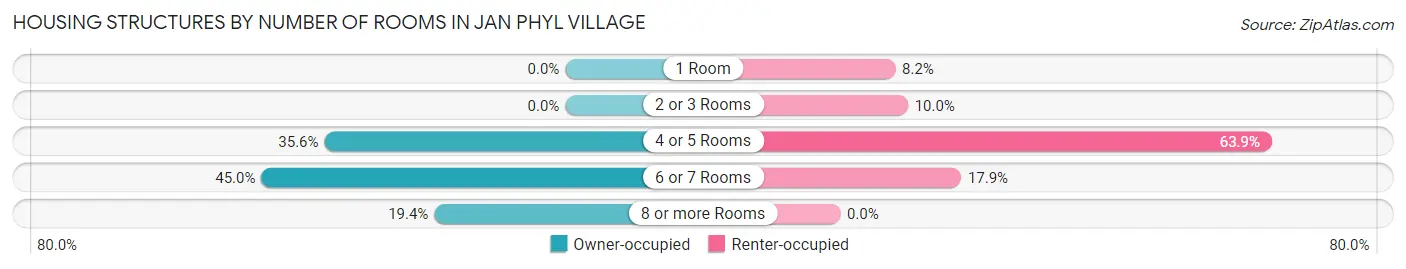
| Number of Rooms | Owner-occupied | Renter-occupied |
| 1 Room | 0 (0.0%) | 57 (8.2%) |
| 2 or 3 Rooms | 0 (0.0%) | 70 (10.0%) |
| 4 or 5 Rooms | 535 (35.6%) | 446 (63.9%) |
| 6 or 7 Rooms | 675 (45.0%) | 125 (17.9%) |
| 8 or more Rooms | 291 (19.4%) | 0 (0.0%) |
| Total | 1,501 (100.0%) | 698 (100.0%) |
Housing Structure by Heating Type in Jan Phyl Village
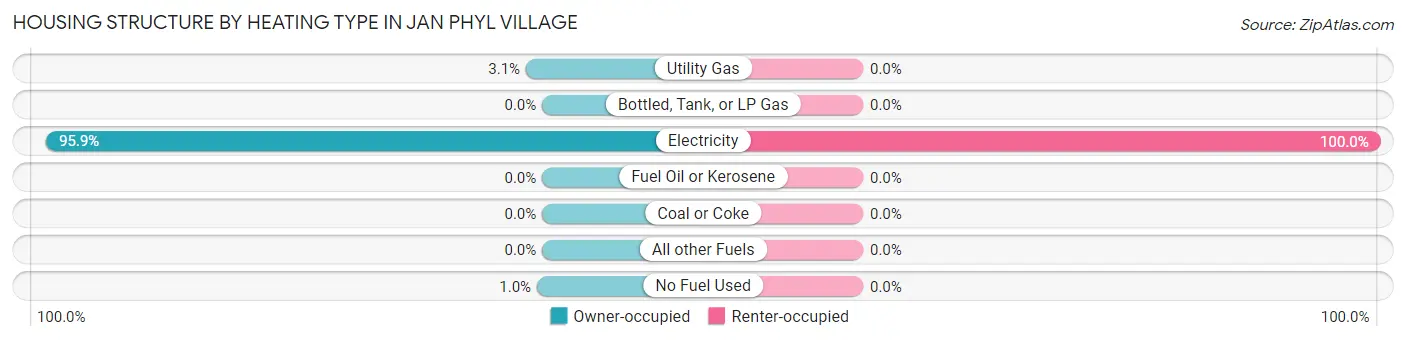
| Heating Type | Owner-occupied | Renter-occupied |
| Utility Gas | 47 (3.1%) | 0 (0.0%) |
| Bottled, Tank, or LP Gas | 0 (0.0%) | 0 (0.0%) |
| Electricity | 1,439 (95.9%) | 698 (100.0%) |
| Fuel Oil or Kerosene | 0 (0.0%) | 0 (0.0%) |
| Coal or Coke | 0 (0.0%) | 0 (0.0%) |
| All other Fuels | 0 (0.0%) | 0 (0.0%) |
| No Fuel Used | 15 (1.0%) | 0 (0.0%) |
| Total | 1,501 (100.0%) | 698 (100.0%) |
Household Vehicle Usage in Jan Phyl Village
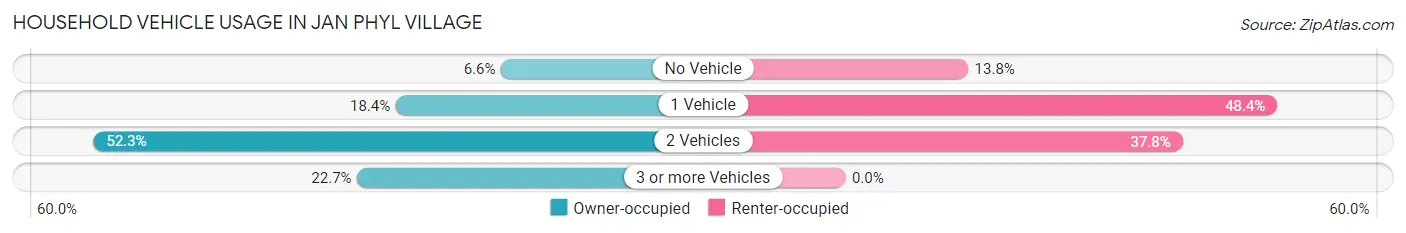
| Vehicles per Household | Owner-occupied | Renter-occupied |
| No Vehicle | 99 (6.6%) | 96 (13.8%) |
| 1 Vehicle | 276 (18.4%) | 338 (48.4%) |
| 2 Vehicles | 785 (52.3%) | 264 (37.8%) |
| 3 or more Vehicles | 341 (22.7%) | 0 (0.0%) |
| Total | 1,501 (100.0%) | 698 (100.0%) |
Real Estate & Mortgages in Jan Phyl Village
Real Estate and Mortgage Overview in Jan Phyl Village
| Characteristic | Without Mortgage | With Mortgage |
| Housing Units | 505 | 996 |
| Median Property Value | $200,400 | $215,300 |
| Median Household Income | $74,111 | $123 |
| Monthly Housing Costs | $429 | $15 |
| Real Estate Taxes | $920 | $11 |
Property Value by Mortgage Status in Jan Phyl Village
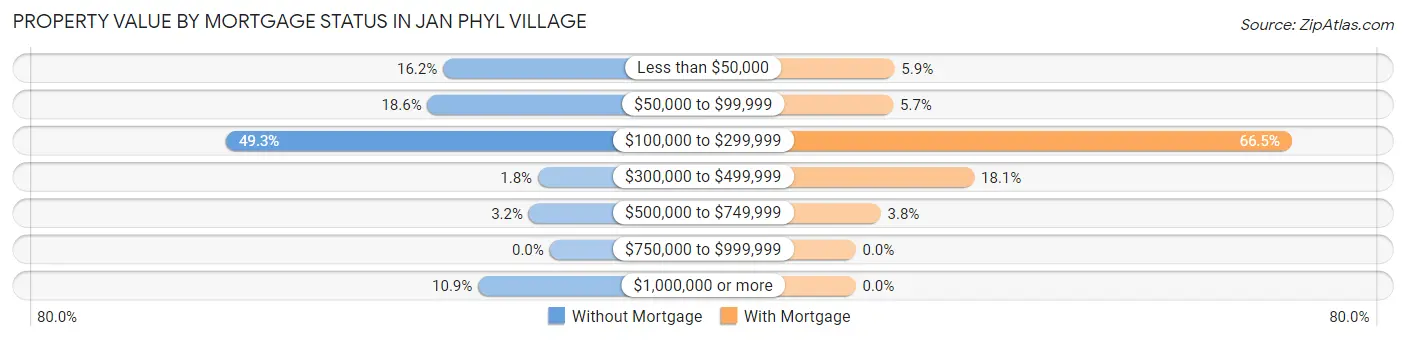
| Property Value | Without Mortgage | With Mortgage |
| Less than $50,000 | 82 (16.2%) | 59 (5.9%) |
| $50,000 to $99,999 | 94 (18.6%) | 57 (5.7%) |
| $100,000 to $299,999 | 249 (49.3%) | 662 (66.5%) |
| $300,000 to $499,999 | 9 (1.8%) | 180 (18.1%) |
| $500,000 to $749,999 | 16 (3.2%) | 38 (3.8%) |
| $750,000 to $999,999 | 0 (0.0%) | 0 (0.0%) |
| $1,000,000 or more | 55 (10.9%) | 0 (0.0%) |
| Total | 505 (100.0%) | 996 (100.0%) |
Household Income by Mortgage Status in Jan Phyl Village
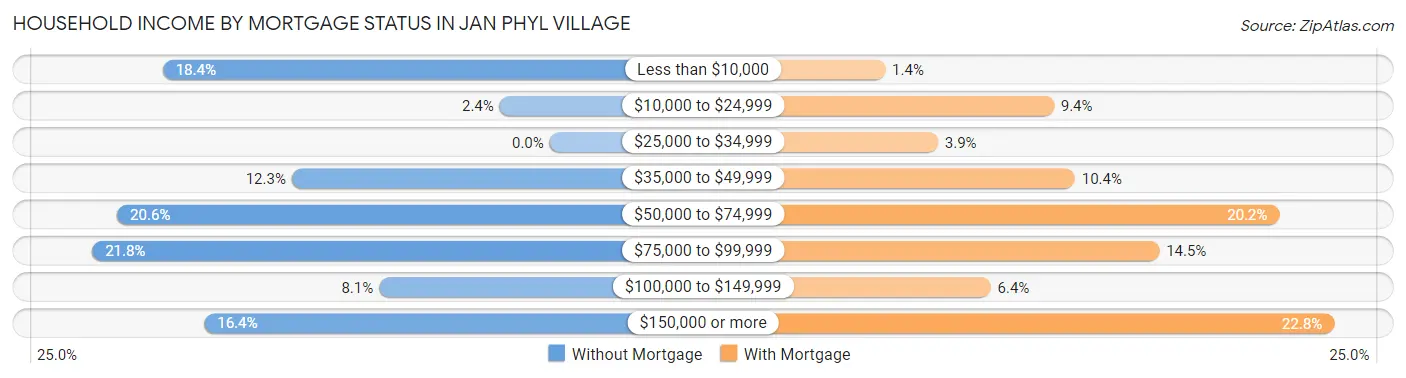
| Household Income | Without Mortgage | With Mortgage |
| Less than $10,000 | 93 (18.4%) | 14 (1.4%) |
| $10,000 to $24,999 | 12 (2.4%) | 94 (9.4%) |
| $25,000 to $34,999 | 0 (0.0%) | 39 (3.9%) |
| $35,000 to $49,999 | 62 (12.3%) | 104 (10.4%) |
| $50,000 to $74,999 | 104 (20.6%) | 201 (20.2%) |
| $75,000 to $99,999 | 110 (21.8%) | 144 (14.5%) |
| $100,000 to $149,999 | 41 (8.1%) | 64 (6.4%) |
| $150,000 or more | 83 (16.4%) | 227 (22.8%) |
| Total | 505 (100.0%) | 996 (100.0%) |
Property Value to Household Income Ratio in Jan Phyl Village
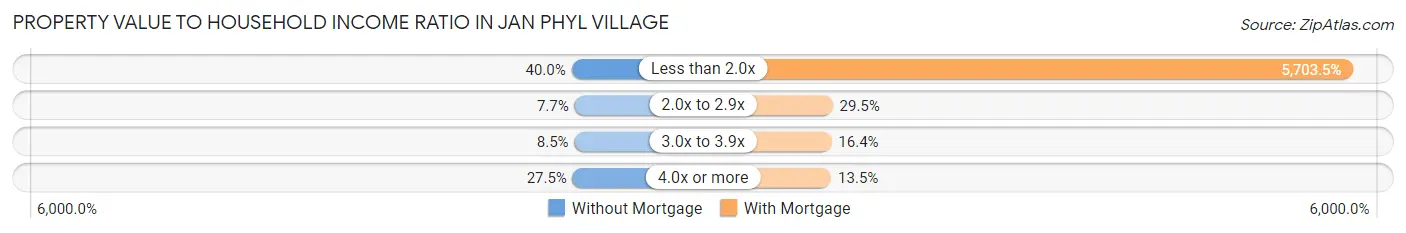
| Value-to-Income Ratio | Without Mortgage | With Mortgage |
| Less than 2.0x | 202 (40.0%) | 56,807 (5,703.5%) |
| 2.0x to 2.9x | 39 (7.7%) | 294 (29.5%) |
| 3.0x to 3.9x | 43 (8.5%) | 163 (16.4%) |
| 4.0x or more | 139 (27.5%) | 134 (13.5%) |
| Total | 505 (100.0%) | 996 (100.0%) |
Real Estate Taxes by Mortgage Status in Jan Phyl Village
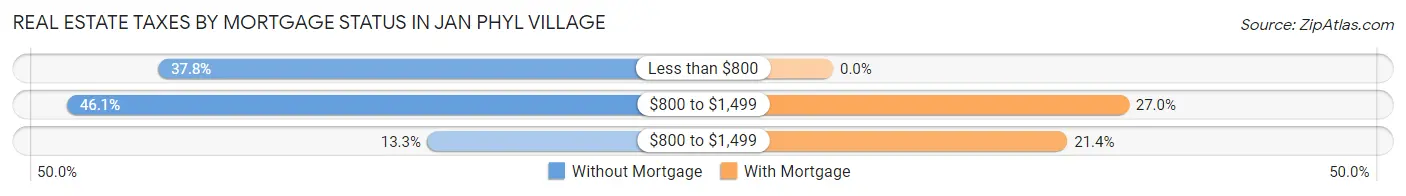
| Property Taxes | Without Mortgage | With Mortgage |
| Less than $800 | 191 (37.8%) | 0 (0.0%) |
| $800 to $1,499 | 233 (46.1%) | 269 (27.0%) |
| $800 to $1,499 | 67 (13.3%) | 213 (21.4%) |
| Total | 505 (100.0%) | 996 (100.0%) |
Health & Disability in Jan Phyl Village
Health Insurance Coverage by Age in Jan Phyl Village
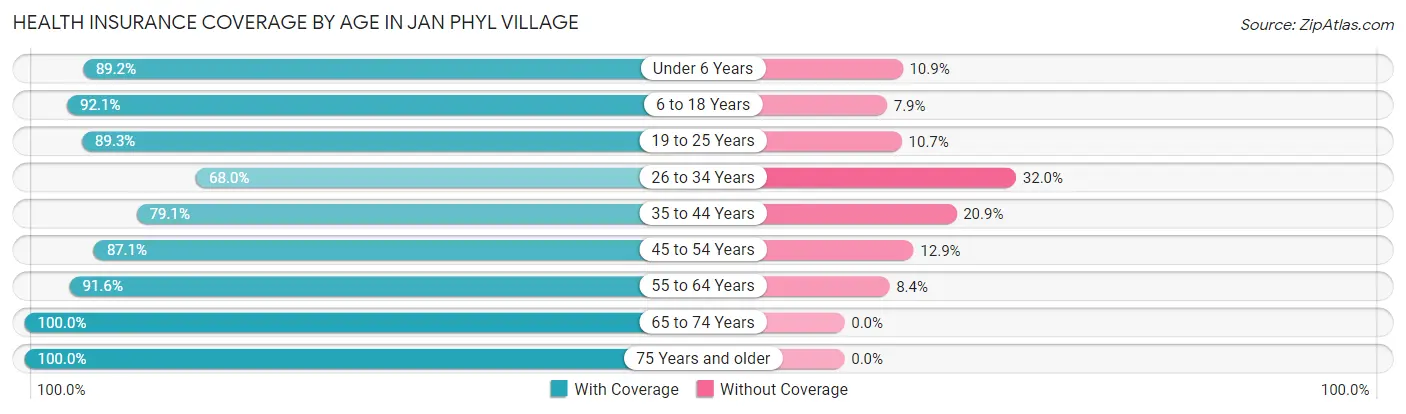
| Age Bracket | With Coverage | Without Coverage |
| Under 6 Years | 452 (89.1%) | 55 (10.8%) |
| 6 to 18 Years | 1,035 (92.1%) | 89 (7.9%) |
| 19 to 25 Years | 543 (89.3%) | 65 (10.7%) |
| 26 to 34 Years | 589 (68.0%) | 277 (32.0%) |
| 35 to 44 Years | 474 (79.1%) | 125 (20.9%) |
| 45 to 54 Years | 615 (87.1%) | 91 (12.9%) |
| 55 to 64 Years | 897 (91.6%) | 82 (8.4%) |
| 65 to 74 Years | 600 (100.0%) | 0 (0.0%) |
| 75 Years and older | 248 (100.0%) | 0 (0.0%) |
| Total | 5,453 (87.4%) | 784 (12.6%) |
Health Insurance Coverage by Citizenship Status in Jan Phyl Village
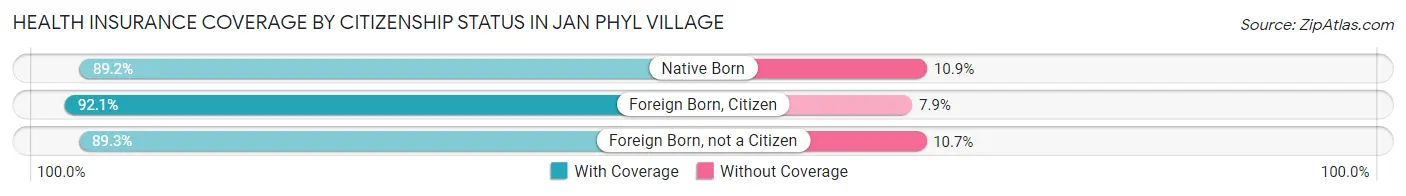
| Citizenship Status | With Coverage | Without Coverage |
| Native Born | 452 (89.1%) | 55 (10.8%) |
| Foreign Born, Citizen | 1,035 (92.1%) | 89 (7.9%) |
| Foreign Born, not a Citizen | 543 (89.3%) | 65 (10.7%) |
Health Insurance Coverage by Household Income in Jan Phyl Village
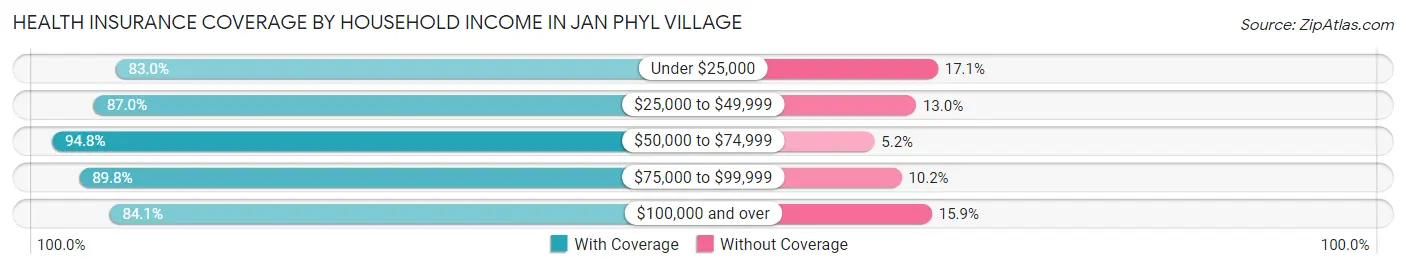
| Household Income | With Coverage | Without Coverage |
| Under $25,000 | 759 (83.0%) | 156 (17.1%) |
| $25,000 to $49,999 | 1,128 (87.0%) | 168 (13.0%) |
| $50,000 to $74,999 | 1,213 (94.8%) | 66 (5.2%) |
| $75,000 to $99,999 | 684 (89.8%) | 78 (10.2%) |
| $100,000 and over | 1,669 (84.1%) | 316 (15.9%) |
Public vs Private Health Insurance Coverage by Age in Jan Phyl Village
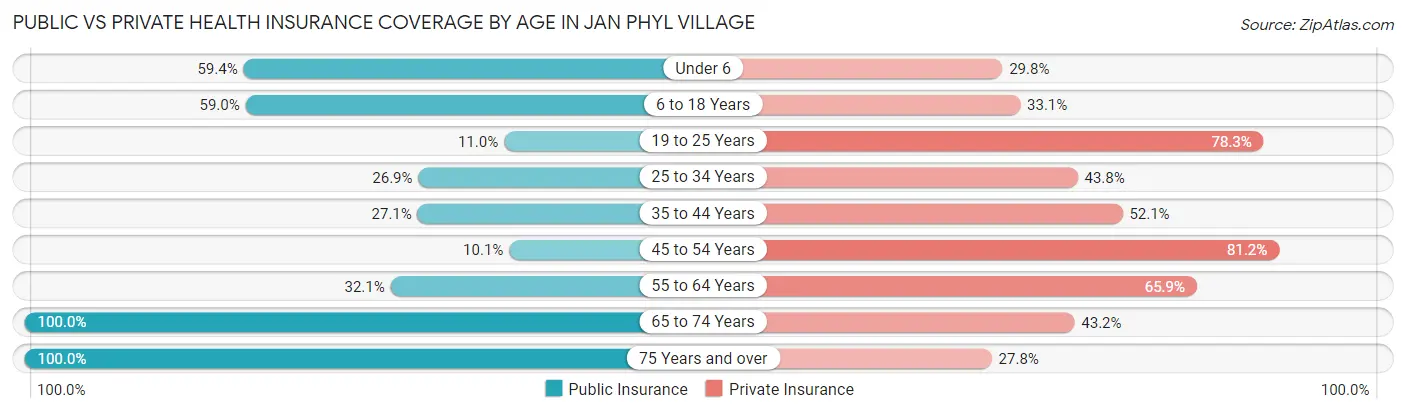
| Age Bracket | Public Insurance | Private Insurance |
| Under 6 | 301 (59.4%) | 151 (29.8%) |
| 6 to 18 Years | 663 (59.0%) | 372 (33.1%) |
| 19 to 25 Years | 67 (11.0%) | 476 (78.3%) |
| 25 to 34 Years | 233 (26.9%) | 379 (43.8%) |
| 35 to 44 Years | 162 (27.1%) | 312 (52.1%) |
| 45 to 54 Years | 71 (10.1%) | 573 (81.2%) |
| 55 to 64 Years | 314 (32.1%) | 645 (65.9%) |
| 65 to 74 Years | 600 (100.0%) | 259 (43.2%) |
| 75 Years and over | 248 (100.0%) | 69 (27.8%) |
| Total | 2,659 (42.6%) | 3,236 (51.9%) |
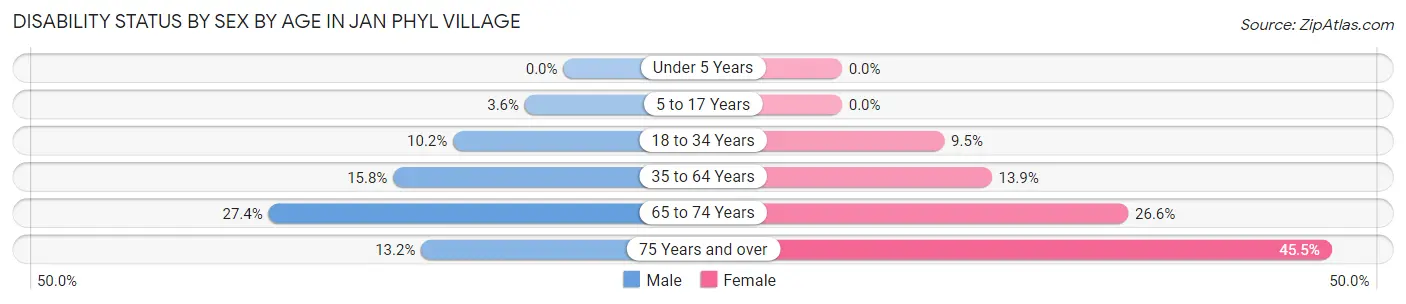
Disability Status by Sex by Age in Jan Phyl Village
| Age Bracket | Male | Female |
| Under 5 Years | 0 (0.0%) | 0 (0.0%) |
| 5 to 17 Years | 23 (3.6%) | 0 (0.0%) |
| 18 to 34 Years | 70 (10.2%) | 81 (9.5%) |
| 35 to 64 Years | 138 (15.8%) | 196 (13.9%) |
| 65 to 74 Years | 55 (27.4%) | 106 (26.6%) |
| 75 Years and over | 24 (13.2%) | 30 (45.5%) |
Disability Class by Sex by Age in Jan Phyl Village
Disability Class: Hearing Difficulty
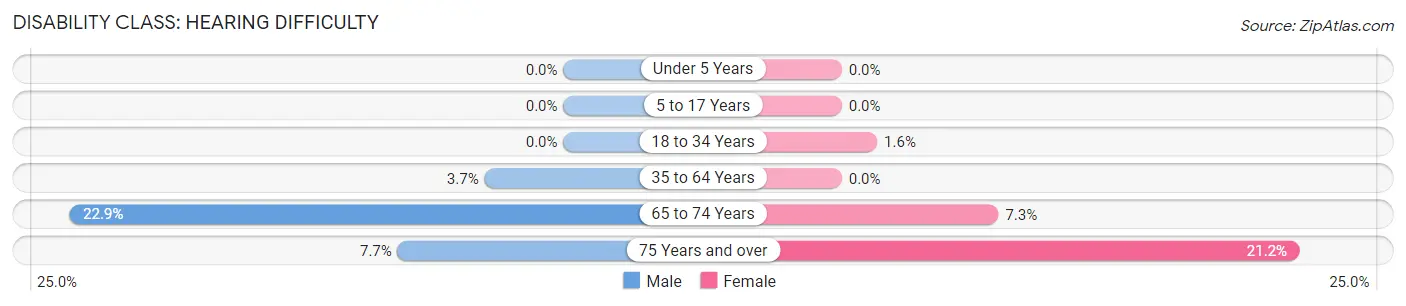
| Age Bracket | Male | Female |
| Under 5 Years | 0 (0.0%) | 0 (0.0%) |
| 5 to 17 Years | 0 (0.0%) | 0 (0.0%) |
| 18 to 34 Years | 0 (0.0%) | 14 (1.6%) |
| 35 to 64 Years | 32 (3.7%) | 0 (0.0%) |
| 65 to 74 Years | 46 (22.9%) | 29 (7.3%) |
| 75 Years and over | 14 (7.7%) | 14 (21.2%) |
Disability Class: Vision Difficulty
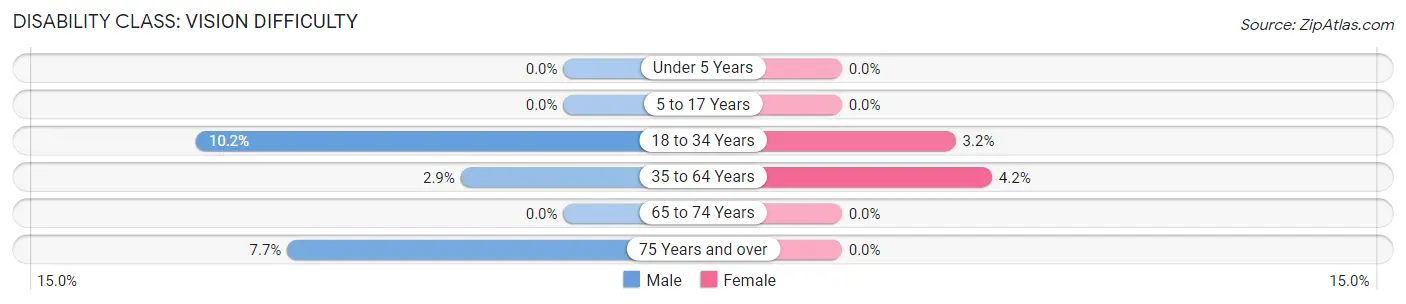
| Age Bracket | Male | Female |
| Under 5 Years | 0 (0.0%) | 0 (0.0%) |
| 5 to 17 Years | 0 (0.0%) | 0 (0.0%) |
| 18 to 34 Years | 70 (10.2%) | 27 (3.2%) |
| 35 to 64 Years | 25 (2.9%) | 59 (4.2%) |
| 65 to 74 Years | 0 (0.0%) | 0 (0.0%) |
| 75 Years and over | 14 (7.7%) | 0 (0.0%) |
Disability Class: Cognitive Difficulty
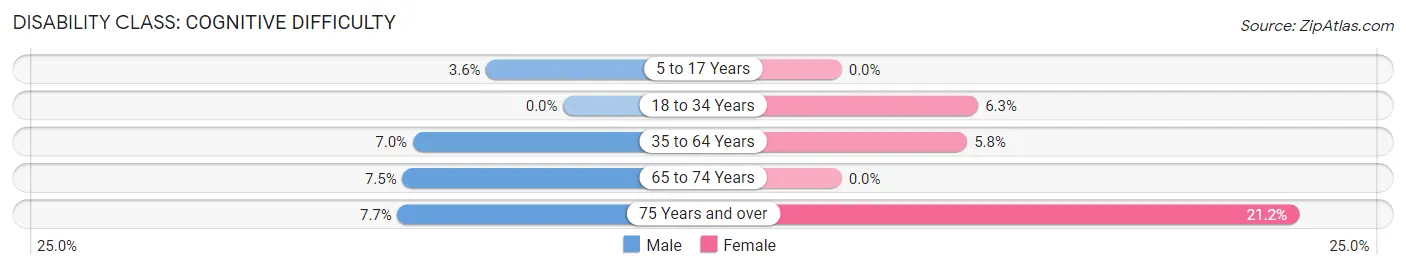
| Age Bracket | Male | Female |
| 5 to 17 Years | 23 (3.6%) | 0 (0.0%) |
| 18 to 34 Years | 0 (0.0%) | 54 (6.3%) |
| 35 to 64 Years | 61 (7.0%) | 82 (5.8%) |
| 65 to 74 Years | 15 (7.5%) | 0 (0.0%) |
| 75 Years and over | 14 (7.7%) | 14 (21.2%) |
Disability Class: Ambulatory Difficulty
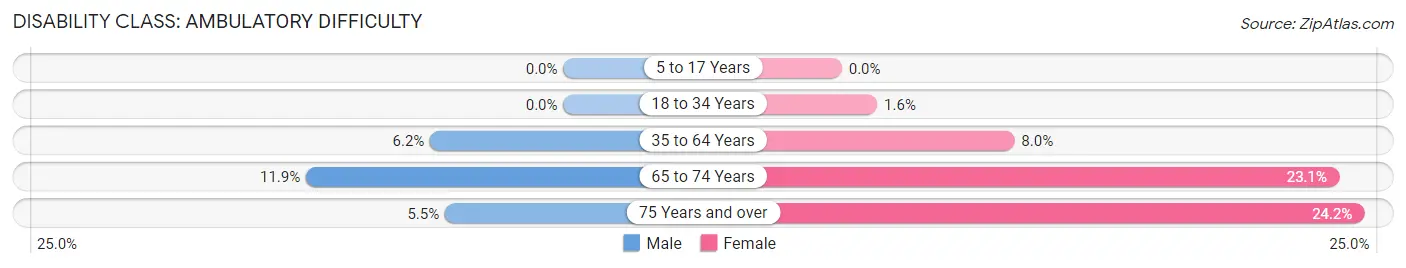
| Age Bracket | Male | Female |
| 5 to 17 Years | 0 (0.0%) | 0 (0.0%) |
| 18 to 34 Years | 0 (0.0%) | 14 (1.6%) |
| 35 to 64 Years | 54 (6.2%) | 113 (8.0%) |
| 65 to 74 Years | 24 (11.9%) | 92 (23.1%) |
| 75 Years and over | 10 (5.5%) | 16 (24.2%) |
Disability Class: Self-Care Difficulty
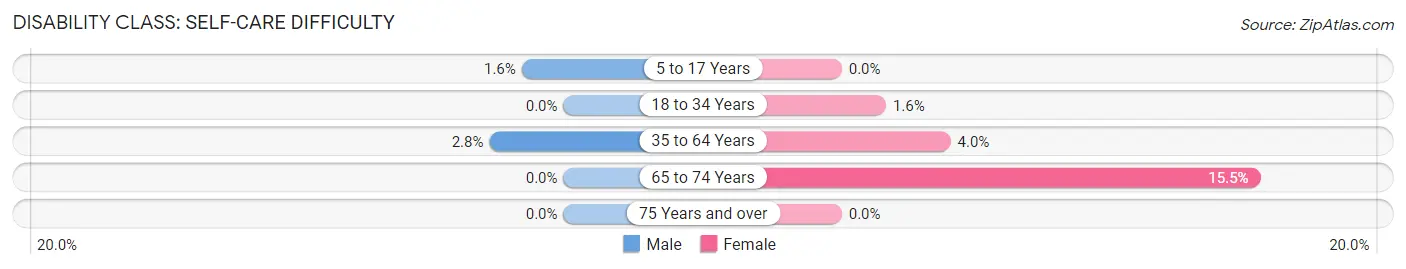
| Age Bracket | Male | Female |
| 5 to 17 Years | 10 (1.5%) | 0 (0.0%) |
| 18 to 34 Years | 0 (0.0%) | 14 (1.6%) |
| 35 to 64 Years | 24 (2.8%) | 57 (4.0%) |
| 65 to 74 Years | 0 (0.0%) | 62 (15.5%) |
| 75 Years and over | 0 (0.0%) | 0 (0.0%) |
Technology Access in Jan Phyl Village
Computing Device Access in Jan Phyl Village
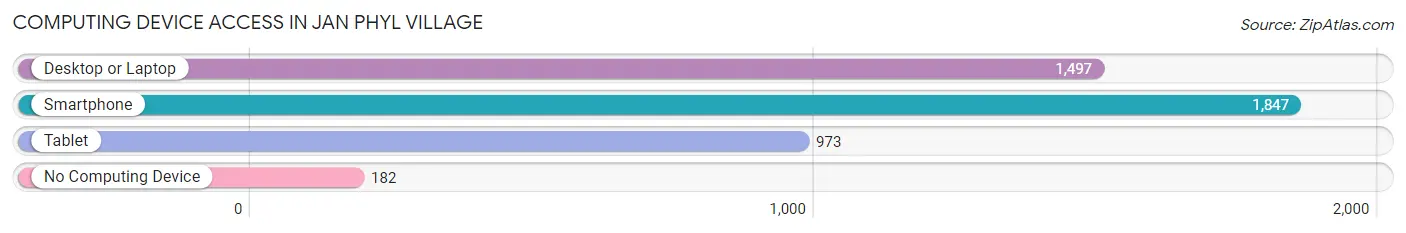
| Device Type | # Households | % Households |
| Desktop or Laptop | 1,497 | 68.1% |
| Smartphone | 1,847 | 84.0% |
| Tablet | 973 | 44.3% |
| No Computing Device | 182 | 8.3% |
| Total | 2,199 | 100.0% |
Internet Access in Jan Phyl Village
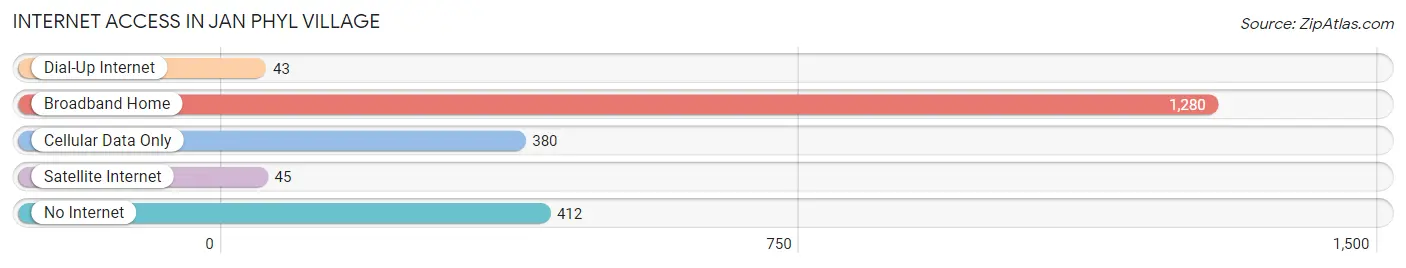
| Internet Type | # Households | % Households |
| Dial-Up Internet | 43 | 2.0% |
| Broadband Home | 1,280 | 58.2% |
| Cellular Data Only | 380 | 17.3% |
| Satellite Internet | 45 | 2.1% |
| No Internet | 412 | 18.7% |
| Total | 2,199 | 100.0% |
Jan Phyl Village Summary
Jan Phyl Village is a small town located in Polk County, Florida. It is situated on the eastern edge of the county, just south of Lakeland. The population of Jan Phyl Village was estimated to be 2,845 in 2019.
History
Jan Phyl Village was founded in the late 1800s by a group of settlers from the Netherlands. The town was named after Jan Phyl, a Dutch settler who was the first to settle in the area. The town was originally a farming community, and the settlers grew crops such as oranges, tomatoes, and corn.
In the early 1900s, the town began to grow and develop. The first post office was established in 1906, and the first school was built in 1908. The town also had a general store, a blacksmith shop, and a few other businesses.
In the 1920s, the town began to experience a population boom. This was due to the influx of people from other parts of the country who were looking for work in the area. The population of Jan Phyl Village grew to over 1,000 by the 1930s.
In the 1950s, the town began to experience a decline in population. This was due to the decline of the agricultural industry in the area. Many of the residents moved away in search of better job opportunities.
Geography
Jan Phyl Village is located in the central part of Polk County, Florida. It is situated on the eastern edge of the county, just south of Lakeland. The town is bordered by the cities of Winter Haven and Auburndale to the north, and by the cities of Haines City and Davenport to the south.
The town is located in a flat, low-lying area. The terrain is mostly flat, with some rolling hills. The town is located near several lakes, including Lake Parker, Lake Alfred, and Lake Hamilton.
Economy
The economy of Jan Phyl Village is largely based on agriculture. The town is home to several farms, which produce a variety of crops, including oranges, tomatoes, and corn. The town also has several small businesses, including restaurants, retail stores, and auto repair shops.
The town is also home to several manufacturing companies, including a furniture manufacturer and a plastics manufacturer. The town is also home to a number of service-based businesses, such as accounting firms, law firms, and real estate agencies.
Demographics
As of 2019, the population of Jan Phyl Village was estimated to be 2,845. The town has a population that is largely white (90.3%), with a small percentage of African Americans (4.2%), Hispanics (2.7%), and Asians (1.7%). The median household income in the town is $45,845, and the median home value is $150,000.
The town has a high rate of homeownership, with over 70% of the population owning their own homes. The town also has a high rate of educational attainment, with over 90% of the population having at least a high school diploma.
Conclusion
Jan Phyl Village is a small town located in Polk County, Florida. It is situated on the eastern edge of the county, just south of Lakeland. The town was founded in the late 1800s by a group of settlers from the Netherlands, and it has since grown to a population of 2,845. The town has a largely white population, and the economy is largely based on agriculture. The town also has several small businesses, manufacturing companies, and service-based businesses. The town has a high rate of homeownership and educational attainment.
Common Questions
What is Per Capita Income in Jan Phyl Village?
Per Capita income in Jan Phyl Village is $27,007.
What is the Median Family Income in Jan Phyl Village?
Median Family Income in Jan Phyl Village is $69,858.
What is the Median Household income in Jan Phyl Village?
Median Household Income in Jan Phyl Village is $63,023.
What is Income or Wage Gap in Jan Phyl Village?
Income or Wage Gap in Jan Phyl Village is 11.6%.
Women in Jan Phyl Village earn 88.4 cents for every dollar earned by a man.
What is Inequality or Gini Index in Jan Phyl Village?
Inequality or Gini Index in Jan Phyl Village is 0.44.
What is the Total Population of Jan Phyl Village?
Total Population of Jan Phyl Village is 6,237.
What is the Total Male Population of Jan Phyl Village?
Total Male Population of Jan Phyl Village is 2,844.
What is the Total Female Population of Jan Phyl Village?
Total Female Population of Jan Phyl Village is 3,393.
What is the Ratio of Males per 100 Females in Jan Phyl Village?
There are 83.82 Males per 100 Females in Jan Phyl Village.
What is the Ratio of Females per 100 Males in Jan Phyl Village?
There are 119.30 Females per 100 Males in Jan Phyl Village.
What is the Median Population Age in Jan Phyl Village?
Median Population Age in Jan Phyl Village is 36.0 Years.
What is the Average Family Size in Jan Phyl Village
Average Family Size in Jan Phyl Village is 3.5 People.
What is the Average Household Size in Jan Phyl Village
Average Household Size in Jan Phyl Village is 2.8 People.
How Large is the Labor Force in Jan Phyl Village?
There are 2,937 People in the Labor Forcein in Jan Phyl Village.
What is the Percentage of People in the Labor Force in Jan Phyl Village?
59.9% of People are in the Labor Force in Jan Phyl Village.
What is the Unemployment Rate in Jan Phyl Village?
Unemployment Rate in Jan Phyl Village is 3.7%.