San Antonio, FL Map & Demographics
San Antonio Map
San Antonio Overview
$41,363
PER CAPITA INCOME
$101,250
AVG FAMILY INCOME
$87,750
AVG HOUSEHOLD INCOME
10.8%
WAGE / INCOME GAP [ % ]
89.2¢/ $1
WAGE / INCOME GAP [ $ ]
0.38
INEQUALITY / GINI INDEX
1,375
TOTAL POPULATION
673
MALE POPULATION
702
FEMALE POPULATION
95.87
MALES / 100 FEMALES
104.31
FEMALES / 100 MALES
39.5
MEDIAN AGE
3.0
AVG FAMILY SIZE
2.7
AVG HOUSEHOLD SIZE
686
LABOR FORCE [ PEOPLE ]
62.8%
PERCENT IN LABOR FORCE
2.9%
UNEMPLOYMENT RATE
San Antonio Zip Codes
Income in San Antonio
Income Overview in San Antonio
Per Capita Income in San Antonio is $41,363, while median incomes of families and households are $101,250 and $87,750 respectively.
| Characteristic | Number | Measure |
| Per Capita Income | 1,375 | $41,363 |
| Median Family Income | 388 | $101,250 |
| Mean Family Income | 388 | $122,228 |
| Median Household Income | 510 | $87,750 |
| Mean Household Income | 510 | $107,934 |
| Income Deficit | 388 | $0 |
| Wage / Income Gap (%) | 1,375 | 10.81% |
| Wage / Income Gap ($) | 1,375 | 89.19¢ per $1 |
| Gini / Inequality Index | 1,375 | 0.38 |
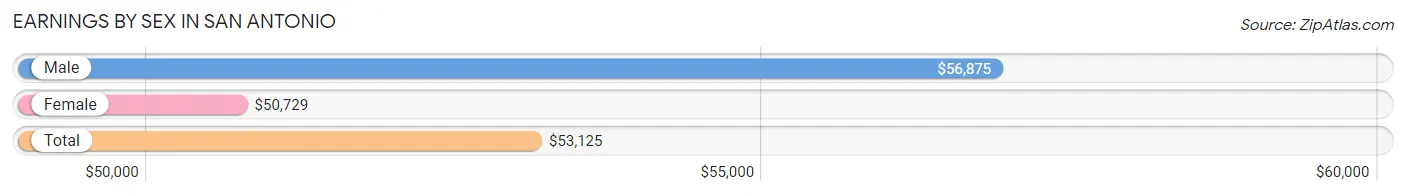
Earnings by Sex in San Antonio
Average Earnings in San Antonio are $53,125, $56,875 for men and $50,729 for women, a difference of 10.8%.
| Sex | Number | Average Earnings |
| Male | 365 (48.7%) | $56,875 |
| Female | 384 (51.3%) | $50,729 |
| Total | 749 (100.0%) | $53,125 |
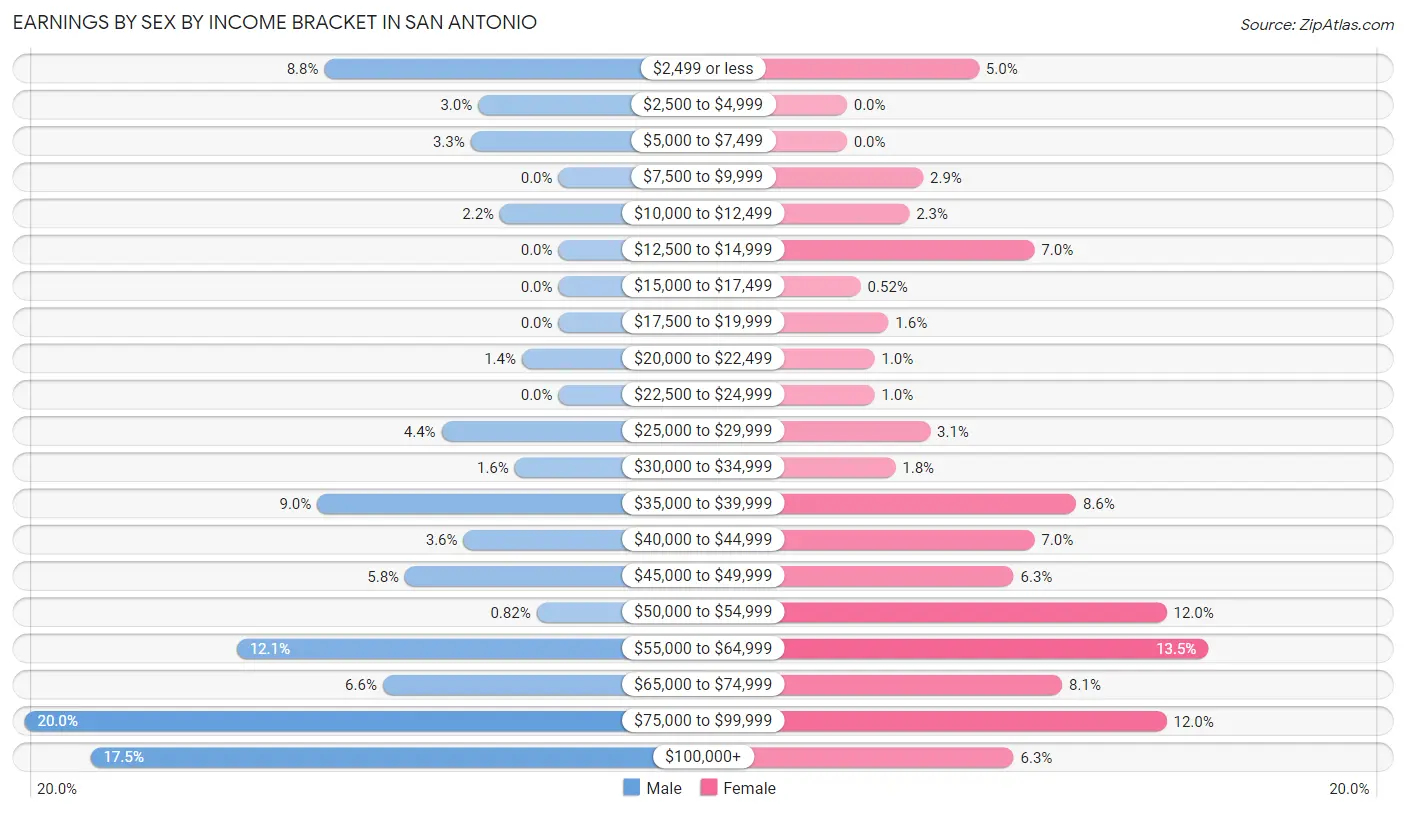
Earnings by Sex by Income Bracket in San Antonio
The most common earnings brackets in San Antonio are $75,000 to $99,999 for men (73 | 20.0%) and $55,000 to $64,999 for women (52 | 13.5%).
| Income | Male | Female |
| $2,499 or less | 32 (8.8%) | 19 (5.0%) |
| $2,500 to $4,999 | 11 (3.0%) | 0 (0.0%) |
| $5,000 to $7,499 | 12 (3.3%) | 0 (0.0%) |
| $7,500 to $9,999 | 0 (0.0%) | 11 (2.9%) |
| $10,000 to $12,499 | 8 (2.2%) | 9 (2.3%) |
| $12,500 to $14,999 | 0 (0.0%) | 27 (7.0%) |
| $15,000 to $17,499 | 0 (0.0%) | 2 (0.5%) |
| $17,500 to $19,999 | 0 (0.0%) | 6 (1.6%) |
| $20,000 to $22,499 | 5 (1.4%) | 4 (1.0%) |
| $22,500 to $24,999 | 0 (0.0%) | 4 (1.0%) |
| $25,000 to $29,999 | 16 (4.4%) | 12 (3.1%) |
| $30,000 to $34,999 | 6 (1.6%) | 7 (1.8%) |
| $35,000 to $39,999 | 33 (9.0%) | 33 (8.6%) |
| $40,000 to $44,999 | 13 (3.6%) | 27 (7.0%) |
| $45,000 to $49,999 | 21 (5.8%) | 24 (6.2%) |
| $50,000 to $54,999 | 3 (0.8%) | 46 (12.0%) |
| $55,000 to $64,999 | 44 (12.0%) | 52 (13.5%) |
| $65,000 to $74,999 | 24 (6.6%) | 31 (8.1%) |
| $75,000 to $99,999 | 73 (20.0%) | 46 (12.0%) |
| $100,000+ | 64 (17.5%) | 24 (6.2%) |
| Total | 365 (100.0%) | 384 (100.0%) |
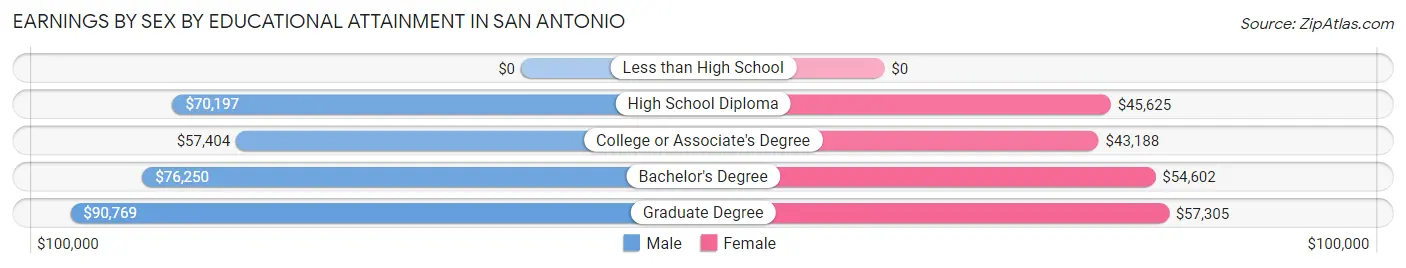
Earnings by Sex by Educational Attainment in San Antonio
Average earnings in San Antonio are $59,196 for men and $52,727 for women, a difference of 10.9%. Men with an educational attainment of graduate degree enjoy the highest average annual earnings of $90,769, while those with college or associate's degree education earn the least with $57,404. Women with an educational attainment of graduate degree earn the most with the average annual earnings of $57,305, while those with college or associate's degree education have the smallest earnings of $43,188.
| Educational Attainment | Male Income | Female Income |
| Less than High School | - | - |
| High School Diploma | $70,197 | $45,625 |
| College or Associate's Degree | $57,404 | $43,188 |
| Bachelor's Degree | $76,250 | $54,602 |
| Graduate Degree | $90,769 | $57,305 |
| Total | $59,196 | $52,727 |
Family Income in San Antonio
Family Income Brackets in San Antonio
According to the San Antonio family income data, there are 85 families falling into the $75,000 to $99,999 income range, which is the most common income bracket and makes up 21.9% of all families.
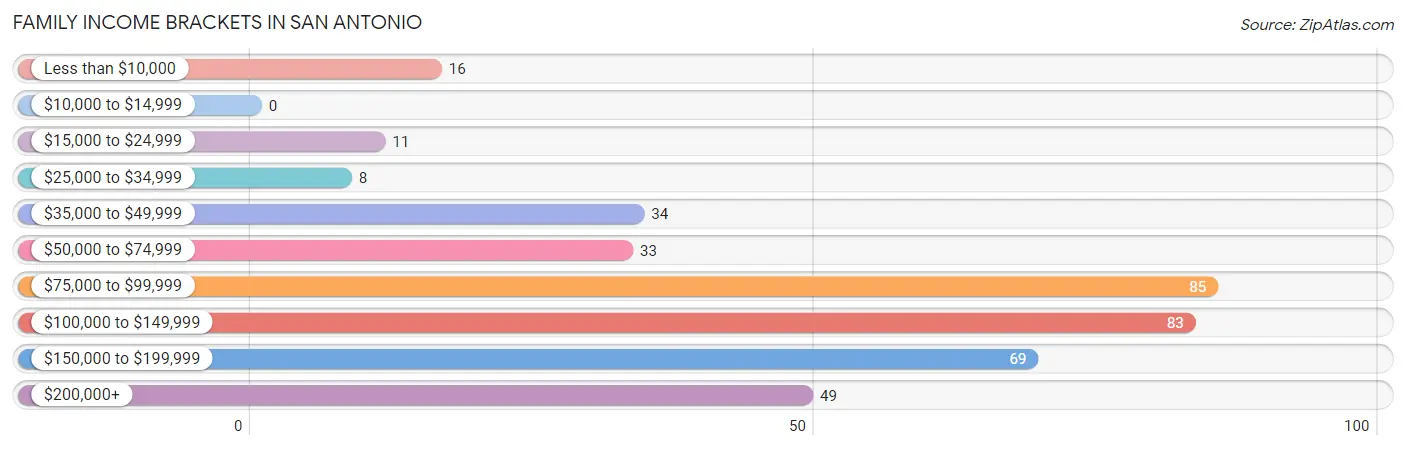
| Income Bracket | # Families | % Families |
| Less than $10,000 | 16 | 4.1% |
| $10,000 to $14,999 | 0 | 0.0% |
| $15,000 to $24,999 | 11 | 2.8% |
| $25,000 to $34,999 | 8 | 2.1% |
| $35,000 to $49,999 | 34 | 8.8% |
| $50,000 to $74,999 | 33 | 8.5% |
| $75,000 to $99,999 | 85 | 21.9% |
| $100,000 to $149,999 | 83 | 21.4% |
| $150,000 to $199,999 | 69 | 17.8% |
| $200,000+ | 49 | 12.6% |
Family Income by Famaliy Size in San Antonio
5-person families (19 | 4.9%) account for the highest median family income in San Antonio with $181,250 per family, while 2-person families (171 | 44.1%) have the highest median income of $45,347 per family member.
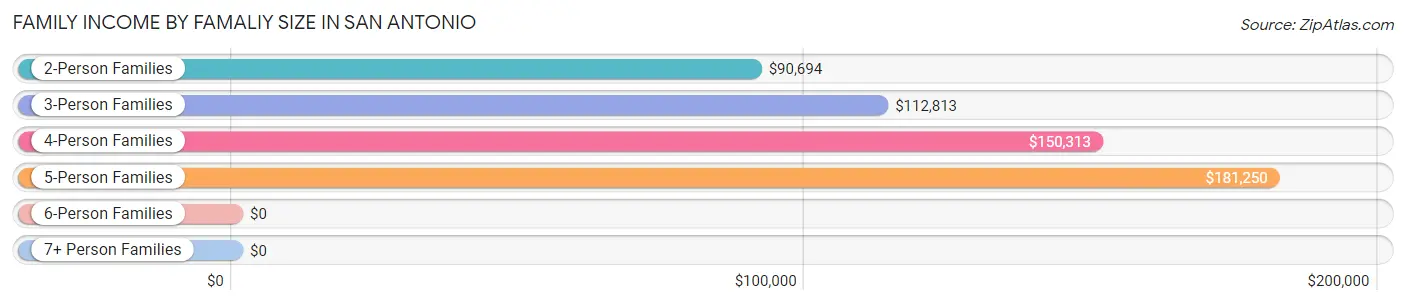
| Income Bracket | # Families | Median Income |
| 2-Person Families | 171 (44.1%) | $90,694 |
| 3-Person Families | 131 (33.8%) | $112,813 |
| 4-Person Families | 67 (17.3%) | $150,313 |
| 5-Person Families | 19 (4.9%) | $181,250 |
| 6-Person Families | 0 (0.0%) | $0 |
| 7+ Person Families | 0 (0.0%) | $0 |
| Total | 388 (100.0%) | $101,250 |
Family Income by Number of Earners in San Antonio
The median family income in San Antonio is $101,250, with families comprising 3+ earners (51) having the highest median family income of $183,194, while families with 1 earner (150) have the lowest median family income of $69,821, accounting for 13.1% and 38.7% of families, respectively.
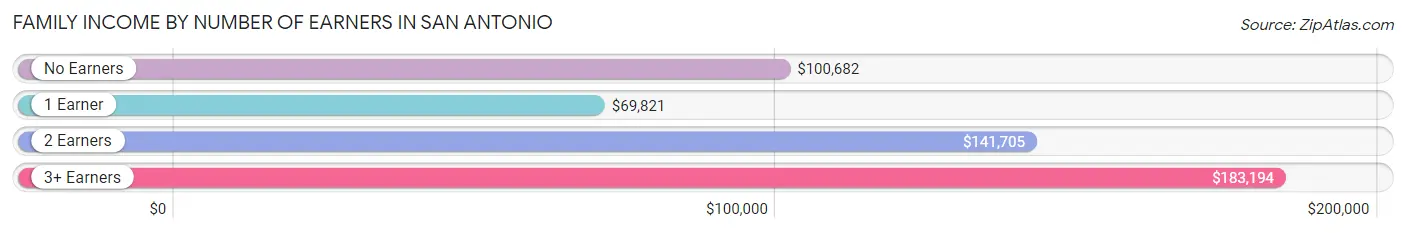
| Number of Earners | # Families | Median Income |
| No Earners | 42 (10.8%) | $100,682 |
| 1 Earner | 150 (38.7%) | $69,821 |
| 2 Earners | 145 (37.4%) | $141,705 |
| 3+ Earners | 51 (13.1%) | $183,194 |
| Total | 388 (100.0%) | $101,250 |
Household Income in San Antonio
Household Income Brackets in San Antonio
With 115 households falling in the category, the $50,000 to $74,999 income range is the most frequent in San Antonio, accounting for 22.6% of all households. In contrast, only 7 households (1.4%) fall into the $10,000 to $14,999 income bracket, making it the least populous group.
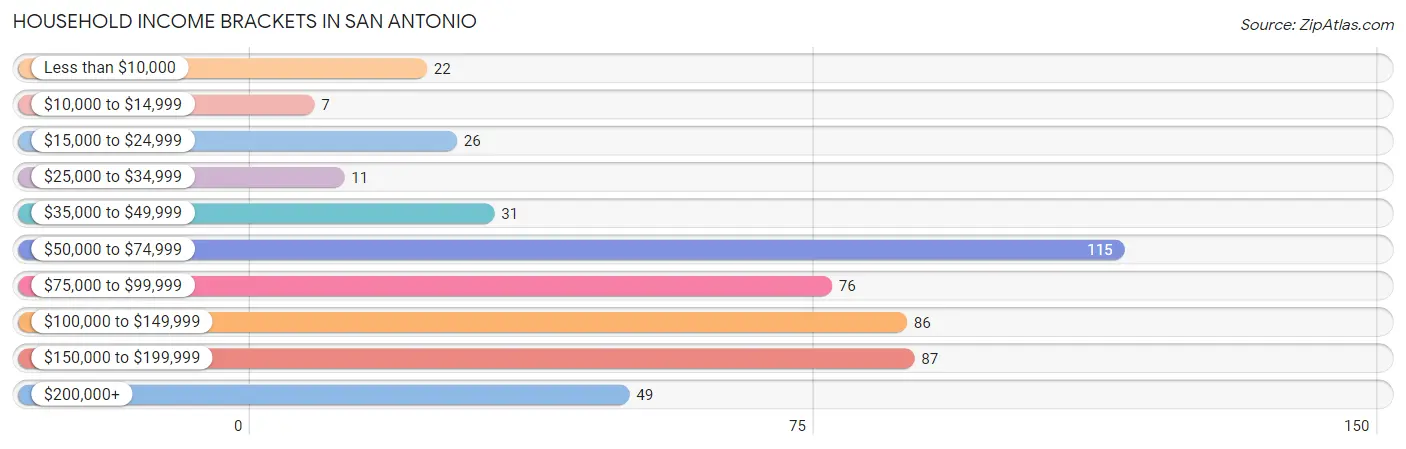
| Income Bracket | # Households | % Households |
| Less than $10,000 | 22 | 4.3% |
| $10,000 to $14,999 | 7 | 1.4% |
| $15,000 to $24,999 | 26 | 5.1% |
| $25,000 to $34,999 | 11 | 2.2% |
| $35,000 to $49,999 | 31 | 6.1% |
| $50,000 to $74,999 | 115 | 22.5% |
| $75,000 to $99,999 | 76 | 14.9% |
| $100,000 to $149,999 | 86 | 16.9% |
| $150,000 to $199,999 | 87 | 17.1% |
| $200,000+ | 49 | 9.6% |
Household Income by Householder Age in San Antonio
The median household income in San Antonio is $87,750, with the highest median household income of $130,938 found in the 25 to 44 years age bracket for the primary householder. A total of 143 households (28.0%) fall into this category. Meanwhile, the 15 to 24 years age bracket for the primary householder has the lowest median household income of $0, with 7 households (1.4%) in this group.
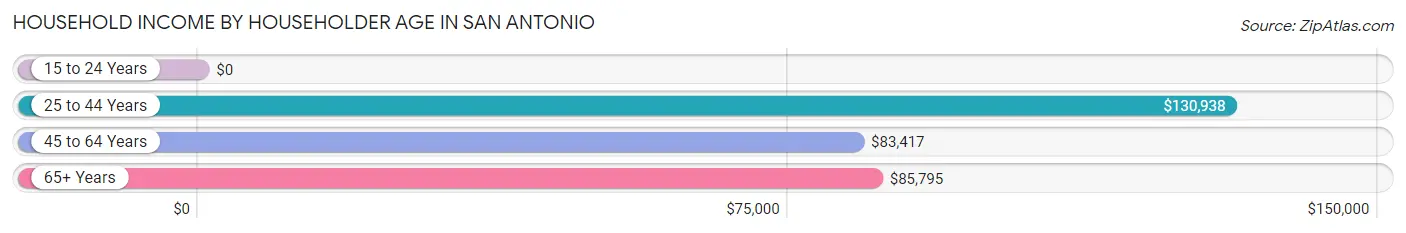
| Income Bracket | # Households | Median Income |
| 15 to 24 Years | 7 (1.4%) | $0 |
| 25 to 44 Years | 143 (28.0%) | $130,938 |
| 45 to 64 Years | 249 (48.8%) | $83,417 |
| 65+ Years | 111 (21.8%) | $85,795 |
| Total | 510 (100.0%) | $87,750 |
Poverty in San Antonio
Income Below Poverty by Sex and Age in San Antonio
With 7.5% poverty level for males and 6.7% for females among the residents of San Antonio, 12 to 14 year old males and 25 to 34 year old females are the most vulnerable to poverty, with 6 males (25.0%) and 12 females (11.0%) in their respective age groups living below the poverty level.
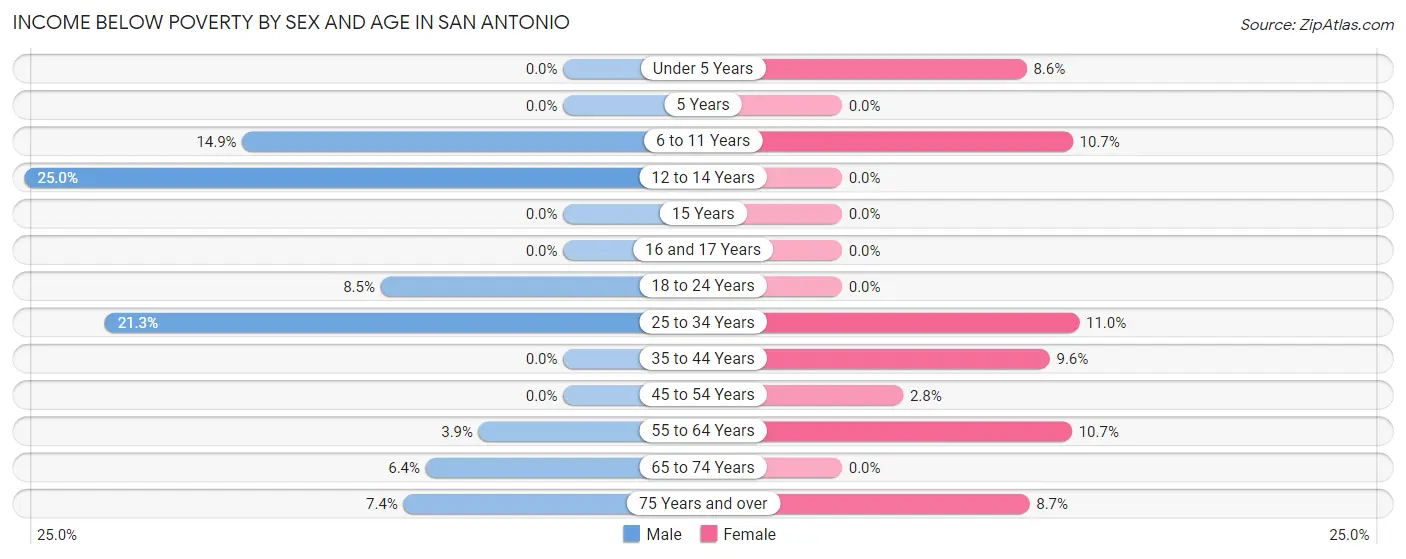
| Age Bracket | Male | Female |
| Under 5 Years | 0 (0.0%) | 3 (8.6%) |
| 5 Years | 0 (0.0%) | 0 (0.0%) |
| 6 to 11 Years | 7 (14.9%) | 6 (10.7%) |
| 12 to 14 Years | 6 (25.0%) | 0 (0.0%) |
| 15 Years | 0 (0.0%) | 0 (0.0%) |
| 16 and 17 Years | 0 (0.0%) | 0 (0.0%) |
| 18 to 24 Years | 5 (8.5%) | 0 (0.0%) |
| 25 to 34 Years | 20 (21.3%) | 12 (11.0%) |
| 35 to 44 Years | 0 (0.0%) | 8 (9.6%) |
| 45 to 54 Years | 0 (0.0%) | 4 (2.8%) |
| 55 to 64 Years | 4 (3.9%) | 8 (10.7%) |
| 65 to 74 Years | 3 (6.4%) | 0 (0.0%) |
| 75 Years and over | 4 (7.4%) | 4 (8.7%) |
| Total | 49 (7.5%) | 45 (6.7%) |
Income Above Poverty by Sex and Age in San Antonio
According to the poverty statistics in San Antonio, males aged under 5 years and females aged 5 years are the age groups that are most secure financially, with 100.0% of males and 100.0% of females in these age groups living above the poverty line.
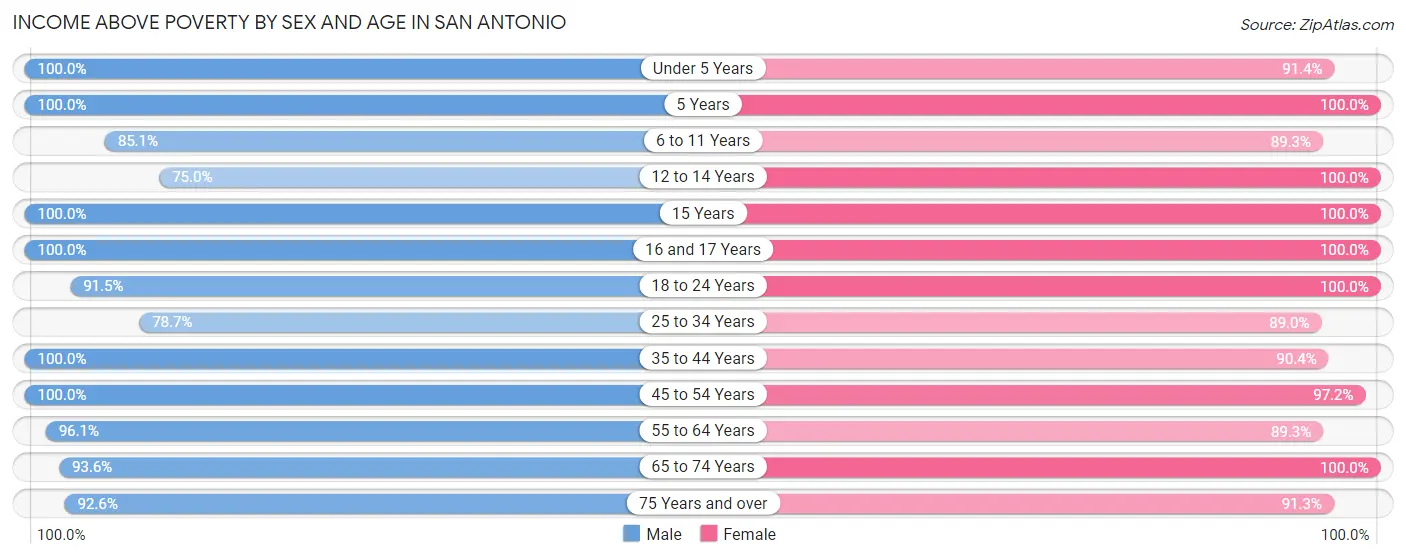
| Age Bracket | Male | Female |
| Under 5 Years | 30 (100.0%) | 32 (91.4%) |
| 5 Years | 4 (100.0%) | 3 (100.0%) |
| 6 to 11 Years | 40 (85.1%) | 50 (89.3%) |
| 12 to 14 Years | 18 (75.0%) | 15 (100.0%) |
| 15 Years | 15 (100.0%) | 4 (100.0%) |
| 16 and 17 Years | 35 (100.0%) | 11 (100.0%) |
| 18 to 24 Years | 54 (91.5%) | 49 (100.0%) |
| 25 to 34 Years | 74 (78.7%) | 97 (89.0%) |
| 35 to 44 Years | 46 (100.0%) | 75 (90.4%) |
| 45 to 54 Years | 97 (100.0%) | 137 (97.2%) |
| 55 to 64 Years | 98 (96.1%) | 67 (89.3%) |
| 65 to 74 Years | 44 (93.6%) | 45 (100.0%) |
| 75 Years and over | 50 (92.6%) | 42 (91.3%) |
| Total | 605 (92.5%) | 627 (93.3%) |
Income Below Poverty Among Married-Couple Families in San Antonio
The poverty statistics for married-couple families in San Antonio show that 2.1% or 6 of the total 290 families live below the poverty line. Families with no children have the highest poverty rate of 3.4%, comprising of 6 families. On the other hand, families with 1 or 2 children have the lowest poverty rate of 0.0%, which includes 0 families.
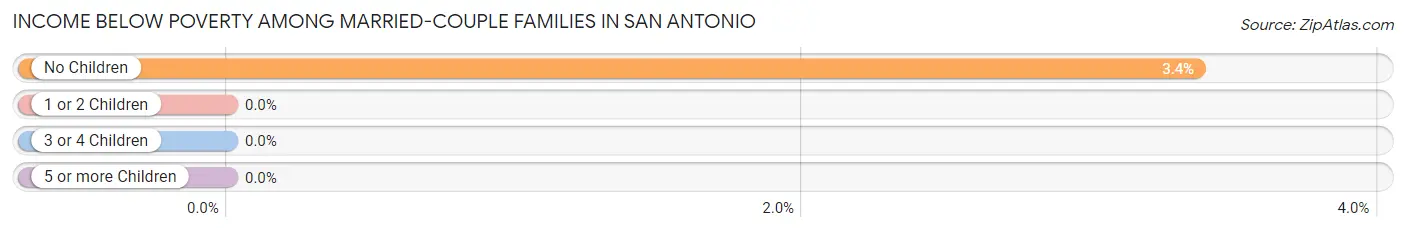
| Children | Above Poverty | Below Poverty |
| No Children | 172 (96.6%) | 6 (3.4%) |
| 1 or 2 Children | 99 (100.0%) | 0 (0.0%) |
| 3 or 4 Children | 13 (100.0%) | 0 (0.0%) |
| 5 or more Children | 0 (0.0%) | 0 (0.0%) |
| Total | 284 (97.9%) | 6 (2.1%) |
Income Below Poverty Among Single-Parent Households in San Antonio
According to the poverty data in San Antonio, 30.4% or 7 single-father households and 8.0% or 6 single-mother households are living below the poverty line. Among single-father households, those with 3 or 4 children have the highest poverty rate, with 4 households (100.0%) experiencing poverty. Likewise, among single-mother households, those with 1 or 2 children have the highest poverty rate, with 3 households (9.1%) falling below the poverty line.
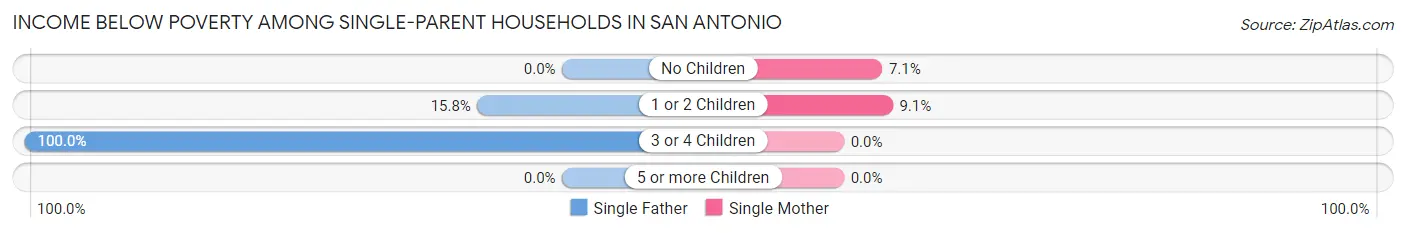
| Children | Single Father | Single Mother |
| No Children | 0 (0.0%) | 3 (7.1%) |
| 1 or 2 Children | 3 (15.8%) | 3 (9.1%) |
| 3 or 4 Children | 4 (100.0%) | 0 (0.0%) |
| 5 or more Children | 0 (0.0%) | 0 (0.0%) |
| Total | 7 (30.4%) | 6 (8.0%) |
Income Below Poverty Among Married-Couple vs Single-Parent Households in San Antonio
The poverty data for San Antonio shows that 6 of the married-couple family households (2.1%) and 13 of the single-parent households (13.3%) are living below the poverty level. Within the married-couple family households, those with no children have the highest poverty rate, with 6 households (3.4%) falling below the poverty line. Among the single-parent households, those with 3 or 4 children have the highest poverty rate, with 4 household (100.0%) living below poverty.
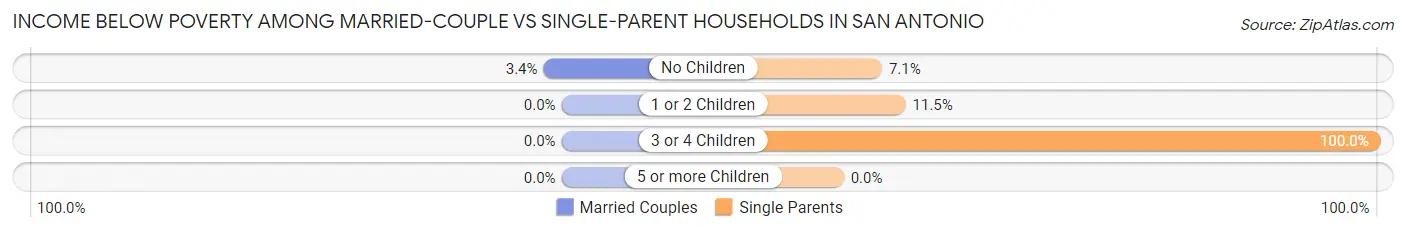
| Children | Married-Couple Families | Single-Parent Households |
| No Children | 6 (3.4%) | 3 (7.1%) |
| 1 or 2 Children | 0 (0.0%) | 6 (11.5%) |
| 3 or 4 Children | 0 (0.0%) | 4 (100.0%) |
| 5 or more Children | 0 (0.0%) | 0 (0.0%) |
| Total | 6 (2.1%) | 13 (13.3%) |
Race in San Antonio
The most populous races in San Antonio are White / Caucasian (1,271 | 92.4%), Hispanic or Latino (104 | 7.6%), and Black / African American (54 | 3.9%).
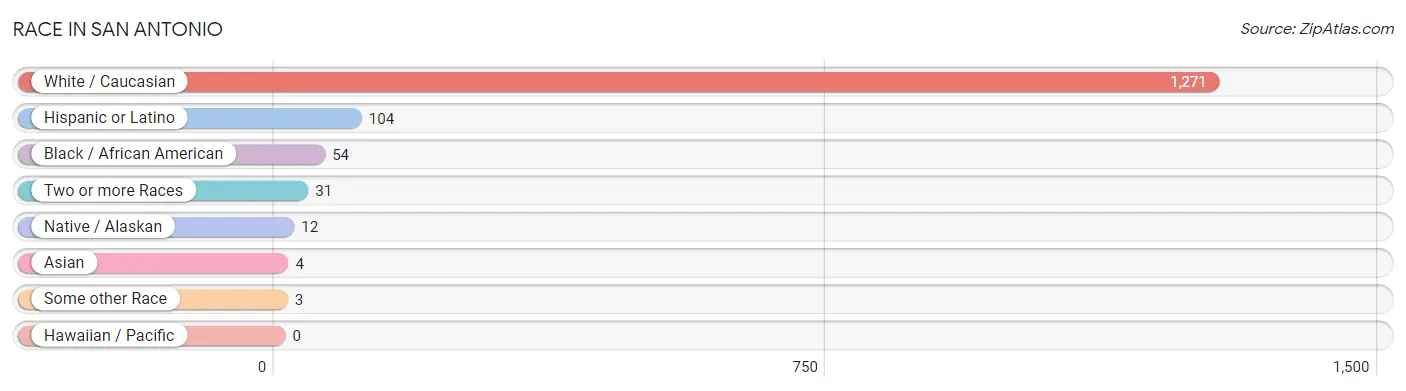
| Race | # Population | % Population |
| Asian | 4 | 0.3% |
| Black / African American | 54 | 3.9% |
| Hawaiian / Pacific | 0 | 0.0% |
| Hispanic or Latino | 104 | 7.6% |
| Native / Alaskan | 12 | 0.9% |
| White / Caucasian | 1,271 | 92.4% |
| Two or more Races | 31 | 2.2% |
| Some other Race | 3 | 0.2% |
| Total | 1,375 | 100.0% |
Ancestry in San Antonio
The most populous ancestries reported in San Antonio are English (268 | 19.5%), German (251 | 18.2%), Irish (162 | 11.8%), American (126 | 9.2%), and Italian (81 | 5.9%), together accounting for 64.6% of all San Antonio residents.
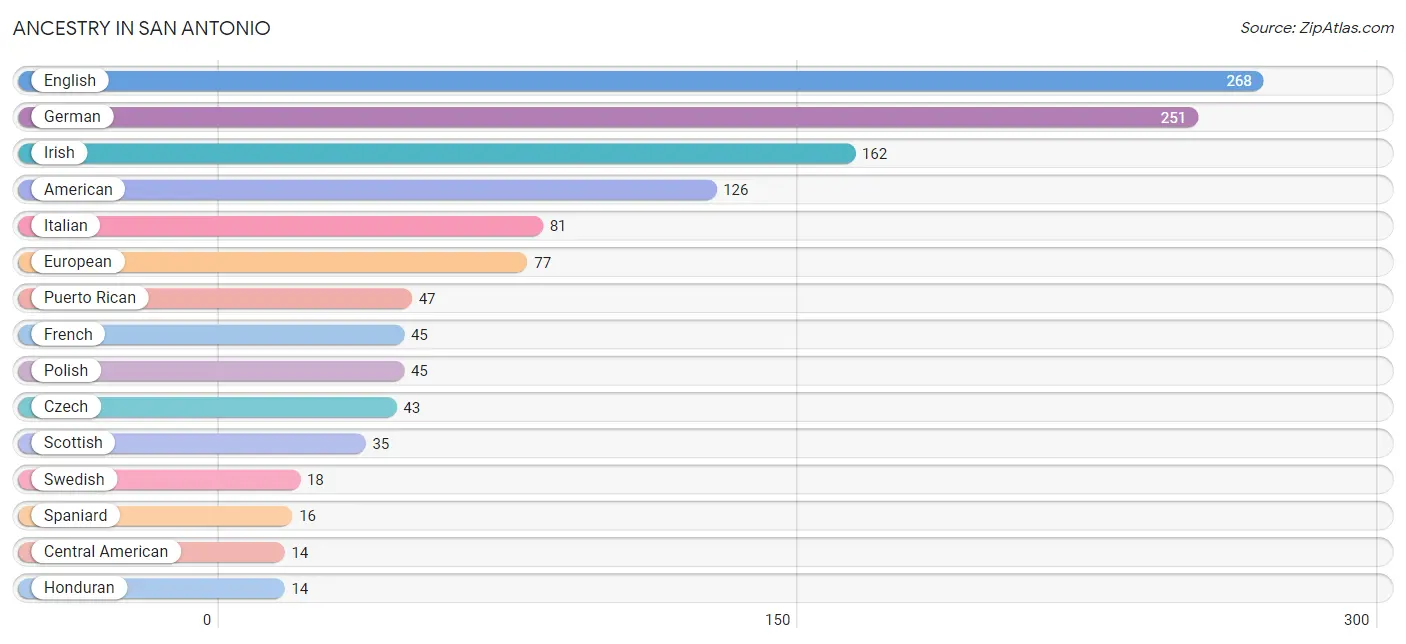
| Ancestry | # Population | % Population |
| American | 126 | 9.2% |
| Apache | 11 | 0.8% |
| Austrian | 3 | 0.2% |
| Brazilian | 2 | 0.2% |
| British | 10 | 0.7% |
| Central American | 14 | 1.0% |
| Cherokee | 2 | 0.2% |
| Chilean | 6 | 0.4% |
| Chippewa | 11 | 0.8% |
| Colombian | 4 | 0.3% |
| Croatian | 5 | 0.4% |
| Cuban | 7 | 0.5% |
| Czech | 43 | 3.1% |
| Dutch | 12 | 0.9% |
| English | 268 | 19.5% |
| European | 77 | 5.6% |
| French | 45 | 3.3% |
| French Canadian | 2 | 0.2% |
| German | 251 | 18.2% |
| Honduran | 14 | 1.0% |
| Hungarian | 3 | 0.2% |
| Irish | 162 | 11.8% |
| Italian | 81 | 5.9% |
| Korean | 9 | 0.6% |
| Lithuanian | 1 | 0.1% |
| Luxembourger | 3 | 0.2% |
| Mexican | 10 | 0.7% |
| Navajo | 13 | 0.9% |
| Norwegian | 3 | 0.2% |
| Polish | 45 | 3.3% |
| Puerto Rican | 47 | 3.4% |
| Scandinavian | 4 | 0.3% |
| Scottish | 35 | 2.5% |
| South American | 10 | 0.7% |
| Spaniard | 16 | 1.2% |
| Swedish | 18 | 1.3% |
| Swiss | 10 | 0.7% |
| Welsh | 8 | 0.6% | View All 38 Rows |
Immigrants in San Antonio
The most numerous immigrant groups reported in San Antonio came from Latin America (22 | 1.6%), Central America (17 | 1.2%), Honduras (14 | 1.0%), Europe (10 | 0.7%), and Northern Europe (8 | 0.6%), together accounting for 5.2% of all San Antonio residents.
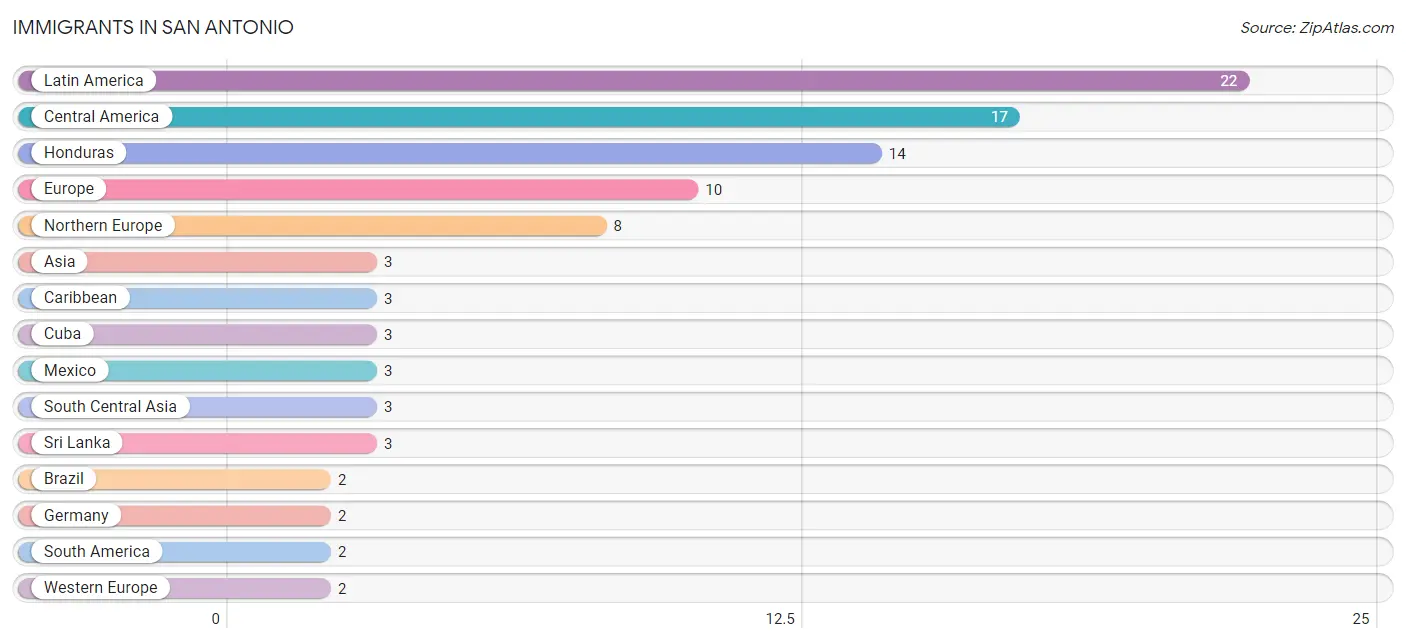
| Immigration Origin | # Population | % Population |
| Asia | 3 | 0.2% |
| Brazil | 2 | 0.2% |
| Caribbean | 3 | 0.2% |
| Central America | 17 | 1.2% |
| Cuba | 3 | 0.2% |
| Europe | 10 | 0.7% |
| Germany | 2 | 0.2% |
| Honduras | 14 | 1.0% |
| Latin America | 22 | 1.6% |
| Mexico | 3 | 0.2% |
| Northern Europe | 8 | 0.6% |
| South America | 2 | 0.2% |
| South Central Asia | 3 | 0.2% |
| Sri Lanka | 3 | 0.2% |
| Western Europe | 2 | 0.2% | View All 15 Rows |
Sex and Age in San Antonio
Sex and Age in San Antonio
The most populous age groups in San Antonio are 30 to 34 Years (70 | 10.4%) for men and 50 to 54 Years (76 | 10.8%) for women.
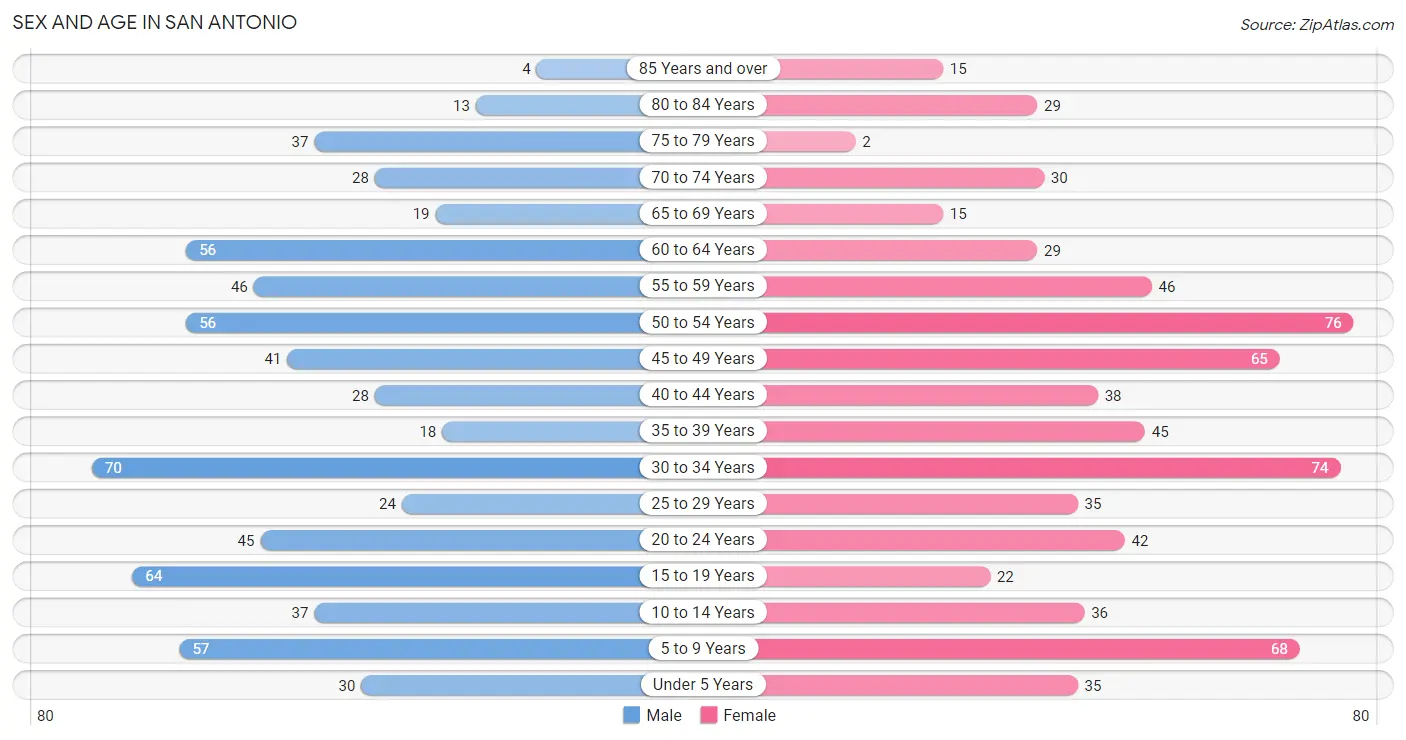
| Age Bracket | Male | Female |
| Under 5 Years | 30 (4.5%) | 35 (5.0%) |
| 5 to 9 Years | 57 (8.5%) | 68 (9.7%) |
| 10 to 14 Years | 37 (5.5%) | 36 (5.1%) |
| 15 to 19 Years | 64 (9.5%) | 22 (3.1%) |
| 20 to 24 Years | 45 (6.7%) | 42 (6.0%) |
| 25 to 29 Years | 24 (3.6%) | 35 (5.0%) |
| 30 to 34 Years | 70 (10.4%) | 74 (10.5%) |
| 35 to 39 Years | 18 (2.7%) | 45 (6.4%) |
| 40 to 44 Years | 28 (4.2%) | 38 (5.4%) |
| 45 to 49 Years | 41 (6.1%) | 65 (9.3%) |
| 50 to 54 Years | 56 (8.3%) | 76 (10.8%) |
| 55 to 59 Years | 46 (6.8%) | 46 (6.6%) |
| 60 to 64 Years | 56 (8.3%) | 29 (4.1%) |
| 65 to 69 Years | 19 (2.8%) | 15 (2.1%) |
| 70 to 74 Years | 28 (4.2%) | 30 (4.3%) |
| 75 to 79 Years | 37 (5.5%) | 2 (0.3%) |
| 80 to 84 Years | 13 (1.9%) | 29 (4.1%) |
| 85 Years and over | 4 (0.6%) | 15 (2.1%) |
| Total | 673 (100.0%) | 702 (100.0%) |
Families and Households in San Antonio
Median Family Size in San Antonio
The median family size in San Antonio is 2.97 persons per family, with single female/mother families (75 | 19.3%) accounting for the largest median family size of 3.05 persons per family. On the other hand, single male/father families (23 | 5.9%) represent the smallest median family size with 2.78 persons per family.
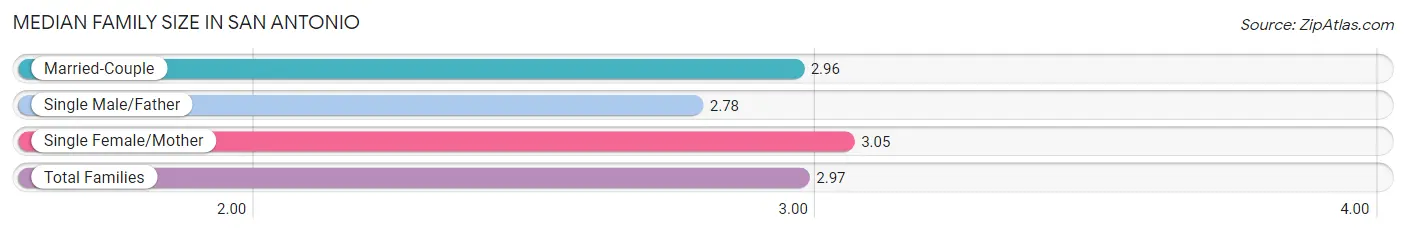
| Family Type | # Families | Family Size |
| Married-Couple | 290 (74.7%) | 2.96 |
| Single Male/Father | 23 (5.9%) | 2.78 |
| Single Female/Mother | 75 (19.3%) | 3.05 |
| Total Families | 388 (100.0%) | 2.97 |
Median Household Size in San Antonio
The median household size in San Antonio is 2.69 persons per household, with single male/father households (23 | 4.5%) accounting for the largest median household size of 5.43 persons per household. non-family households (122 | 23.9%) represent the smallest median household size with 1.17 persons per household.
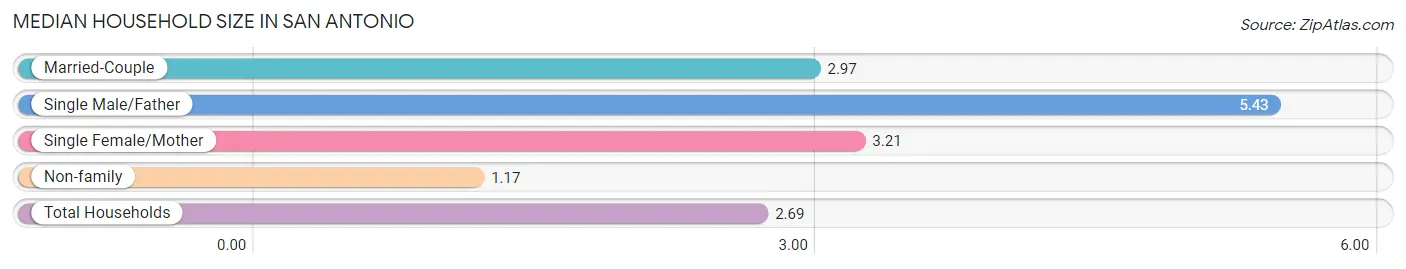
| Household Type | # Households | Household Size |
| Married-Couple | 290 (56.9%) | 2.97 |
| Single Male/Father | 23 (4.5%) | 5.43 |
| Single Female/Mother | 75 (14.7%) | 3.21 |
| Non-family | 122 (23.9%) | 1.17 |
| Total Households | 510 (100.0%) | 2.69 |
Household Size by Marriage Status in San Antonio
Out of a total of 510 households in San Antonio, 388 (76.1%) are family households, while 122 (23.9%) are nonfamily households. The most numerous type of family households are 2-person households, comprising 159, and the most common type of nonfamily households are 1-person households, comprising 112.
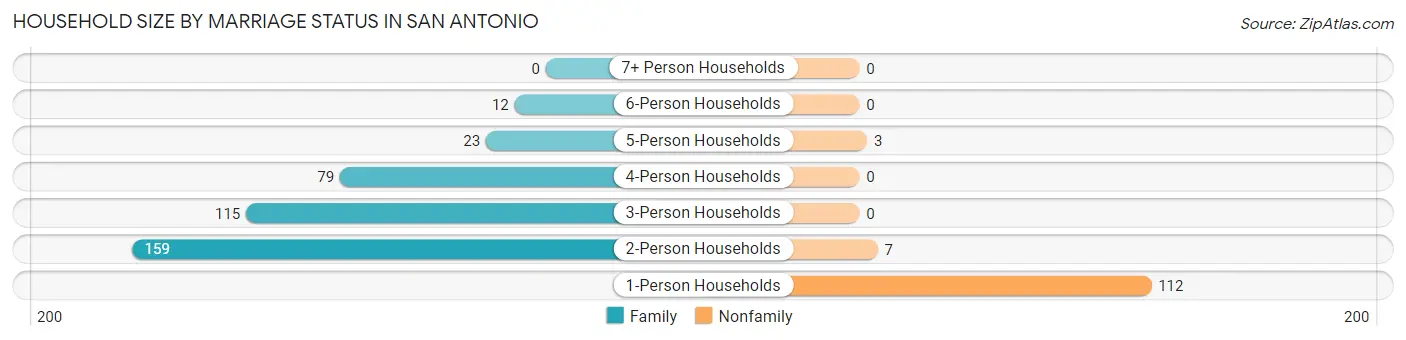
| Household Size | Family Households | Nonfamily Households |
| 1-Person Households | - | 112 (22.0%) |
| 2-Person Households | 159 (31.2%) | 7 (1.4%) |
| 3-Person Households | 115 (22.6%) | 0 (0.0%) |
| 4-Person Households | 79 (15.5%) | 0 (0.0%) |
| 5-Person Households | 23 (4.5%) | 3 (0.6%) |
| 6-Person Households | 12 (2.4%) | 0 (0.0%) |
| 7+ Person Households | 0 (0.0%) | 0 (0.0%) |
| Total | 388 (76.1%) | 122 (23.9%) |
Female Fertility in San Antonio
Fertility by Age in San Antonio
Average fertility rate in San Antonio is 53.0 births per 1,000 women. Women in the age bracket of 20 to 34 years have the highest fertility rate with 113.0 births per 1,000 women. Women in the age bracket of 20 to 34 years acount for 100.0% of all women with births.
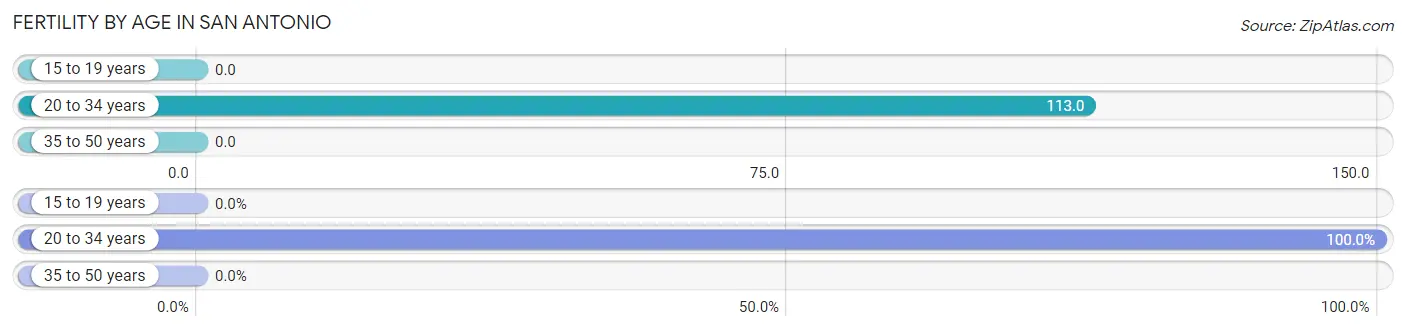
| Age Bracket | Women with Births | Births / 1,000 Women |
| 15 to 19 years | 0 (0.0%) | 0.0 |
| 20 to 34 years | 17 (100.0%) | 113.0 |
| 35 to 50 years | 0 (0.0%) | 0.0 |
| Total | 17 (100.0%) | 53.0 |
Fertility by Age by Marriage Status in San Antonio
58.8% of women with births (17) in San Antonio are married. The highest percentage of unmarried women with births falls into 20 to 34 years age bracket with 41.2% of them unmarried at the time of birth, while the lowest percentage of unmarried women with births belong to 20 to 34 years age bracket with 41.2% of them unmarried.
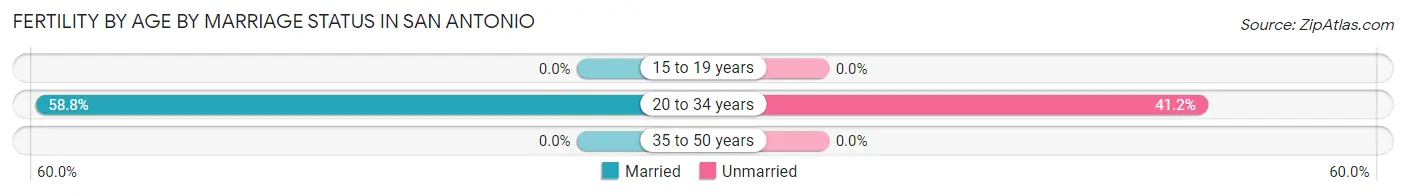
| Age Bracket | Married | Unmarried |
| 15 to 19 years | 0 (0.0%) | 0 (0.0%) |
| 20 to 34 years | 10 (58.8%) | 7 (41.2%) |
| 35 to 50 years | 0 (0.0%) | 0 (0.0%) |
| Total | 10 (58.8%) | 7 (41.2%) |
Fertility by Education in San Antonio
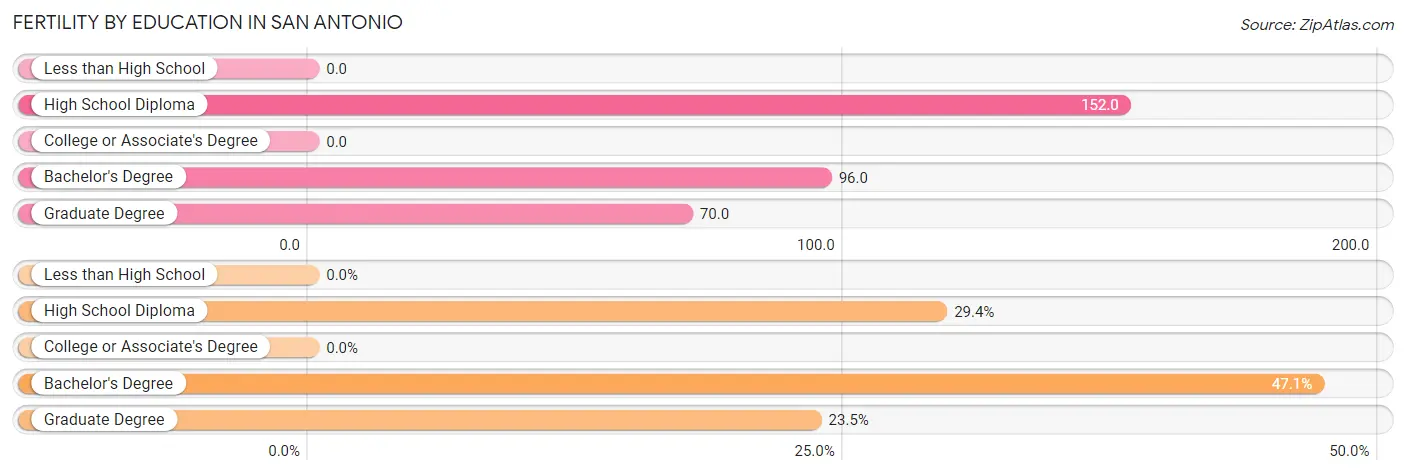
| Educational Attainment | Women with Births | Births / 1,000 Women |
| Less than High School | 0 (0.0%) | 0.0 |
| High School Diploma | 5 (29.4%) | 152.0 |
| College or Associate's Degree | 0 (0.0%) | 0.0 |
| Bachelor's Degree | 8 (47.1%) | 96.0 |
| Graduate Degree | 4 (23.5%) | 70.0 |
| Total | 17 (100.0%) | 53.0 |
Fertility by Education by Marriage Status in San Antonio
41.2% of women with births in San Antonio are unmarried. Women with the educational attainment of graduate degree are most likely to be married with 100.0% of them married at childbirth, while women with the educational attainment of high school diploma are least likely to be married with 100.0% of them unmarried at childbirth.
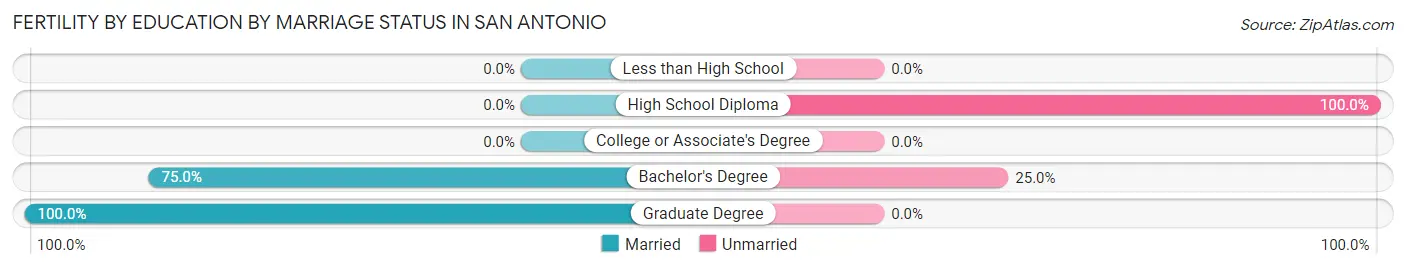
| Educational Attainment | Married | Unmarried |
| Less than High School | 0 (0.0%) | 0 (0.0%) |
| High School Diploma | 0 (0.0%) | 5 (100.0%) |
| College or Associate's Degree | 0 (0.0%) | 0 (0.0%) |
| Bachelor's Degree | 6 (75.0%) | 2 (25.0%) |
| Graduate Degree | 4 (100.0%) | 0 (0.0%) |
| Total | 10 (58.8%) | 7 (41.2%) |
Employment Characteristics in San Antonio
Employment by Class of Employer in San Antonio
Among the 662 employed individuals in San Antonio, private company employees (357 | 53.9%), local government employees (117 | 17.7%), and self-employed (incorporated) (56 | 8.5%) make up the most common classes of employment.
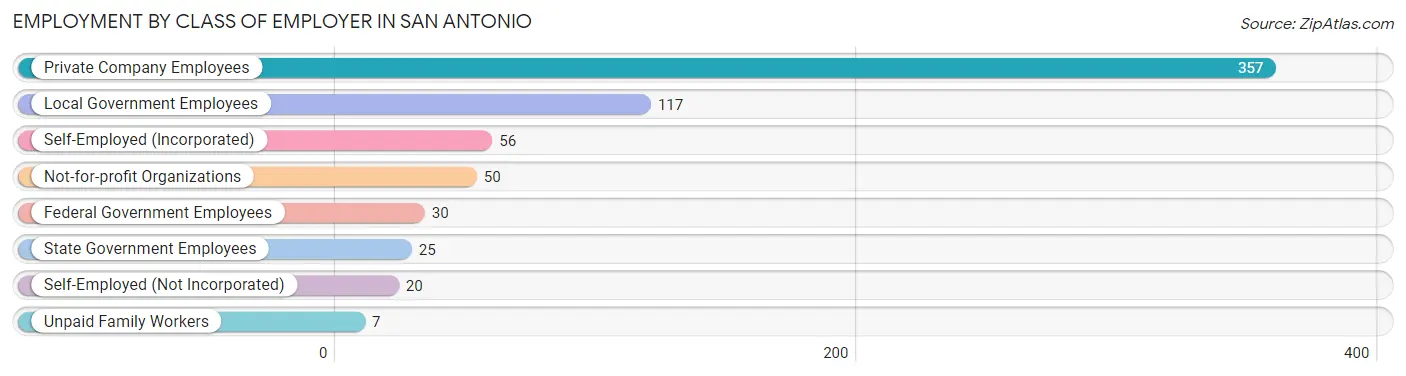
| Employer Class | # Employees | % Employees |
| Private Company Employees | 357 | 53.9% |
| Self-Employed (Incorporated) | 56 | 8.5% |
| Self-Employed (Not Incorporated) | 20 | 3.0% |
| Not-for-profit Organizations | 50 | 7.5% |
| Local Government Employees | 117 | 17.7% |
| State Government Employees | 25 | 3.8% |
| Federal Government Employees | 30 | 4.5% |
| Unpaid Family Workers | 7 | 1.1% |
| Total | 662 | 100.0% |
Employment Status by Age in San Antonio
According to the labor force statistics for San Antonio, out of the total population over 16 years of age (1,093), 62.8% or 686 individuals are in the labor force, with 2.9% or 20 of them unemployed. The age group with the highest labor force participation rate is 35 to 44 years, with 97.7% or 126 individuals in the labor force. Within the labor force, the 35 to 44 years age range has the highest percentage of unemployed individuals, with 13.5% or 17 of them being unemployed.
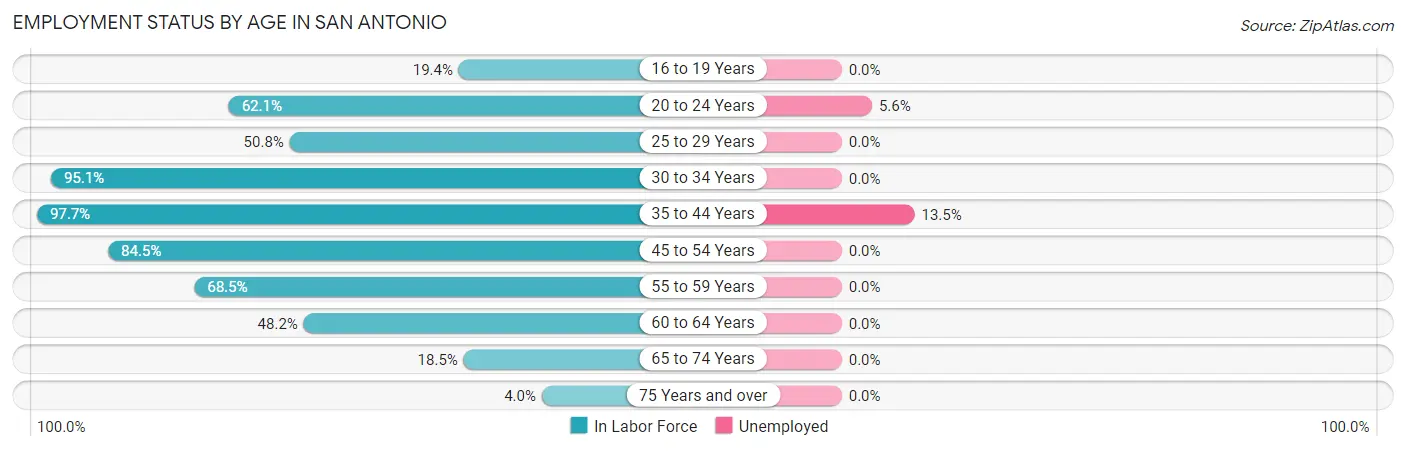
| Age Bracket | In Labor Force | Unemployed |
| 16 to 19 Years | 13 (19.4%) | 0 (0.0%) |
| 20 to 24 Years | 54 (62.1%) | 3 (5.6%) |
| 25 to 29 Years | 30 (50.8%) | 0 (0.0%) |
| 30 to 34 Years | 137 (95.1%) | 0 (0.0%) |
| 35 to 44 Years | 126 (97.7%) | 17 (13.5%) |
| 45 to 54 Years | 201 (84.5%) | 0 (0.0%) |
| 55 to 59 Years | 63 (68.5%) | 0 (0.0%) |
| 60 to 64 Years | 41 (48.2%) | 0 (0.0%) |
| 65 to 74 Years | 17 (18.5%) | 0 (0.0%) |
| 75 Years and over | 4 (4.0%) | 0 (0.0%) |
| Total | 686 (62.8%) | 20 (2.9%) |
Employment Status by Educational Attainment in San Antonio
According to labor force statistics for San Antonio, 80.1% of individuals (598) out of the total population between 25 and 64 years of age (747) are in the labor force, with 2.8% or 17 of them being unemployed. The group with the highest labor force participation rate are those with the educational attainment of bachelor's degree or higher, with 88.4% or 259 individuals in the labor force. Within the labor force, individuals with college / associate degree education have the highest percentage of unemployment, with 3.9% or 8 of them being unemployed.
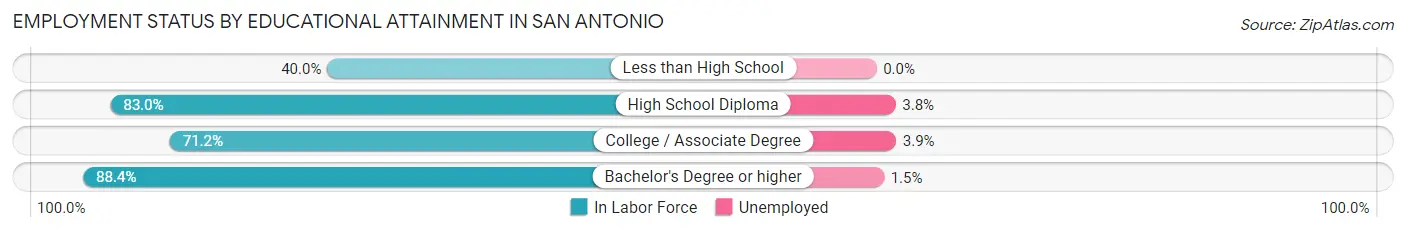
| Educational Attainment | In Labor Force | Unemployed |
| Less than High School | 4 (40.0%) | 0 (0.0%) |
| High School Diploma | 132 (83.0%) | 6 (3.8%) |
| College / Associate Degree | 203 (71.2%) | 11 (3.9%) |
| Bachelor's Degree or higher | 259 (88.4%) | 4 (1.5%) |
| Total | 598 (80.1%) | 21 (2.8%) |
Employment Occupations by Sex in San Antonio
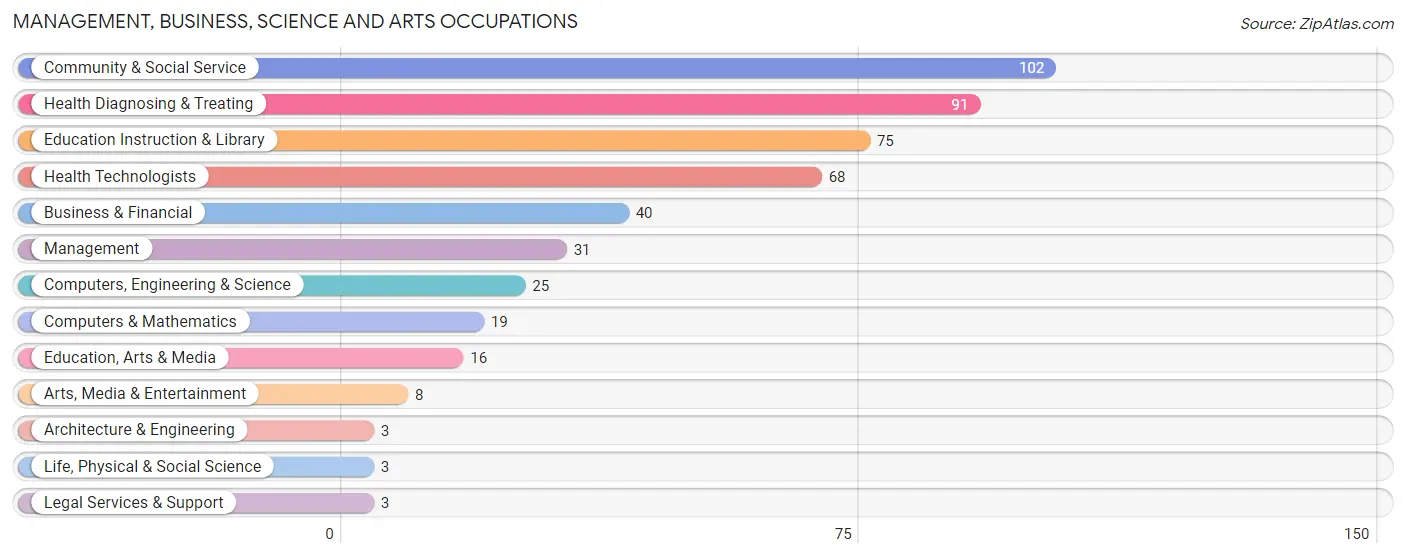
Management, Business, Science and Arts Occupations
The most common Management, Business, Science and Arts occupations in San Antonio are Community & Social Service (102 | 15.3%), Health Diagnosing & Treating (91 | 13.7%), Education Instruction & Library (75 | 11.3%), Health Technologists (68 | 10.2%), and Business & Financial (40 | 6.0%).
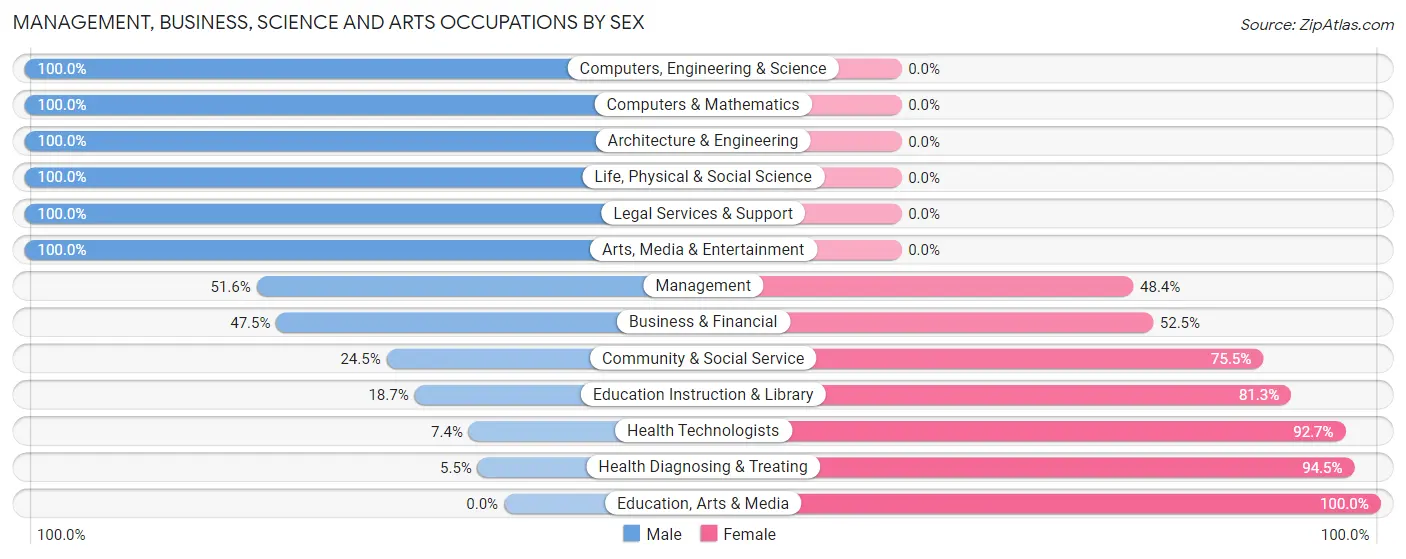
Management, Business, Science and Arts Occupations by Sex
Within the Management, Business, Science and Arts occupations in San Antonio, the most male-oriented occupations are Computers, Engineering & Science (100.0%), Computers & Mathematics (100.0%), and Architecture & Engineering (100.0%), while the most female-oriented occupations are Education, Arts & Media (100.0%), Health Diagnosing & Treating (94.5%), and Health Technologists (92.6%).
| Occupation | Male | Female |
| Management | 16 (51.6%) | 15 (48.4%) |
| Business & Financial | 19 (47.5%) | 21 (52.5%) |
| Computers, Engineering & Science | 25 (100.0%) | 0 (0.0%) |
| Computers & Mathematics | 19 (100.0%) | 0 (0.0%) |
| Architecture & Engineering | 3 (100.0%) | 0 (0.0%) |
| Life, Physical & Social Science | 3 (100.0%) | 0 (0.0%) |
| Community & Social Service | 25 (24.5%) | 77 (75.5%) |
| Education, Arts & Media | 0 (0.0%) | 16 (100.0%) |
| Legal Services & Support | 3 (100.0%) | 0 (0.0%) |
| Education Instruction & Library | 14 (18.7%) | 61 (81.3%) |
| Arts, Media & Entertainment | 8 (100.0%) | 0 (0.0%) |
| Health Diagnosing & Treating | 5 (5.5%) | 86 (94.5%) |
| Health Technologists | 5 (7.3%) | 63 (92.6%) |
| Total (Category) | 90 (31.1%) | 199 (68.9%) |
| Total (Overall) | 320 (48.0%) | 346 (51.9%) |
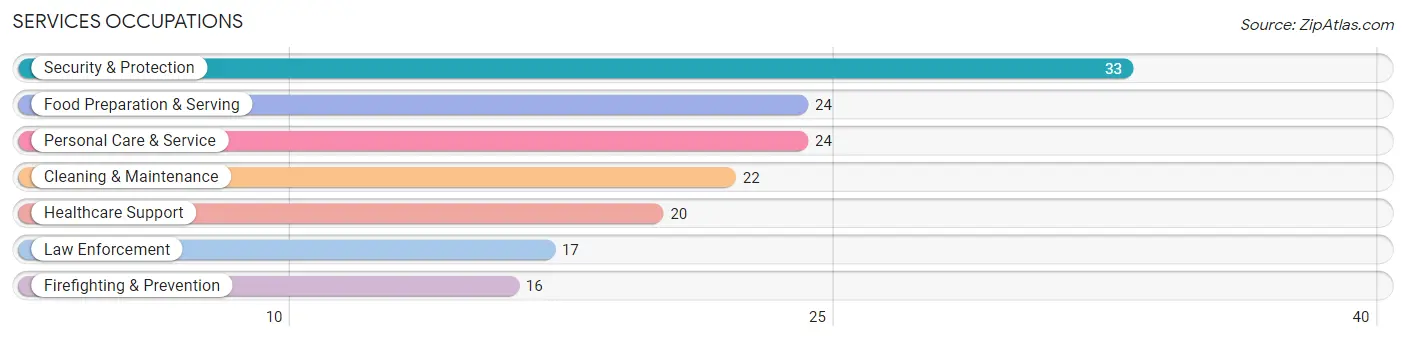
Services Occupations
The most common Services occupations in San Antonio are Security & Protection (33 | 5.0%), Food Preparation & Serving (24 | 3.6%), Personal Care & Service (24 | 3.6%), Cleaning & Maintenance (22 | 3.3%), and Healthcare Support (20 | 3.0%).
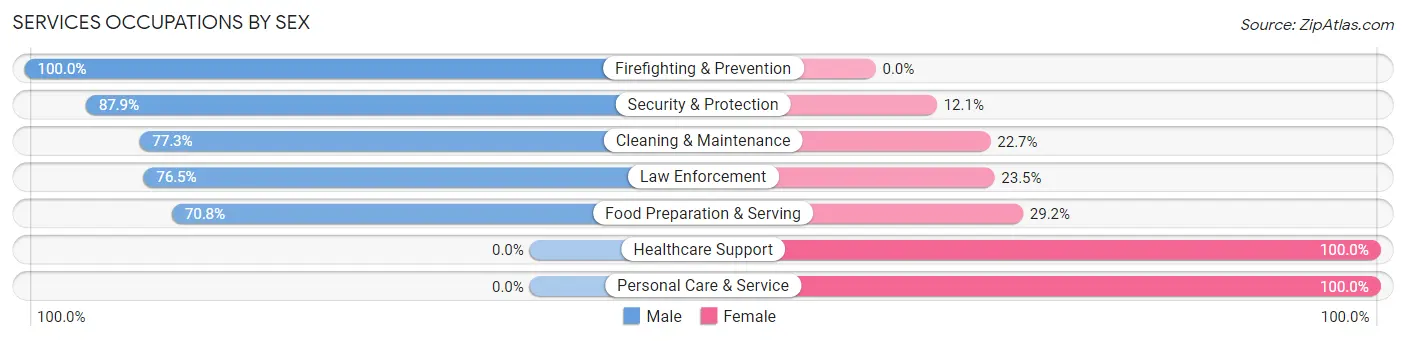
Services Occupations by Sex
Within the Services occupations in San Antonio, the most male-oriented occupations are Firefighting & Prevention (100.0%), Security & Protection (87.9%), and Cleaning & Maintenance (77.3%), while the most female-oriented occupations are Healthcare Support (100.0%), Personal Care & Service (100.0%), and Food Preparation & Serving (29.2%).
| Occupation | Male | Female |
| Healthcare Support | 0 (0.0%) | 20 (100.0%) |
| Security & Protection | 29 (87.9%) | 4 (12.1%) |
| Firefighting & Prevention | 16 (100.0%) | 0 (0.0%) |
| Law Enforcement | 13 (76.5%) | 4 (23.5%) |
| Food Preparation & Serving | 17 (70.8%) | 7 (29.2%) |
| Cleaning & Maintenance | 17 (77.3%) | 5 (22.7%) |
| Personal Care & Service | 0 (0.0%) | 24 (100.0%) |
| Total (Category) | 63 (51.2%) | 60 (48.8%) |
| Total (Overall) | 320 (48.0%) | 346 (51.9%) |
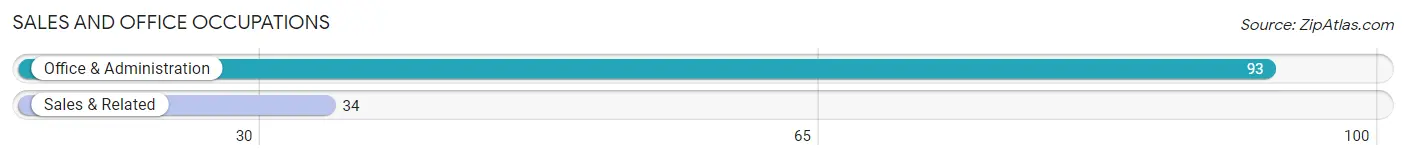
Sales and Office Occupations
The most common Sales and Office occupations in San Antonio are Office & Administration (93 | 14.0%), and Sales & Related (34 | 5.1%).
Sales and Office Occupations by Sex
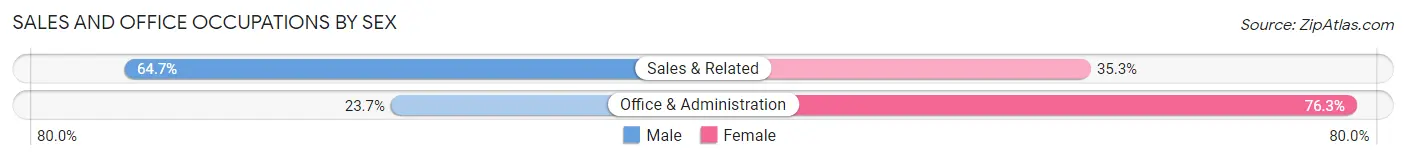
| Occupation | Male | Female |
| Sales & Related | 22 (64.7%) | 12 (35.3%) |
| Office & Administration | 22 (23.7%) | 71 (76.3%) |
| Total (Category) | 44 (34.6%) | 83 (65.3%) |
| Total (Overall) | 320 (48.0%) | 346 (51.9%) |
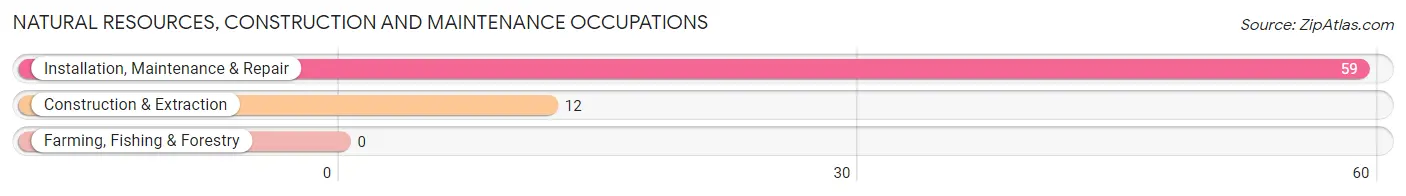
Natural Resources, Construction and Maintenance Occupations
The most common Natural Resources, Construction and Maintenance occupations in San Antonio are Installation, Maintenance & Repair (59 | 8.9%), and Construction & Extraction (12 | 1.8%).
Natural Resources, Construction and Maintenance Occupations by Sex
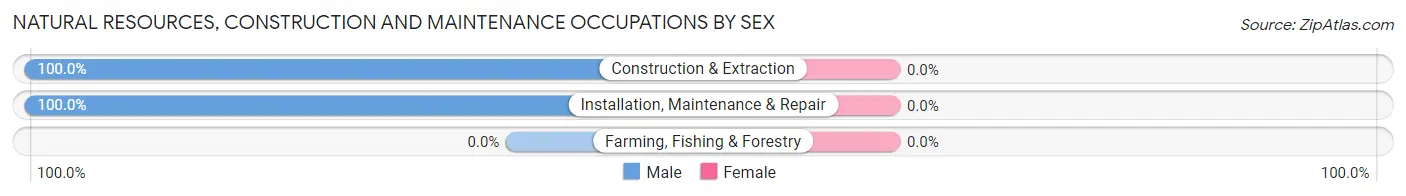
| Occupation | Male | Female |
| Farming, Fishing & Forestry | 0 (0.0%) | 0 (0.0%) |
| Construction & Extraction | 12 (100.0%) | 0 (0.0%) |
| Installation, Maintenance & Repair | 59 (100.0%) | 0 (0.0%) |
| Total (Category) | 71 (100.0%) | 0 (0.0%) |
| Total (Overall) | 320 (48.0%) | 346 (51.9%) |
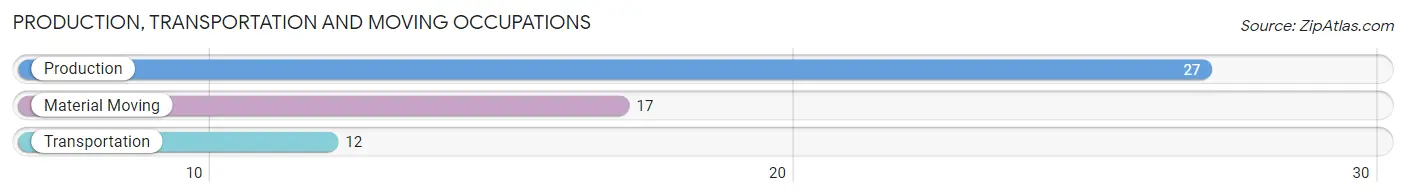
Production, Transportation and Moving Occupations
The most common Production, Transportation and Moving occupations in San Antonio are Production (27 | 4.1%), Material Moving (17 | 2.5%), and Transportation (12 | 1.8%).
Production, Transportation and Moving Occupations by Sex
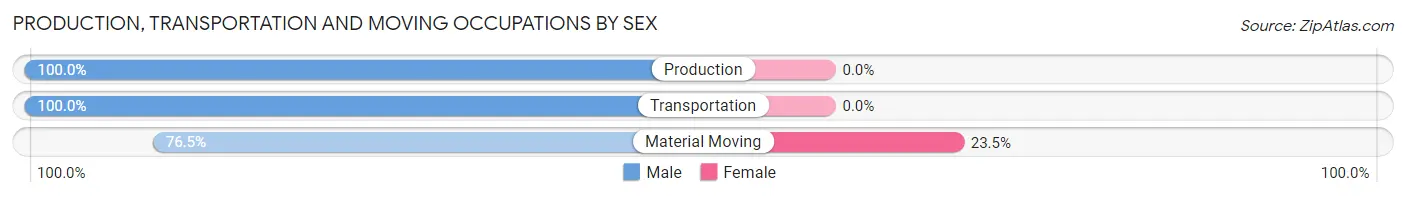
| Occupation | Male | Female |
| Production | 27 (100.0%) | 0 (0.0%) |
| Transportation | 12 (100.0%) | 0 (0.0%) |
| Material Moving | 13 (76.5%) | 4 (23.5%) |
| Total (Category) | 52 (92.9%) | 4 (7.1%) |
| Total (Overall) | 320 (48.0%) | 346 (51.9%) |
Employment Industries by Sex in San Antonio
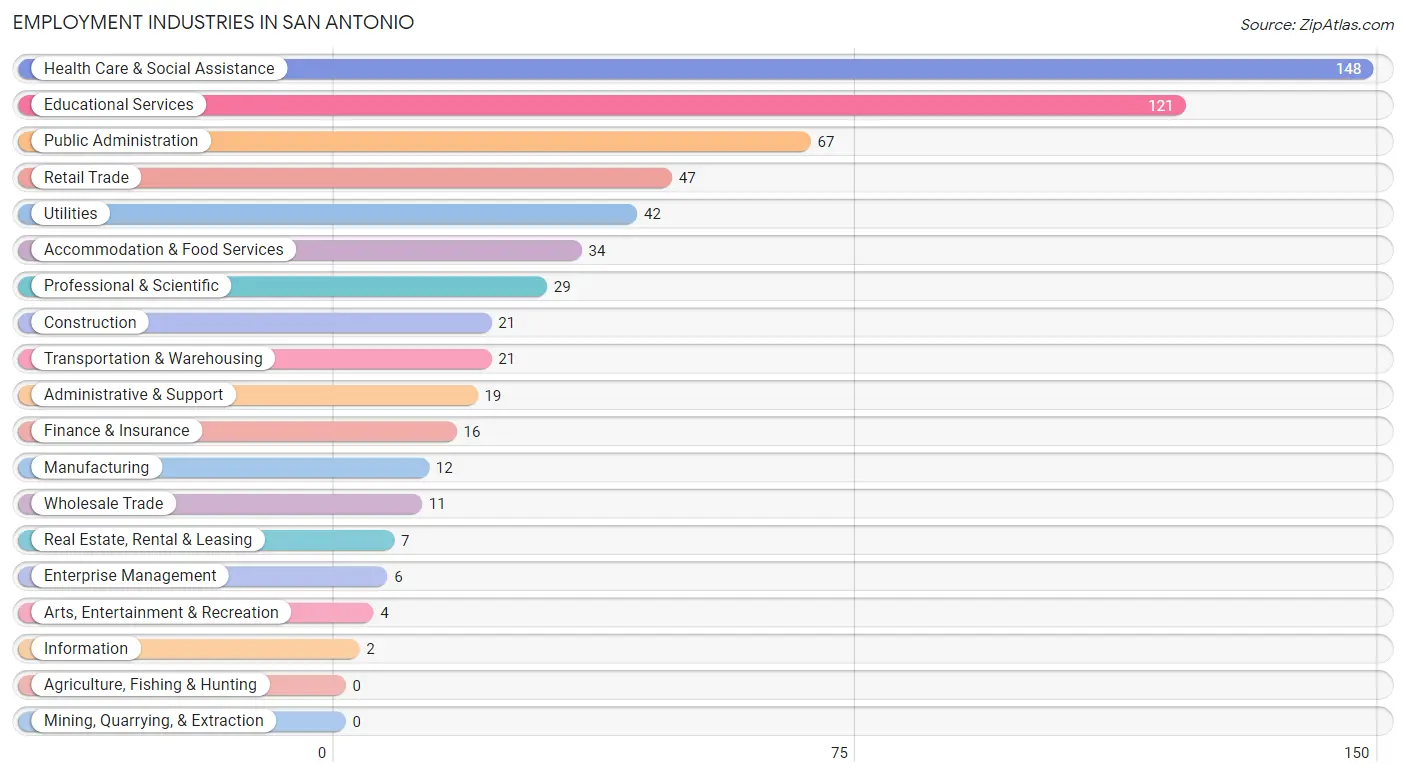
Employment Industries in San Antonio
The major employment industries in San Antonio include Health Care & Social Assistance (148 | 22.2%), Educational Services (121 | 18.2%), Public Administration (67 | 10.1%), Retail Trade (47 | 7.1%), and Utilities (42 | 6.3%).
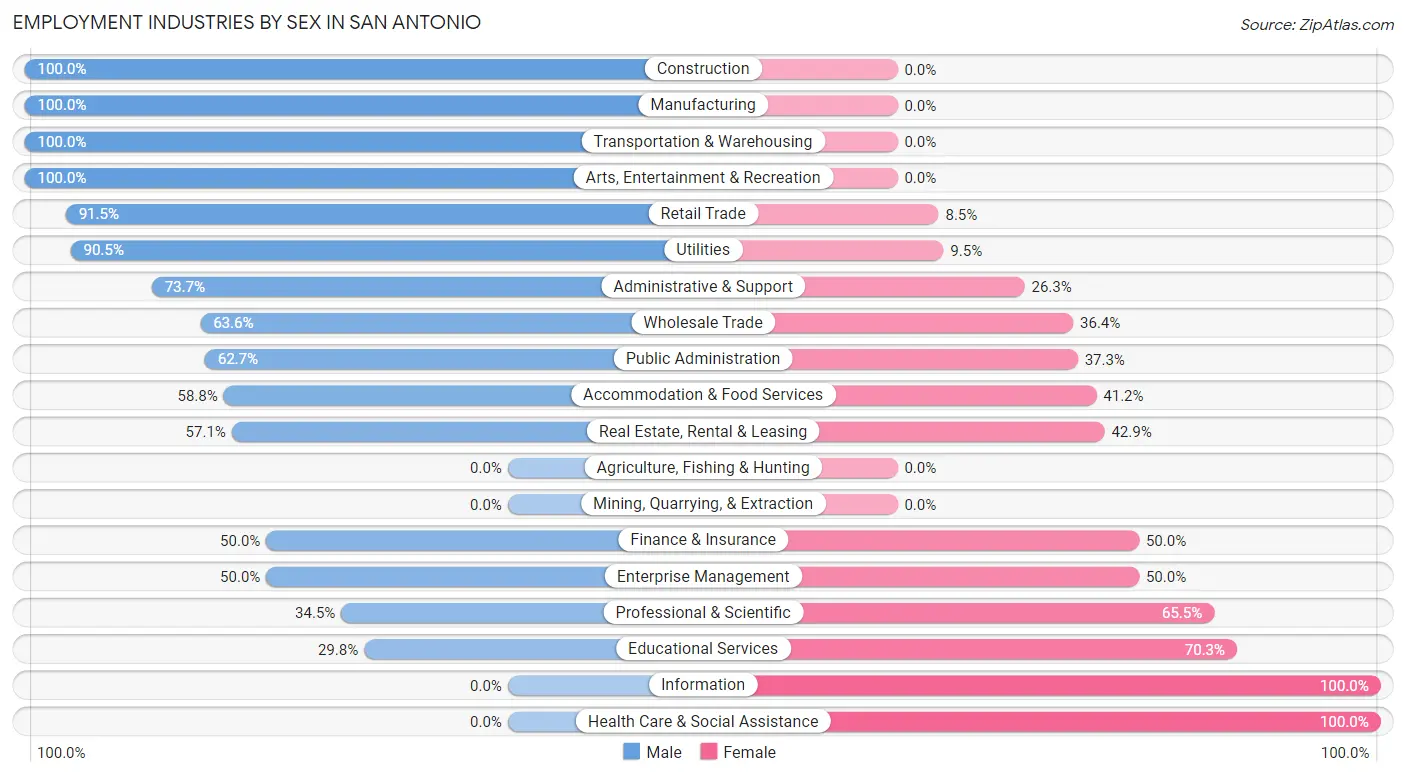
Employment Industries by Sex in San Antonio
The San Antonio industries that see more men than women are Construction (100.0%), Manufacturing (100.0%), and Transportation & Warehousing (100.0%), whereas the industries that tend to have a higher number of women are Information (100.0%), Health Care & Social Assistance (100.0%), and Educational Services (70.3%).
| Industry | Male | Female |
| Agriculture, Fishing & Hunting | 0 (0.0%) | 0 (0.0%) |
| Mining, Quarrying, & Extraction | 0 (0.0%) | 0 (0.0%) |
| Construction | 21 (100.0%) | 0 (0.0%) |
| Manufacturing | 12 (100.0%) | 0 (0.0%) |
| Wholesale Trade | 7 (63.6%) | 4 (36.4%) |
| Retail Trade | 43 (91.5%) | 4 (8.5%) |
| Transportation & Warehousing | 21 (100.0%) | 0 (0.0%) |
| Utilities | 38 (90.5%) | 4 (9.5%) |
| Information | 0 (0.0%) | 2 (100.0%) |
| Finance & Insurance | 8 (50.0%) | 8 (50.0%) |
| Real Estate, Rental & Leasing | 4 (57.1%) | 3 (42.9%) |
| Professional & Scientific | 10 (34.5%) | 19 (65.5%) |
| Enterprise Management | 3 (50.0%) | 3 (50.0%) |
| Administrative & Support | 14 (73.7%) | 5 (26.3%) |
| Educational Services | 36 (29.7%) | 85 (70.3%) |
| Health Care & Social Assistance | 0 (0.0%) | 148 (100.0%) |
| Arts, Entertainment & Recreation | 4 (100.0%) | 0 (0.0%) |
| Accommodation & Food Services | 20 (58.8%) | 14 (41.2%) |
| Public Administration | 42 (62.7%) | 25 (37.3%) |
| Total | 320 (48.0%) | 346 (51.9%) |
Education in San Antonio
School Enrollment in San Antonio
The most common levels of schooling among the 408 students in San Antonio are college / undergraduate (110 | 27.0%), elementary school (106 | 26.0%), and high school (76 | 18.6%).
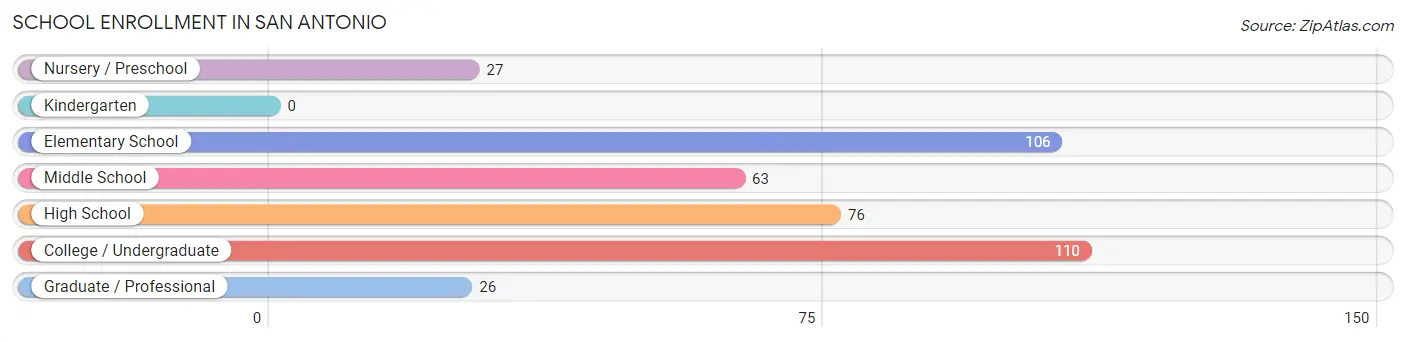
| School Level | # Students | % Students |
| Nursery / Preschool | 27 | 6.6% |
| Kindergarten | 0 | 0.0% |
| Elementary School | 106 | 26.0% |
| Middle School | 63 | 15.4% |
| High School | 76 | 18.6% |
| College / Undergraduate | 110 | 27.0% |
| Graduate / Professional | 26 | 6.4% |
| Total | 408 | 100.0% |
School Enrollment by Age by Funding Source in San Antonio
Out of a total of 408 students who are enrolled in schools in San Antonio, 115 (28.2%) attend a private institution, while the remaining 293 (71.8%) are enrolled in public schools. The age group of 25 to 34 year olds has the highest likelihood of being enrolled in private schools, with 25 (78.1% in the age bracket) enrolled. Conversely, the age group of 5 to 9 year old has the lowest likelihood of being enrolled in a private school, with 116 (95.9% in the age bracket) attending a public institution.
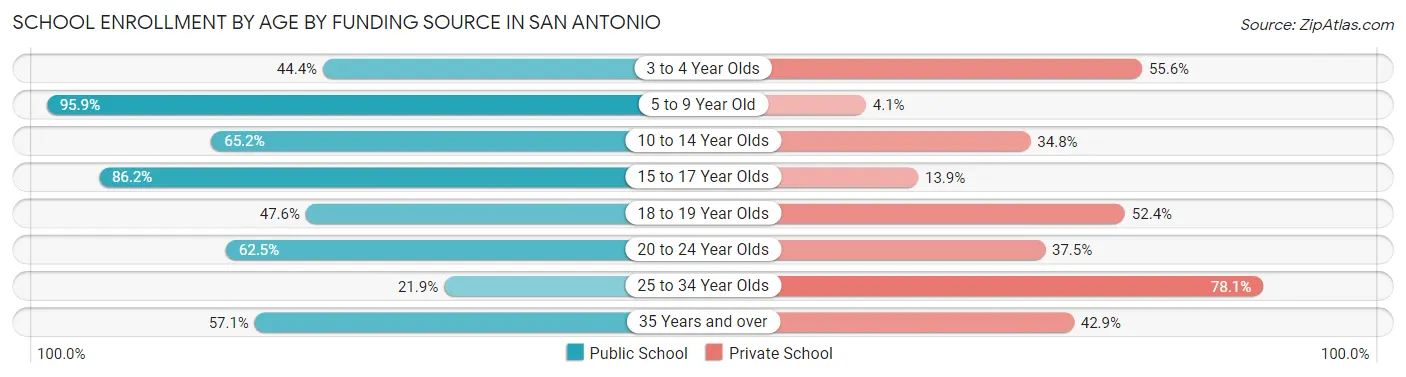
| Age Bracket | Public School | Private School |
| 3 to 4 Year Olds | 4 (44.4%) | 5 (55.6%) |
| 5 to 9 Year Old | 116 (95.9%) | 5 (4.1%) |
| 10 to 14 Year Olds | 45 (65.2%) | 24 (34.8%) |
| 15 to 17 Year Olds | 56 (86.2%) | 9 (13.9%) |
| 18 to 19 Year Olds | 10 (47.6%) | 11 (52.4%) |
| 20 to 24 Year Olds | 35 (62.5%) | 21 (37.5%) |
| 25 to 34 Year Olds | 7 (21.9%) | 25 (78.1%) |
| 35 Years and over | 20 (57.1%) | 15 (42.9%) |
| Total | 293 (71.8%) | 115 (28.2%) |
Educational Attainment by Field of Study in San Antonio
Business (90 | 26.4%), science & technology (67 | 19.7%), education (56 | 16.4%), engineering (35 | 10.3%), and bio, nature & agricultural (22 | 6.5%) are the most common fields of study among 341 individuals in San Antonio who have obtained a bachelor's degree or higher.
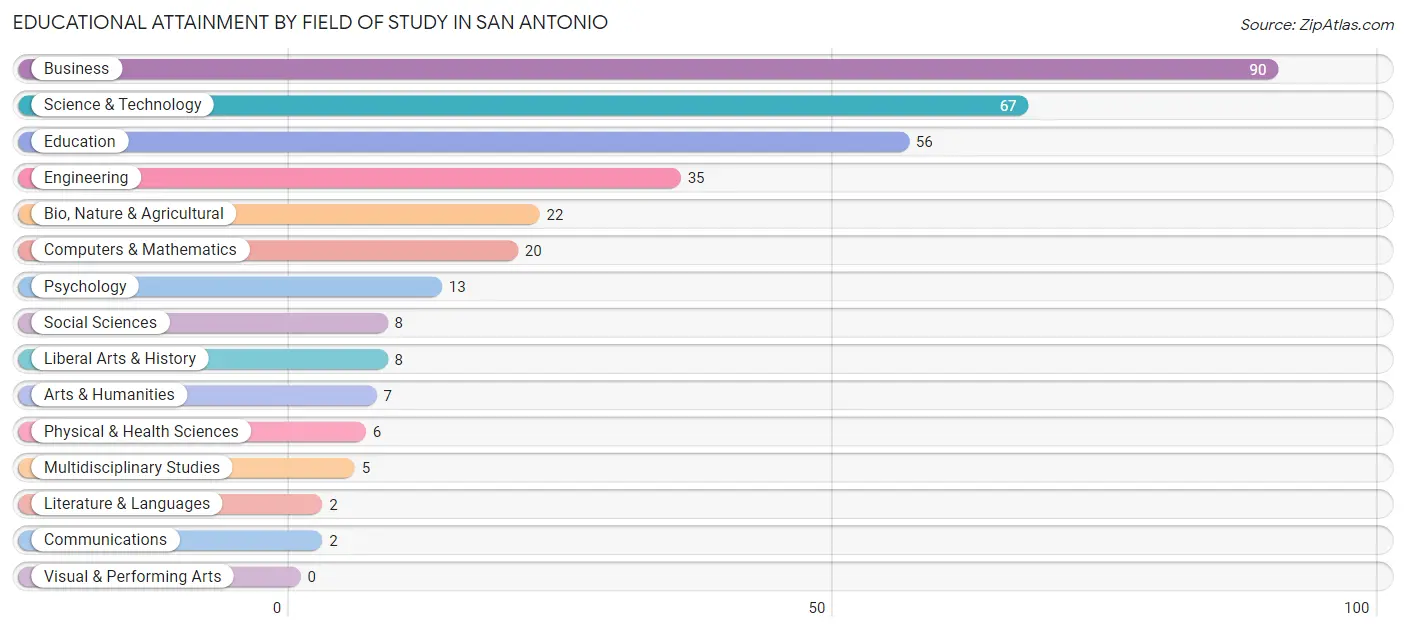
| Field of Study | # Graduates | % Graduates |
| Computers & Mathematics | 20 | 5.9% |
| Bio, Nature & Agricultural | 22 | 6.5% |
| Physical & Health Sciences | 6 | 1.8% |
| Psychology | 13 | 3.8% |
| Social Sciences | 8 | 2.4% |
| Engineering | 35 | 10.3% |
| Multidisciplinary Studies | 5 | 1.5% |
| Science & Technology | 67 | 19.7% |
| Business | 90 | 26.4% |
| Education | 56 | 16.4% |
| Literature & Languages | 2 | 0.6% |
| Liberal Arts & History | 8 | 2.4% |
| Visual & Performing Arts | 0 | 0.0% |
| Communications | 2 | 0.6% |
| Arts & Humanities | 7 | 2.1% |
| Total | 341 | 100.0% |
Transportation & Commute in San Antonio
Vehicle Availability by Sex in San Antonio
The most prevalent vehicle ownership categories in San Antonio are males with 2 vehicles (156, accounting for 49.5%) and females with 2 vehicles (135, making up 45.6%).
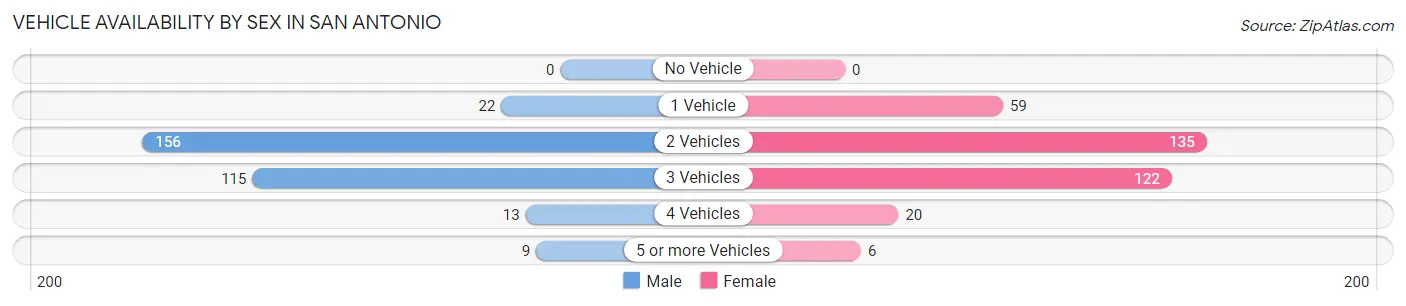
| Vehicles Available | Male | Female |
| No Vehicle | 0 (0.0%) | 0 (0.0%) |
| 1 Vehicle | 22 (7.0%) | 59 (17.2%) |
| 2 Vehicles | 156 (49.5%) | 135 (39.5%) |
| 3 Vehicles | 115 (36.5%) | 122 (35.7%) |
| 4 Vehicles | 13 (4.1%) | 20 (5.9%) |
| 5 or more Vehicles | 9 (2.9%) | 6 (1.8%) |
| Total | 315 (100.0%) | 342 (100.0%) |
Commute Time in San Antonio
The most frequently occuring commute durations in San Antonio are 15 to 19 minutes (126 commuters, 19.8%), 30 to 34 minutes (120 commuters, 18.9%), and 45 to 59 minutes (94 commuters, 14.8%).
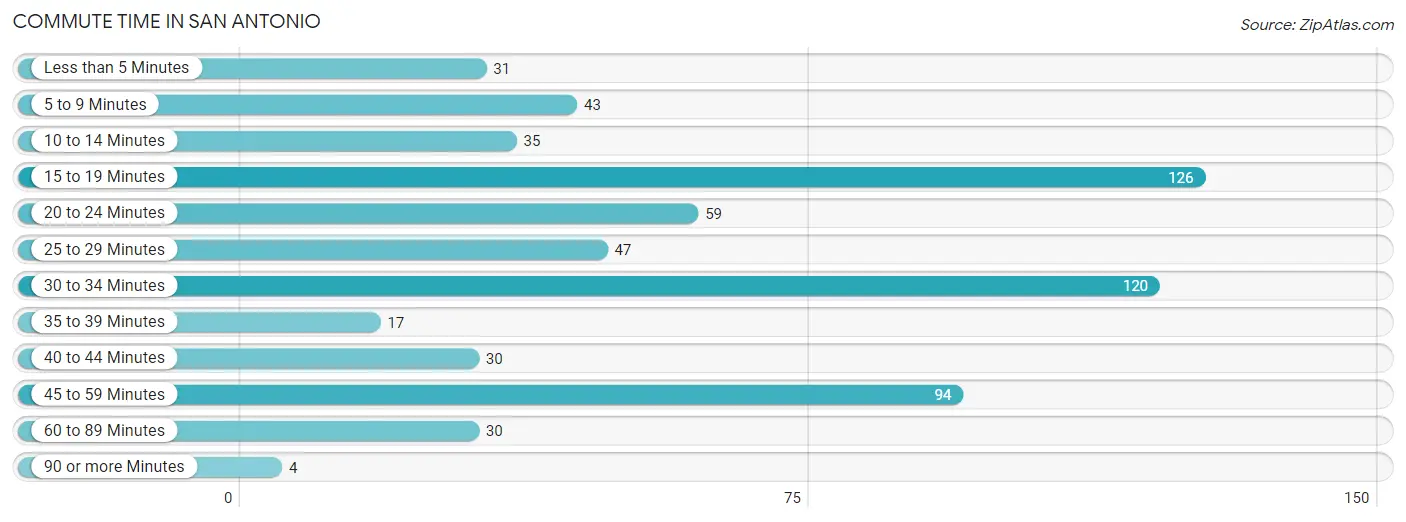
| Commute Time | # Commuters | % Commuters |
| Less than 5 Minutes | 31 | 4.9% |
| 5 to 9 Minutes | 43 | 6.8% |
| 10 to 14 Minutes | 35 | 5.5% |
| 15 to 19 Minutes | 126 | 19.8% |
| 20 to 24 Minutes | 59 | 9.3% |
| 25 to 29 Minutes | 47 | 7.4% |
| 30 to 34 Minutes | 120 | 18.9% |
| 35 to 39 Minutes | 17 | 2.7% |
| 40 to 44 Minutes | 30 | 4.7% |
| 45 to 59 Minutes | 94 | 14.8% |
| 60 to 89 Minutes | 30 | 4.7% |
| 90 or more Minutes | 4 | 0.6% |
Commute Time by Sex in San Antonio
The most common commute times in San Antonio are 15 to 19 minutes (57 commuters, 18.4%) for males and 30 to 34 minutes (74 commuters, 22.7%) for females.
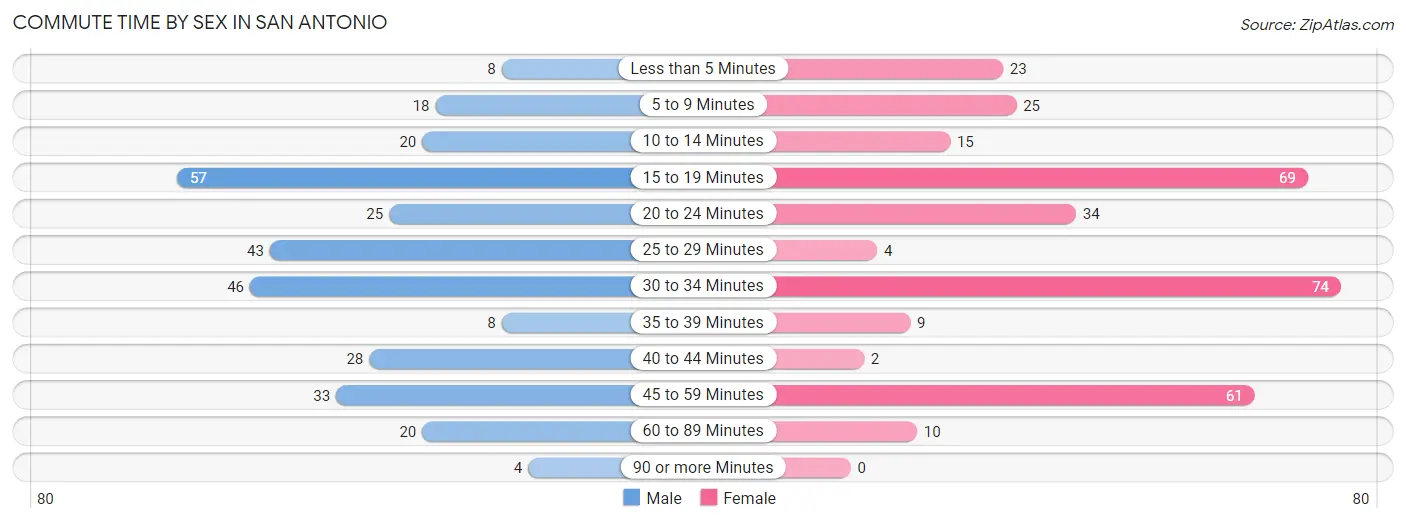
| Commute Time | Male | Female |
| Less than 5 Minutes | 8 (2.6%) | 23 (7.1%) |
| 5 to 9 Minutes | 18 (5.8%) | 25 (7.7%) |
| 10 to 14 Minutes | 20 (6.5%) | 15 (4.6%) |
| 15 to 19 Minutes | 57 (18.4%) | 69 (21.2%) |
| 20 to 24 Minutes | 25 (8.1%) | 34 (10.4%) |
| 25 to 29 Minutes | 43 (13.9%) | 4 (1.2%) |
| 30 to 34 Minutes | 46 (14.8%) | 74 (22.7%) |
| 35 to 39 Minutes | 8 (2.6%) | 9 (2.8%) |
| 40 to 44 Minutes | 28 (9.0%) | 2 (0.6%) |
| 45 to 59 Minutes | 33 (10.6%) | 61 (18.7%) |
| 60 to 89 Minutes | 20 (6.5%) | 10 (3.1%) |
| 90 or more Minutes | 4 (1.3%) | 0 (0.0%) |
Time of Departure to Work by Sex in San Antonio
The most frequent times of departure to work in San Antonio are 6:00 AM to 6:29 AM (53, 17.1%) for males and 6:30 AM to 6:59 AM (66, 20.3%) for females.
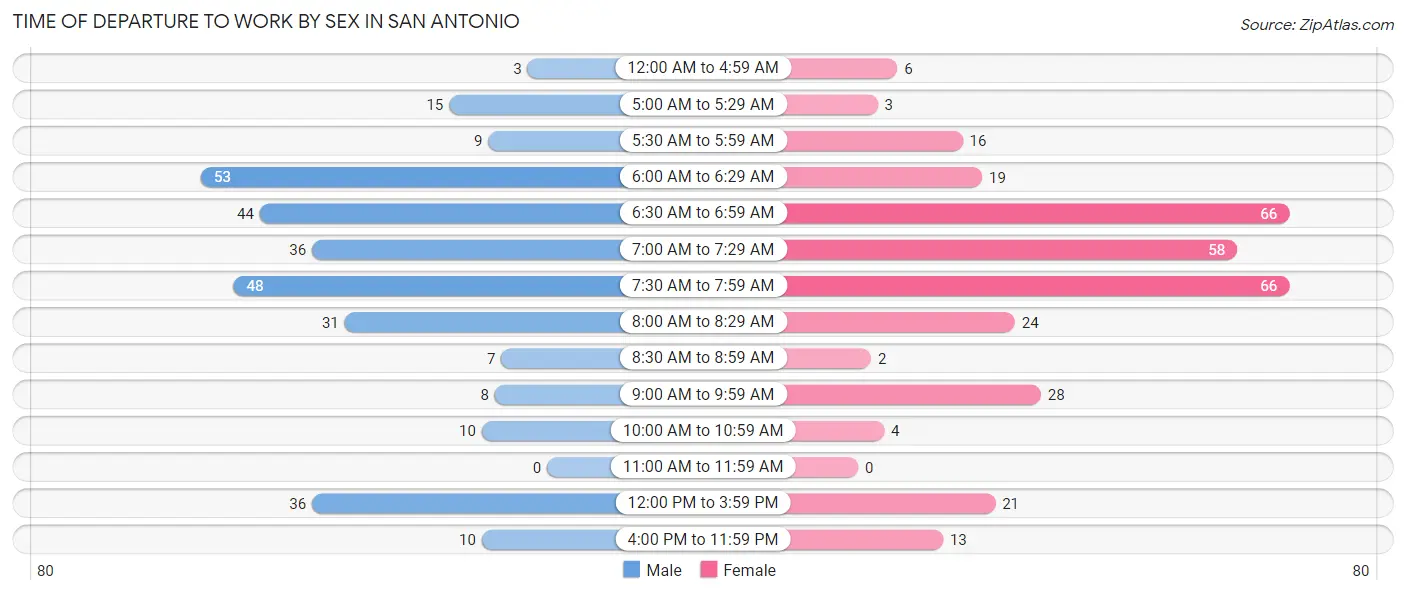
| Time of Departure | Male | Female |
| 12:00 AM to 4:59 AM | 3 (1.0%) | 6 (1.8%) |
| 5:00 AM to 5:29 AM | 15 (4.8%) | 3 (0.9%) |
| 5:30 AM to 5:59 AM | 9 (2.9%) | 16 (4.9%) |
| 6:00 AM to 6:29 AM | 53 (17.1%) | 19 (5.8%) |
| 6:30 AM to 6:59 AM | 44 (14.2%) | 66 (20.3%) |
| 7:00 AM to 7:29 AM | 36 (11.6%) | 58 (17.8%) |
| 7:30 AM to 7:59 AM | 48 (15.5%) | 66 (20.3%) |
| 8:00 AM to 8:29 AM | 31 (10.0%) | 24 (7.4%) |
| 8:30 AM to 8:59 AM | 7 (2.3%) | 2 (0.6%) |
| 9:00 AM to 9:59 AM | 8 (2.6%) | 28 (8.6%) |
| 10:00 AM to 10:59 AM | 10 (3.2%) | 4 (1.2%) |
| 11:00 AM to 11:59 AM | 0 (0.0%) | 0 (0.0%) |
| 12:00 PM to 3:59 PM | 36 (11.6%) | 21 (6.4%) |
| 4:00 PM to 11:59 PM | 10 (3.2%) | 13 (4.0%) |
| Total | 310 (100.0%) | 326 (100.0%) |
Housing Occupancy in San Antonio
Occupancy by Ownership in San Antonio
Of the total 510 dwellings in San Antonio, owner-occupied units account for 431 (84.5%), while renter-occupied units make up 79 (15.5%).
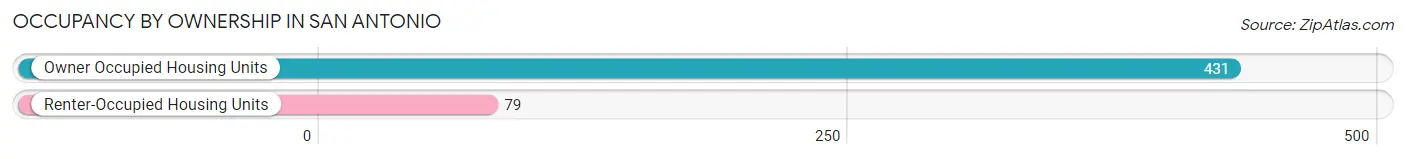
| Occupancy | # Housing Units | % Housing Units |
| Owner Occupied Housing Units | 431 | 84.5% |
| Renter-Occupied Housing Units | 79 | 15.5% |
| Total Occupied Housing Units | 510 | 100.0% |
Occupancy by Household Size in San Antonio
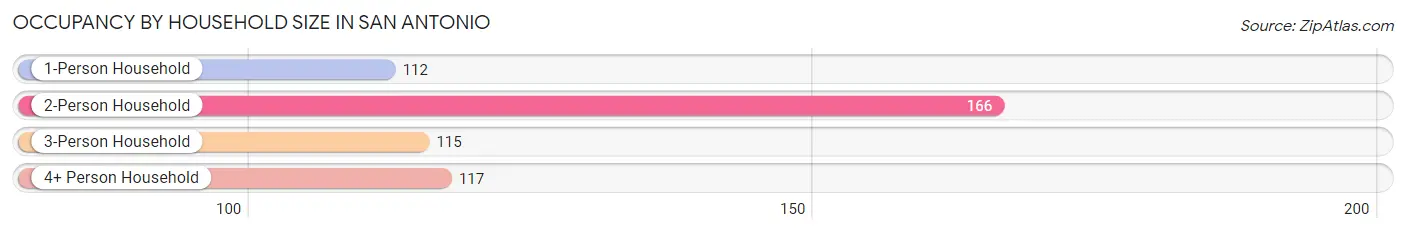
| Household Size | # Housing Units | % Housing Units |
| 1-Person Household | 112 | 22.0% |
| 2-Person Household | 166 | 32.6% |
| 3-Person Household | 115 | 22.6% |
| 4+ Person Household | 117 | 22.9% |
| Total Housing Units | 510 | 100.0% |
Occupancy by Ownership by Household Size in San Antonio
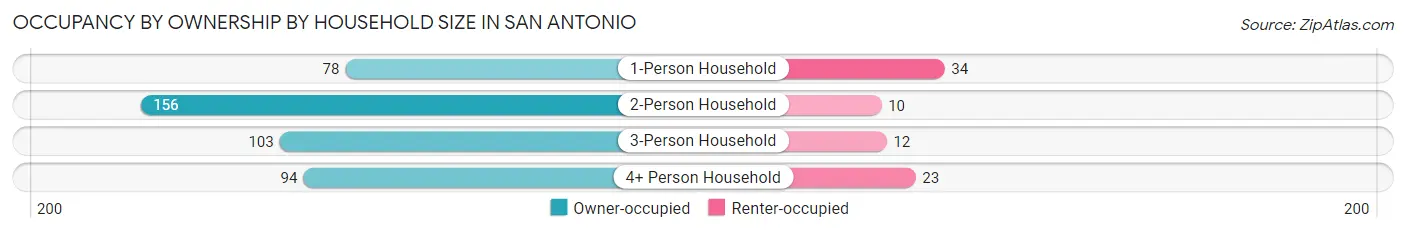
| Household Size | Owner-occupied | Renter-occupied |
| 1-Person Household | 78 (69.6%) | 34 (30.4%) |
| 2-Person Household | 156 (94.0%) | 10 (6.0%) |
| 3-Person Household | 103 (89.6%) | 12 (10.4%) |
| 4+ Person Household | 94 (80.3%) | 23 (19.7%) |
| Total Housing Units | 431 (84.5%) | 79 (15.5%) |
Occupancy by Educational Attainment in San Antonio
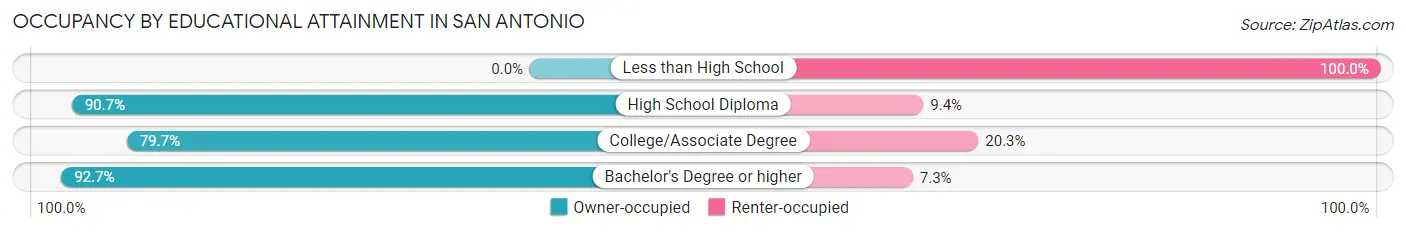
| Household Size | Owner-occupied | Renter-occupied |
| Less than High School | 0 (0.0%) | 11 (100.0%) |
| High School Diploma | 97 (90.6%) | 10 (9.3%) |
| College/Associate Degree | 181 (79.7%) | 46 (20.3%) |
| Bachelor's Degree or higher | 153 (92.7%) | 12 (7.3%) |
Occupancy by Age of Householder in San Antonio
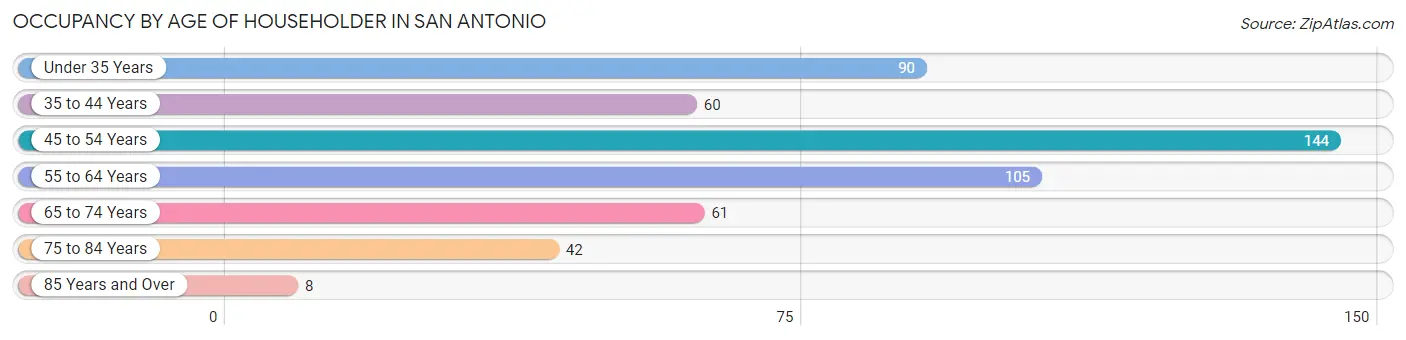
| Age Bracket | # Households | % Households |
| Under 35 Years | 90 | 17.6% |
| 35 to 44 Years | 60 | 11.8% |
| 45 to 54 Years | 144 | 28.2% |
| 55 to 64 Years | 105 | 20.6% |
| 65 to 74 Years | 61 | 12.0% |
| 75 to 84 Years | 42 | 8.2% |
| 85 Years and Over | 8 | 1.6% |
| Total | 510 | 100.0% |
Housing Finances in San Antonio
Median Income by Occupancy in San Antonio
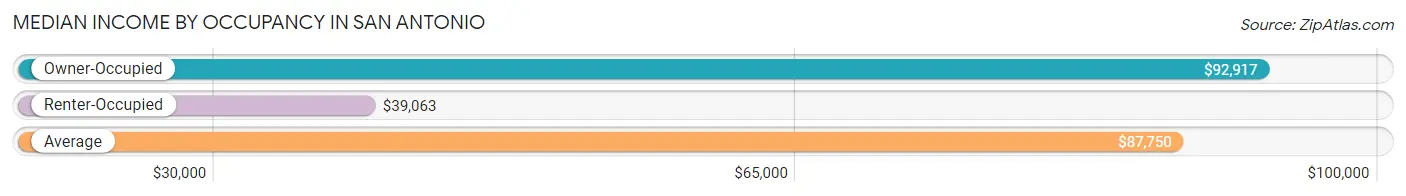
| Occupancy Type | # Households | Median Income |
| Owner-Occupied | 431 (84.5%) | $92,917 |
| Renter-Occupied | 79 (15.5%) | $39,063 |
| Average | 510 (100.0%) | $87,750 |
Occupancy by Householder Income Bracket in San Antonio
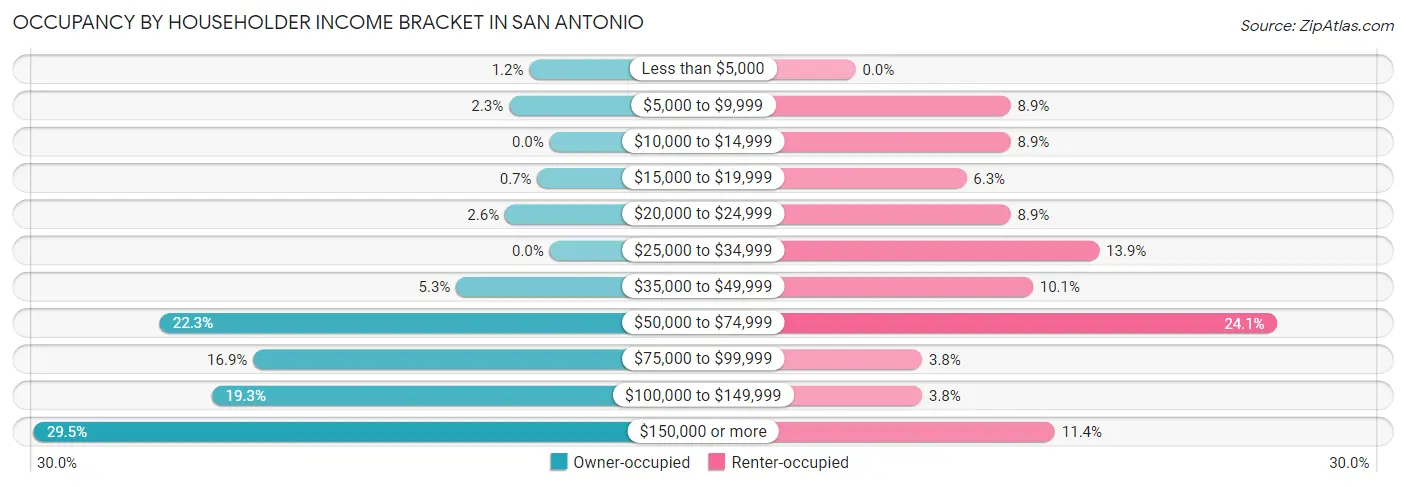
| Income Bracket | Owner-occupied | Renter-occupied |
| Less than $5,000 | 5 (1.2%) | 0 (0.0%) |
| $5,000 to $9,999 | 10 (2.3%) | 7 (8.9%) |
| $10,000 to $14,999 | 0 (0.0%) | 7 (8.9%) |
| $15,000 to $19,999 | 3 (0.7%) | 5 (6.3%) |
| $20,000 to $24,999 | 11 (2.5%) | 7 (8.9%) |
| $25,000 to $34,999 | 0 (0.0%) | 11 (13.9%) |
| $35,000 to $49,999 | 23 (5.3%) | 8 (10.1%) |
| $50,000 to $74,999 | 96 (22.3%) | 19 (24.0%) |
| $75,000 to $99,999 | 73 (16.9%) | 3 (3.8%) |
| $100,000 to $149,999 | 83 (19.3%) | 3 (3.8%) |
| $150,000 or more | 127 (29.5%) | 9 (11.4%) |
| Total | 431 (100.0%) | 79 (100.0%) |
Monthly Housing Cost Tiers in San Antonio
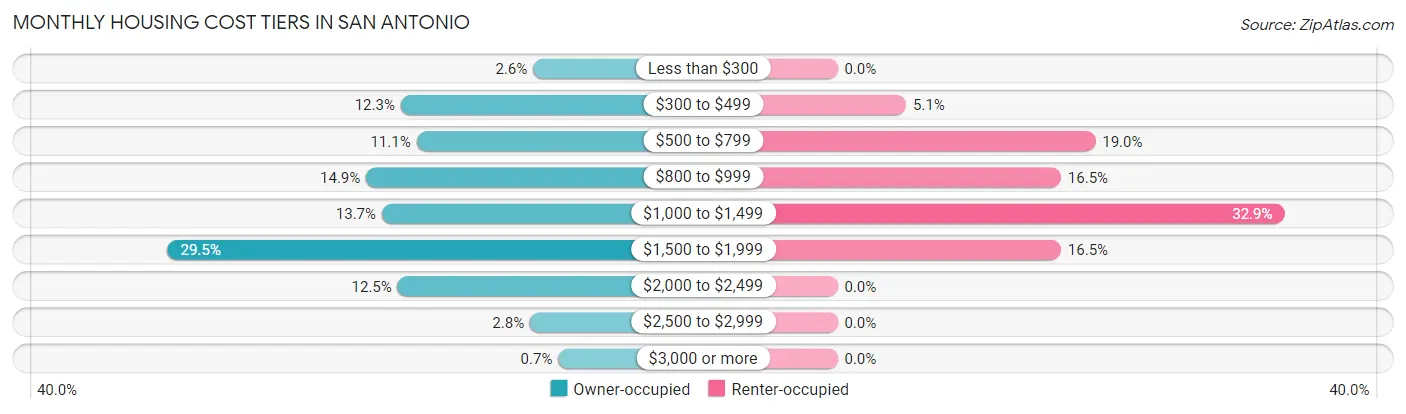
| Monthly Cost | Owner-occupied | Renter-occupied |
| Less than $300 | 11 (2.5%) | 0 (0.0%) |
| $300 to $499 | 53 (12.3%) | 4 (5.1%) |
| $500 to $799 | 48 (11.1%) | 15 (19.0%) |
| $800 to $999 | 64 (14.8%) | 13 (16.5%) |
| $1,000 to $1,499 | 59 (13.7%) | 26 (32.9%) |
| $1,500 to $1,999 | 127 (29.5%) | 13 (16.5%) |
| $2,000 to $2,499 | 54 (12.5%) | 0 (0.0%) |
| $2,500 to $2,999 | 12 (2.8%) | 0 (0.0%) |
| $3,000 or more | 3 (0.7%) | 0 (0.0%) |
| Total | 431 (100.0%) | 79 (100.0%) |
Physical Housing Characteristics in San Antonio
Housing Structures in San Antonio
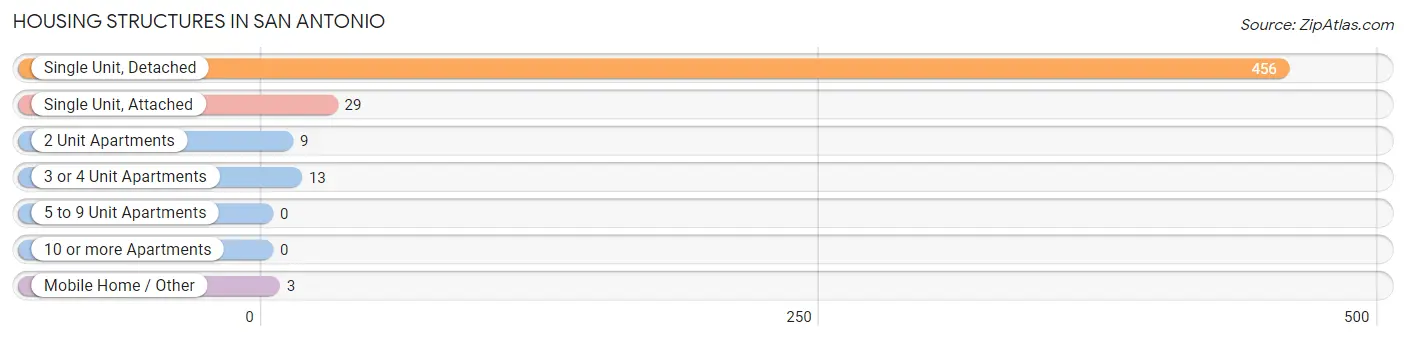
| Structure Type | # Housing Units | % Housing Units |
| Single Unit, Detached | 456 | 89.4% |
| Single Unit, Attached | 29 | 5.7% |
| 2 Unit Apartments | 9 | 1.8% |
| 3 or 4 Unit Apartments | 13 | 2.5% |
| 5 to 9 Unit Apartments | 0 | 0.0% |
| 10 or more Apartments | 0 | 0.0% |
| Mobile Home / Other | 3 | 0.6% |
| Total | 510 | 100.0% |
Housing Structures by Occupancy in San Antonio
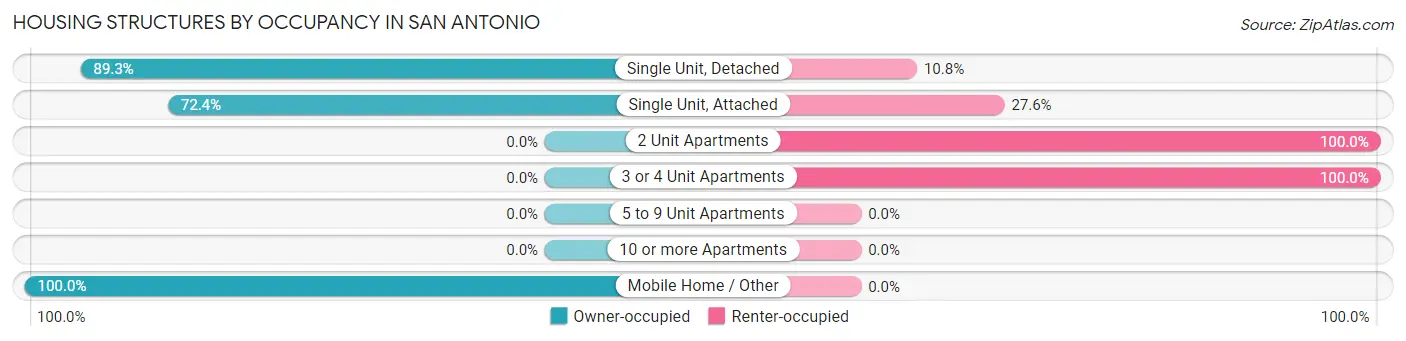
| Structure Type | Owner-occupied | Renter-occupied |
| Single Unit, Detached | 407 (89.2%) | 49 (10.7%) |
| Single Unit, Attached | 21 (72.4%) | 8 (27.6%) |
| 2 Unit Apartments | 0 (0.0%) | 9 (100.0%) |
| 3 or 4 Unit Apartments | 0 (0.0%) | 13 (100.0%) |
| 5 to 9 Unit Apartments | 0 (0.0%) | 0 (0.0%) |
| 10 or more Apartments | 0 (0.0%) | 0 (0.0%) |
| Mobile Home / Other | 3 (100.0%) | 0 (0.0%) |
| Total | 431 (84.5%) | 79 (15.5%) |
Housing Structures by Number of Rooms in San Antonio
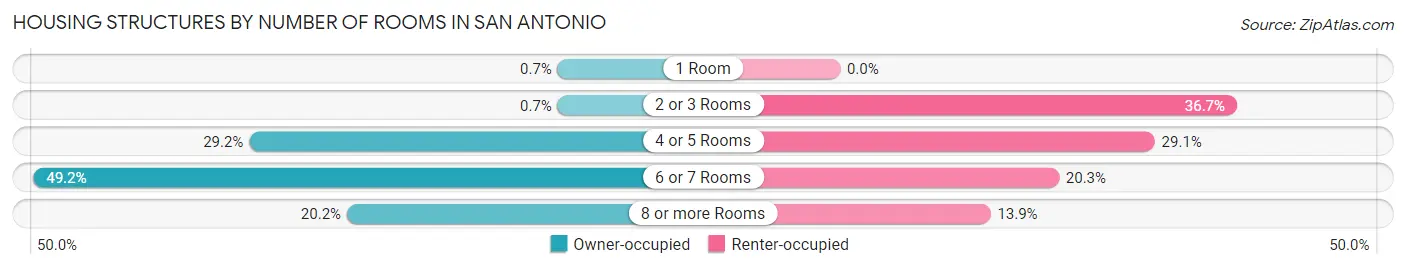
| Number of Rooms | Owner-occupied | Renter-occupied |
| 1 Room | 3 (0.7%) | 0 (0.0%) |
| 2 or 3 Rooms | 3 (0.7%) | 29 (36.7%) |
| 4 or 5 Rooms | 126 (29.2%) | 23 (29.1%) |
| 6 or 7 Rooms | 212 (49.2%) | 16 (20.3%) |
| 8 or more Rooms | 87 (20.2%) | 11 (13.9%) |
| Total | 431 (100.0%) | 79 (100.0%) |
Housing Structure by Heating Type in San Antonio
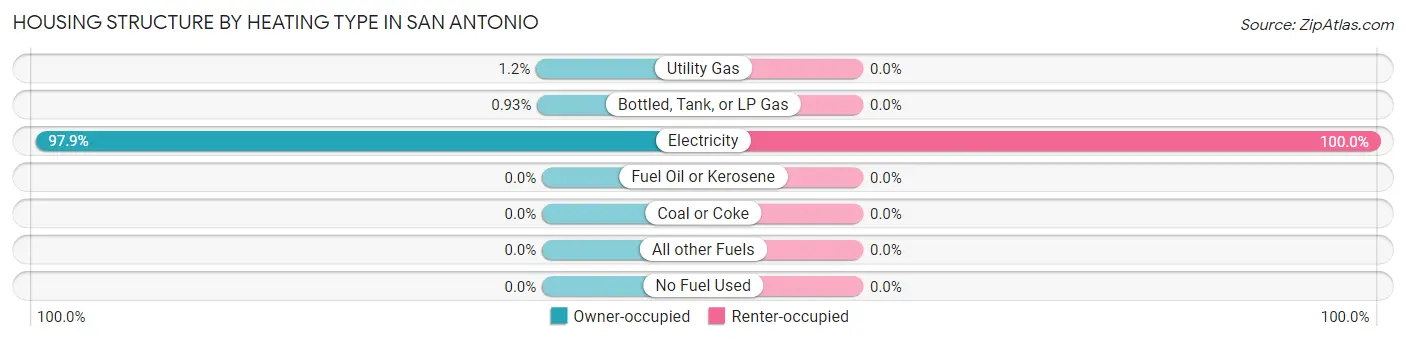
| Heating Type | Owner-occupied | Renter-occupied |
| Utility Gas | 5 (1.2%) | 0 (0.0%) |
| Bottled, Tank, or LP Gas | 4 (0.9%) | 0 (0.0%) |
| Electricity | 422 (97.9%) | 79 (100.0%) |
| Fuel Oil or Kerosene | 0 (0.0%) | 0 (0.0%) |
| Coal or Coke | 0 (0.0%) | 0 (0.0%) |
| All other Fuels | 0 (0.0%) | 0 (0.0%) |
| No Fuel Used | 0 (0.0%) | 0 (0.0%) |
| Total | 431 (100.0%) | 79 (100.0%) |
Household Vehicle Usage in San Antonio
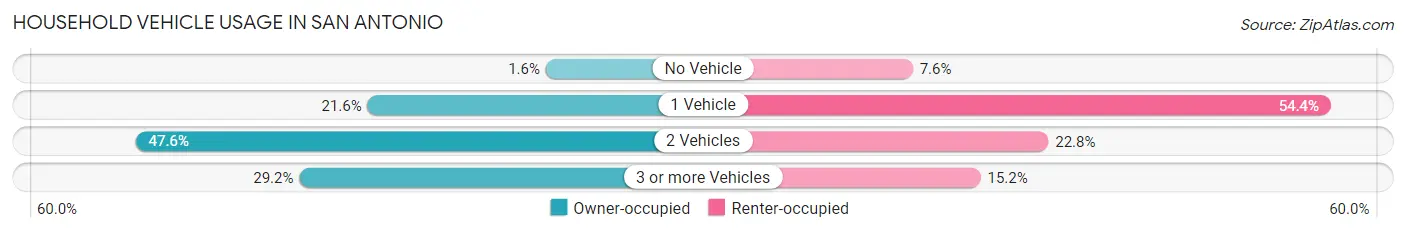
| Vehicles per Household | Owner-occupied | Renter-occupied |
| No Vehicle | 7 (1.6%) | 6 (7.6%) |
| 1 Vehicle | 93 (21.6%) | 43 (54.4%) |
| 2 Vehicles | 205 (47.6%) | 18 (22.8%) |
| 3 or more Vehicles | 126 (29.2%) | 12 (15.2%) |
| Total | 431 (100.0%) | 79 (100.0%) |
Real Estate & Mortgages in San Antonio
Real Estate and Mortgage Overview in San Antonio
| Characteristic | Without Mortgage | With Mortgage |
| Housing Units | 118 | 313 |
| Median Property Value | $280,400 | $322,600 |
| Median Household Income | $86,136 | $98 |
| Monthly Housing Costs | $485 | $3 |
| Real Estate Taxes | $1,838 | $0 |
Property Value by Mortgage Status in San Antonio
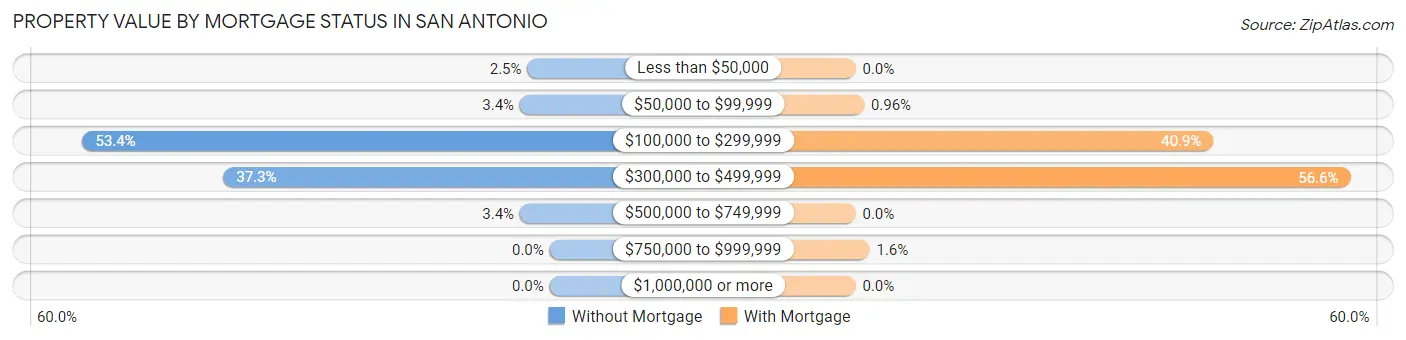
| Property Value | Without Mortgage | With Mortgage |
| Less than $50,000 | 3 (2.5%) | 0 (0.0%) |
| $50,000 to $99,999 | 4 (3.4%) | 3 (1.0%) |
| $100,000 to $299,999 | 63 (53.4%) | 128 (40.9%) |
| $300,000 to $499,999 | 44 (37.3%) | 177 (56.6%) |
| $500,000 to $749,999 | 4 (3.4%) | 0 (0.0%) |
| $750,000 to $999,999 | 0 (0.0%) | 5 (1.6%) |
| $1,000,000 or more | 0 (0.0%) | 0 (0.0%) |
| Total | 118 (100.0%) | 313 (100.0%) |
Household Income by Mortgage Status in San Antonio
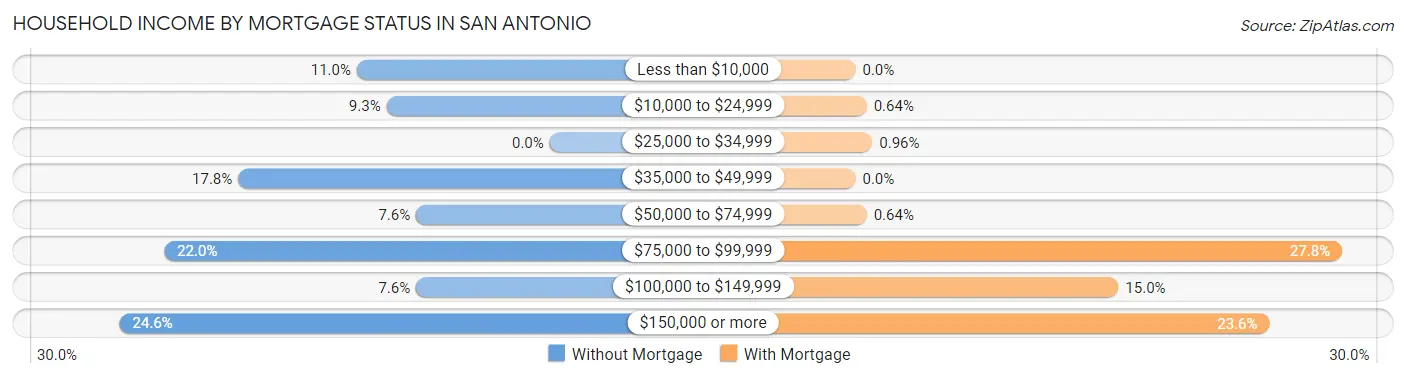
| Household Income | Without Mortgage | With Mortgage |
| Less than $10,000 | 13 (11.0%) | 0 (0.0%) |
| $10,000 to $24,999 | 11 (9.3%) | 2 (0.6%) |
| $25,000 to $34,999 | 0 (0.0%) | 3 (1.0%) |
| $35,000 to $49,999 | 21 (17.8%) | 0 (0.0%) |
| $50,000 to $74,999 | 9 (7.6%) | 2 (0.6%) |
| $75,000 to $99,999 | 26 (22.0%) | 87 (27.8%) |
| $100,000 to $149,999 | 9 (7.6%) | 47 (15.0%) |
| $150,000 or more | 29 (24.6%) | 74 (23.6%) |
| Total | 118 (100.0%) | 313 (100.0%) |
Property Value to Household Income Ratio in San Antonio
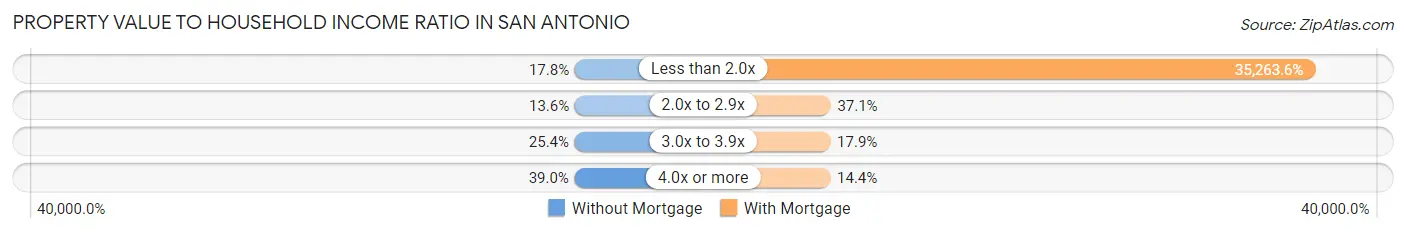
| Value-to-Income Ratio | Without Mortgage | With Mortgage |
| Less than 2.0x | 21 (17.8%) | 110,375 (35,263.6%) |
| 2.0x to 2.9x | 16 (13.6%) | 116 (37.1%) |
| 3.0x to 3.9x | 30 (25.4%) | 56 (17.9%) |
| 4.0x or more | 46 (39.0%) | 45 (14.4%) |
| Total | 118 (100.0%) | 313 (100.0%) |
Real Estate Taxes by Mortgage Status in San Antonio
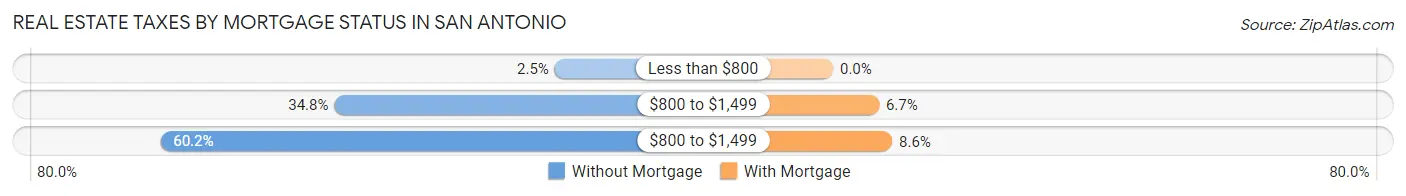
| Property Taxes | Without Mortgage | With Mortgage |
| Less than $800 | 3 (2.5%) | 0 (0.0%) |
| $800 to $1,499 | 41 (34.7%) | 21 (6.7%) |
| $800 to $1,499 | 71 (60.2%) | 27 (8.6%) |
| Total | 118 (100.0%) | 313 (100.0%) |
Health & Disability in San Antonio
Health Insurance Coverage by Age in San Antonio
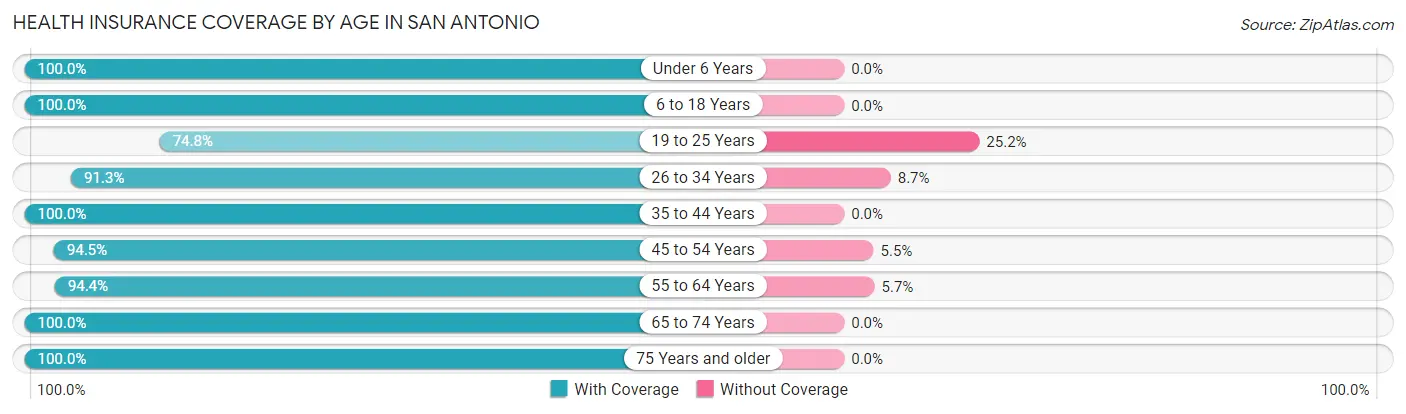
| Age Bracket | With Coverage | Without Coverage |
| Under 6 Years | 87 (100.0%) | 0 (0.0%) |
| 6 to 18 Years | 252 (100.0%) | 0 (0.0%) |
| 19 to 25 Years | 95 (74.8%) | 32 (25.2%) |
| 26 to 34 Years | 158 (91.3%) | 15 (8.7%) |
| 35 to 44 Years | 129 (100.0%) | 0 (0.0%) |
| 45 to 54 Years | 225 (94.5%) | 13 (5.5%) |
| 55 to 64 Years | 167 (94.4%) | 10 (5.7%) |
| 65 to 74 Years | 92 (100.0%) | 0 (0.0%) |
| 75 Years and older | 100 (100.0%) | 0 (0.0%) |
| Total | 1,305 (94.9%) | 70 (5.1%) |
Health Insurance Coverage by Citizenship Status in San Antonio
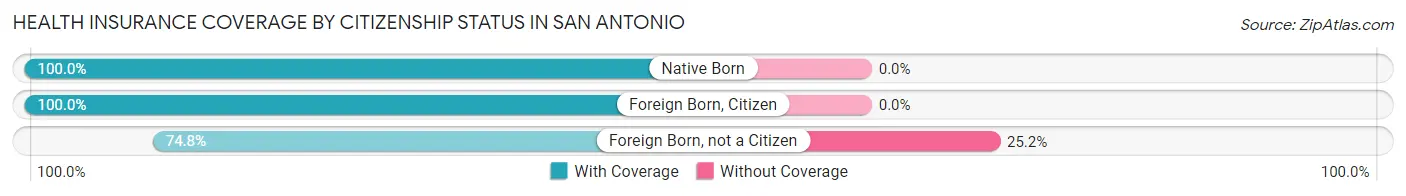
| Citizenship Status | With Coverage | Without Coverage |
| Native Born | 87 (100.0%) | 0 (0.0%) |
| Foreign Born, Citizen | 252 (100.0%) | 0 (0.0%) |
| Foreign Born, not a Citizen | 95 (74.8%) | 32 (25.2%) |
Health Insurance Coverage by Household Income in San Antonio
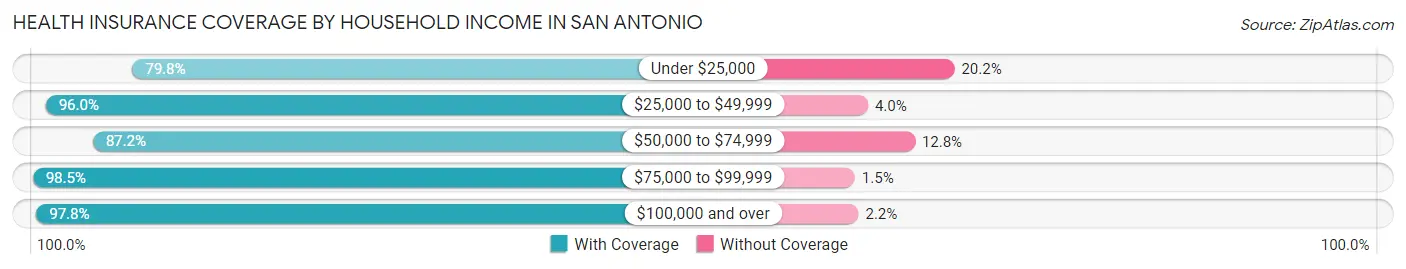
| Household Income | With Coverage | Without Coverage |
| Under $25,000 | 87 (79.8%) | 22 (20.2%) |
| $25,000 to $49,999 | 97 (96.0%) | 4 (4.0%) |
| $50,000 to $74,999 | 164 (87.2%) | 24 (12.8%) |
| $75,000 to $99,999 | 195 (98.5%) | 3 (1.5%) |
| $100,000 and over | 757 (97.8%) | 17 (2.2%) |
Public vs Private Health Insurance Coverage by Age in San Antonio
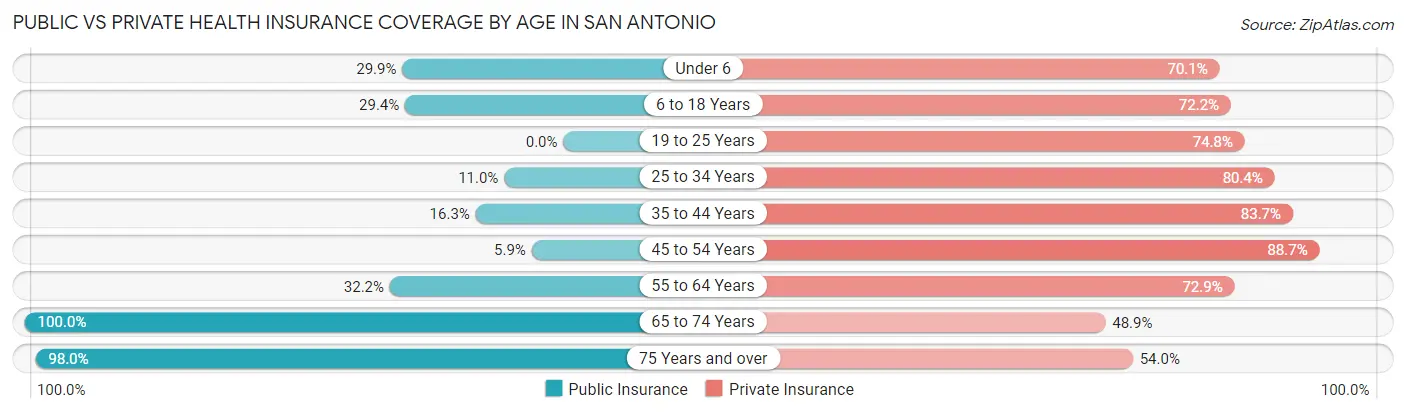
| Age Bracket | Public Insurance | Private Insurance |
| Under 6 | 26 (29.9%) | 61 (70.1%) |
| 6 to 18 Years | 74 (29.4%) | 182 (72.2%) |
| 19 to 25 Years | 0 (0.0%) | 95 (74.8%) |
| 25 to 34 Years | 19 (11.0%) | 139 (80.3%) |
| 35 to 44 Years | 21 (16.3%) | 108 (83.7%) |
| 45 to 54 Years | 14 (5.9%) | 211 (88.7%) |
| 55 to 64 Years | 57 (32.2%) | 129 (72.9%) |
| 65 to 74 Years | 92 (100.0%) | 45 (48.9%) |
| 75 Years and over | 98 (98.0%) | 54 (54.0%) |
| Total | 401 (29.2%) | 1,024 (74.5%) |
Disability Status by Sex by Age in San Antonio
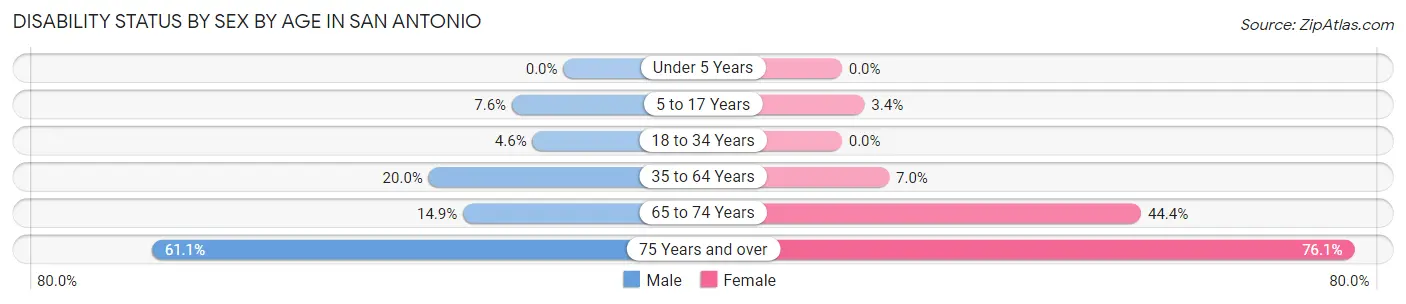
| Age Bracket | Male | Female |
| Under 5 Years | 0 (0.0%) | 0 (0.0%) |
| 5 to 17 Years | 11 (7.6%) | 4 (3.4%) |
| 18 to 34 Years | 7 (4.6%) | 0 (0.0%) |
| 35 to 64 Years | 49 (20.0%) | 21 (7.0%) |
| 65 to 74 Years | 7 (14.9%) | 20 (44.4%) |
| 75 Years and over | 33 (61.1%) | 35 (76.1%) |
Disability Class by Sex by Age in San Antonio
Disability Class: Hearing Difficulty
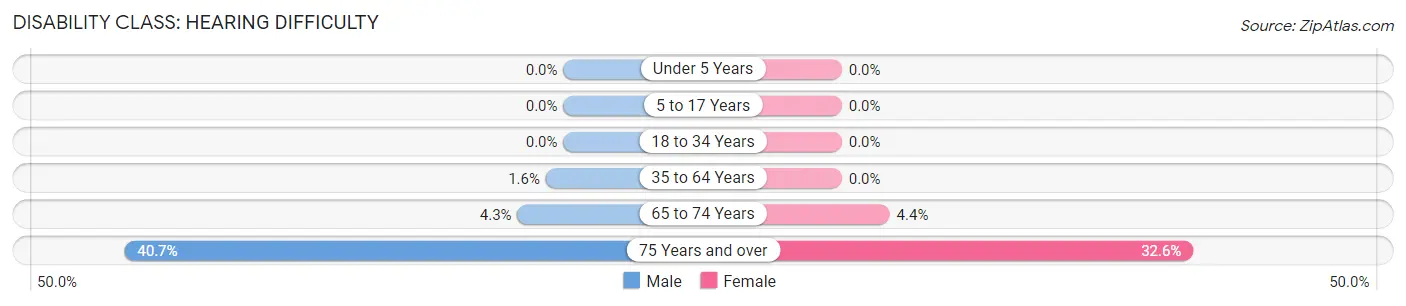
| Age Bracket | Male | Female |
| Under 5 Years | 0 (0.0%) | 0 (0.0%) |
| 5 to 17 Years | 0 (0.0%) | 0 (0.0%) |
| 18 to 34 Years | 0 (0.0%) | 0 (0.0%) |
| 35 to 64 Years | 4 (1.6%) | 0 (0.0%) |
| 65 to 74 Years | 2 (4.3%) | 2 (4.4%) |
| 75 Years and over | 22 (40.7%) | 15 (32.6%) |
Disability Class: Vision Difficulty
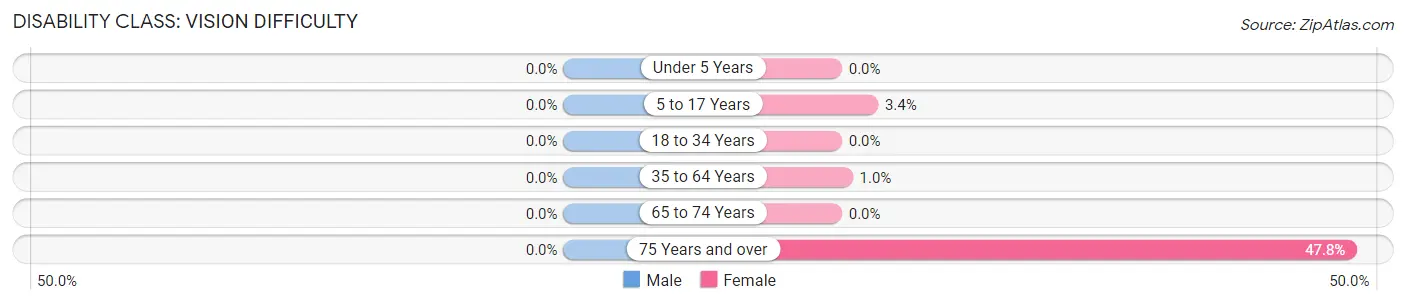
| Age Bracket | Male | Female |
| Under 5 Years | 0 (0.0%) | 0 (0.0%) |
| 5 to 17 Years | 0 (0.0%) | 4 (3.4%) |
| 18 to 34 Years | 0 (0.0%) | 0 (0.0%) |
| 35 to 64 Years | 0 (0.0%) | 3 (1.0%) |
| 65 to 74 Years | 0 (0.0%) | 0 (0.0%) |
| 75 Years and over | 0 (0.0%) | 22 (47.8%) |
Disability Class: Cognitive Difficulty
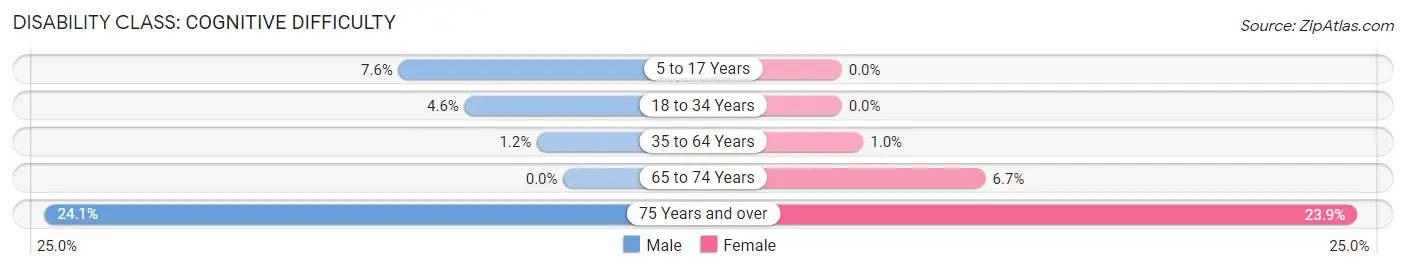
| Age Bracket | Male | Female |
| 5 to 17 Years | 11 (7.6%) | 0 (0.0%) |
| 18 to 34 Years | 7 (4.6%) | 0 (0.0%) |
| 35 to 64 Years | 3 (1.2%) | 3 (1.0%) |
| 65 to 74 Years | 0 (0.0%) | 3 (6.7%) |
| 75 Years and over | 13 (24.1%) | 11 (23.9%) |
Disability Class: Ambulatory Difficulty
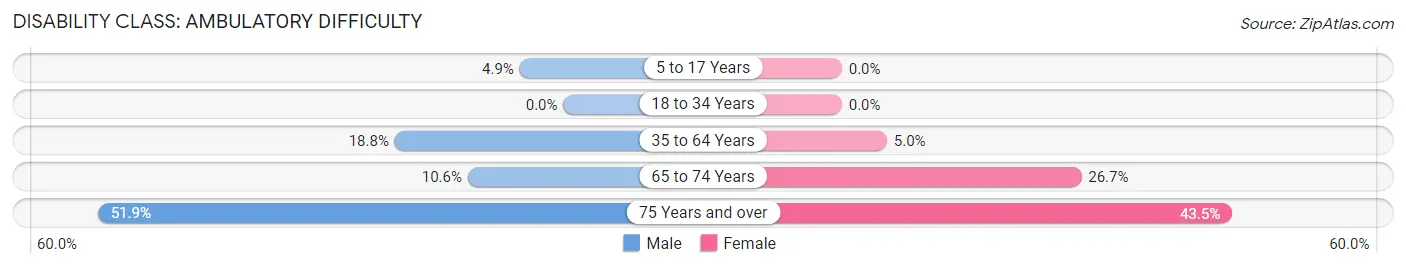
| Age Bracket | Male | Female |
| 5 to 17 Years | 7 (4.9%) | 0 (0.0%) |
| 18 to 34 Years | 0 (0.0%) | 0 (0.0%) |
| 35 to 64 Years | 46 (18.8%) | 15 (5.0%) |
| 65 to 74 Years | 5 (10.6%) | 12 (26.7%) |
| 75 Years and over | 28 (51.8%) | 20 (43.5%) |
Disability Class: Self-Care Difficulty
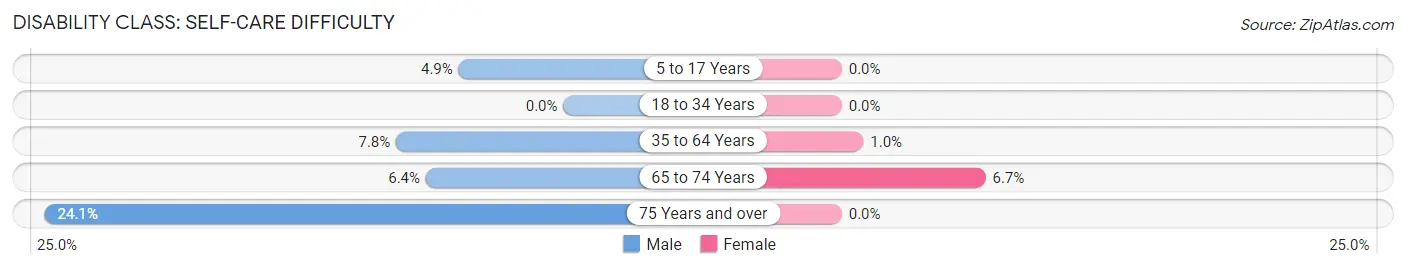
| Age Bracket | Male | Female |
| 5 to 17 Years | 7 (4.9%) | 0 (0.0%) |
| 18 to 34 Years | 0 (0.0%) | 0 (0.0%) |
| 35 to 64 Years | 19 (7.8%) | 3 (1.0%) |
| 65 to 74 Years | 3 (6.4%) | 3 (6.7%) |
| 75 Years and over | 13 (24.1%) | 0 (0.0%) |
Technology Access in San Antonio
Computing Device Access in San Antonio
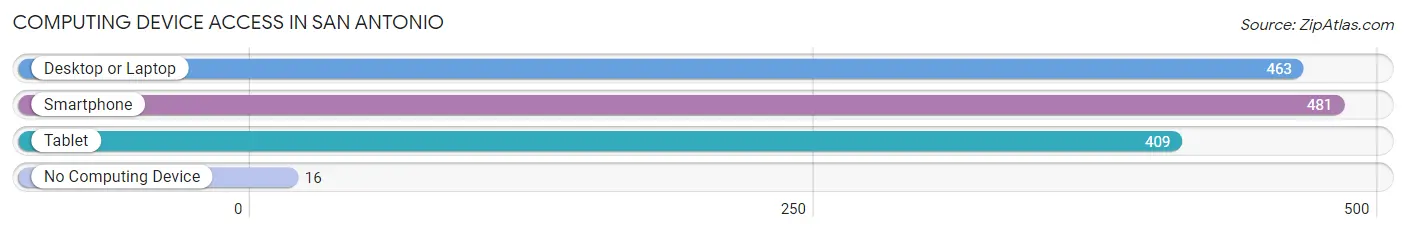
| Device Type | # Households | % Households |
| Desktop or Laptop | 463 | 90.8% |
| Smartphone | 481 | 94.3% |
| Tablet | 409 | 80.2% |
| No Computing Device | 16 | 3.1% |
| Total | 510 | 100.0% |
Internet Access in San Antonio
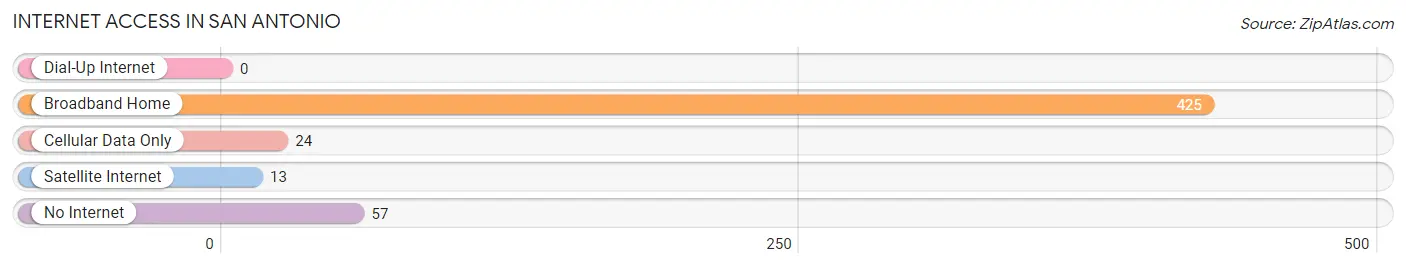
| Internet Type | # Households | % Households |
| Dial-Up Internet | 0 | 0.0% |
| Broadband Home | 425 | 83.3% |
| Cellular Data Only | 24 | 4.7% |
| Satellite Internet | 13 | 2.5% |
| No Internet | 57 | 11.2% |
| Total | 510 | 100.0% |
San Antonio Summary
San Antonio is a small town located in Pasco County, Florida. It is situated on the banks of the Anclote River, about 25 miles north of Tampa. The town was founded in 1887 by a group of settlers from San Antonio, Texas, and was named after the city in Texas. The town has a population of about 2,000 people and is known for its small-town charm and rural atmosphere.
History
San Antonio was founded in 1887 by a group of settlers from San Antonio, Texas. The settlers were looking for a place to settle and start a new life. They chose the area because of its proximity to the Anclote River, which provided a source of water for the settlers. The town was named after the city in Texas and was incorporated in 1891.
The town grew slowly over the years, but it was not until the 1950s that it began to experience significant growth. This was due to the development of the nearby Suncoast Parkway, which provided easy access to Tampa and other nearby cities. The town also benefited from the growth of the citrus industry in the area, which provided jobs and economic opportunities for the residents.
Geography
San Antonio is located in Pasco County, Florida, about 25 miles north of Tampa. The town is situated on the banks of the Anclote River, which provides a source of water for the town. The town is surrounded by rolling hills and is home to several parks and nature preserves. The town is also home to several lakes, including Lake Jovita, Lake Padgett, and Lake Thomas.
Economy
San Antonio’s economy is largely based on agriculture and tourism. The town is home to several citrus groves, which provide jobs and economic opportunities for the residents. The town is also home to several tourist attractions, including the Anclote River Park, which offers fishing, boating, and other recreational activities. The town is also home to several restaurants, shops, and other businesses.
Demographics
As of the 2010 census, San Antonio had a population of 2,000 people. The population is largely white (90.2%), with a small Hispanic population (7.2%). The median household income is $41,250, and the median age is 44. The town is home to several churches, including the First Baptist Church of San Antonio.
San Antonio is a small town with a rich history and a unique atmosphere. It is a great place to live and work, and it offers a variety of activities and attractions for visitors and residents alike. The town is home to several parks and nature preserves, and it is a great place to explore and enjoy the outdoors. The town is also home to several businesses and restaurants, and it is a great place to shop and dine. San Antonio is a great place to call home.
Common Questions
What is Per Capita Income in San Antonio?
Per Capita income in San Antonio is $41,363.
What is the Median Family Income in San Antonio?
Median Family Income in San Antonio is $101,250.
What is the Median Household income in San Antonio?
Median Household Income in San Antonio is $87,750.
What is Income or Wage Gap in San Antonio?
Income or Wage Gap in San Antonio is 10.8%.
Women in San Antonio earn 89.2 cents for every dollar earned by a man.
What is Inequality or Gini Index in San Antonio?
Inequality or Gini Index in San Antonio is 0.38.
What is the Total Population of San Antonio?
Total Population of San Antonio is 1,375.
What is the Total Male Population of San Antonio?
Total Male Population of San Antonio is 673.
What is the Total Female Population of San Antonio?
Total Female Population of San Antonio is 702.
What is the Ratio of Males per 100 Females in San Antonio?
There are 95.87 Males per 100 Females in San Antonio.
What is the Ratio of Females per 100 Males in San Antonio?
There are 104.31 Females per 100 Males in San Antonio.
What is the Median Population Age in San Antonio?
Median Population Age in San Antonio is 39.5 Years.
What is the Average Family Size in San Antonio
Average Family Size in San Antonio is 3.0 People.
What is the Average Household Size in San Antonio
Average Household Size in San Antonio is 2.7 People.
How Large is the Labor Force in San Antonio?
There are 686 People in the Labor Forcein in San Antonio.
What is the Percentage of People in the Labor Force in San Antonio?
62.8% of People are in the Labor Force in San Antonio.
What is the Unemployment Rate in San Antonio?
Unemployment Rate in San Antonio is 2.9%.