Zip Codes with the Highest Percentage of Unpaid Family Workers in Homestead, FL
On this page
RELATED REPORTS & OPTIONS
Unpaid Family Workers
Population
Highest PopulationHighest Population DensityLowest Population DensityMale / Female RatioFemale / Male RatioOldest PopulationOldest Population | MaleOldest Population | FemaleYoungest PopulationYoungest Population | MaleYoungest Population | Female
Families and Households
Largest Family SizeLargest Household SizeMost Single FathersMost Single MothersFewest Single FathersFewest Single MothersSmallest Family SizeSmallest Household Size
Female Fertility
Highest Birth Rate | All WomenHighest Birth Rate | Women 15-19Highest Birth Rate | Women 35+Highest Birth Rate | Below PovertyHighest Birth Rate | Public IncomeHighest Birth Rate | In Labor ForceLowest Birth Rate | All WomenLowest Birth Rate | Women 15-19Lowest Birth Rate | Women 35+Lowest Birth Rate | Below PovertyLowest Birth Rate | Public IncomeLowest Birth Rate | In Labor Force
Female Fertility (Unmarried)
Highest Illegitimacy | All WomenHighest Illegitimacy | Women 15-19Highest Illegitimacy | Women 35+Lowest Illegitimacy | All WomenLowest Illegitimacy | Women 15-19Lowest Illegitimacy | Women 35+
Race (Community Size)
Race (Percentage)
Ancestry (Community Size)
AfricanAmericanArabArgentineanBahamianBelizeanBhutaneseBlackfeetBolivianBrazilianBritishBritish West IndianBulgarianBurmeseCanadianCape VerdeanCentral AmericanCentral American IndianCherokeeChileanColombianCosta RicanCubanCzechDominicanDutchEastern EuropeanEcuadorianEnglishEuropeanFinnishFrenchFrench CanadianGermanGreekGuatemalanGuyaneseHaitianHonduranHungarianIndian (Asian)IrishItalianJamaicanJapaneseKoreanLebaneseLithuanianMalaysianMexicanMexican American IndianNicaraguanNigerianNorthern EuropeanNorwegianPanamanianPeruvianPolishPortuguesePuerto RicanRussianSalvadoranScandinavianScotch-IrishScottishSlavicSouth AmericanSouth American IndianSpaniardSpanishSri LankanSubsaharan AfricanSwedishSyrianThaiTrinidadian and TobagonianTurkishU.S. Virgin IslanderUruguayanVenezuelanVietnameseWelshWest Indian
Ancestry (Percentage)
AfricanAmericanArabArgentineanBahamianBelizeanBhutaneseBlackfeetBolivianBrazilianBritishBritish West IndianBulgarianBurmeseCanadianCape VerdeanCentral AmericanCentral American IndianCherokeeChileanColombianCosta RicanCubanCzechDominicanDutchEastern EuropeanEcuadorianEnglishEuropeanFinnishFrenchFrench CanadianGermanGreekGuatemalanGuyaneseHaitianHonduranHungarianIndian (Asian)IrishItalianJamaicanJapaneseKoreanLebaneseLithuanianMalaysianMexicanMexican American IndianNicaraguanNigerianNorthern EuropeanNorwegianPanamanianPeruvianPolishPortuguesePuerto RicanRussianSalvadoranScandinavianScotch-IrishScottishSlavicSouth AmericanSouth American IndianSpaniardSpanishSri LankanSubsaharan AfricanSwedishSyrianThaiTrinidadian and TobagonianTurkishU.S. Virgin IslanderUruguayanVenezuelanVietnameseWelshWest Indian
Immigrant Origin (Total)
AfricaArgentinaAsiaBahamasBangladeshBelizeBoliviaBrazilCambodiaCanadaCaribbeanCentral AmericaChileChinaColombiaCosta RicaCubaCzechoslovakiaDominican RepublicEastern AfricaEastern AsiaEastern EuropeEcuadorEl SalvadorEnglandEuropeGermanyGreeceGuatemalaGuyanaHaitiHondurasIndiaItalyJamaicaJapanLatin AmericaMexicoNetherlandsNicaraguaNigeriaNorthern EuropeOceaniaPakistanPanamaPeruPhilippinesPolandRussiaSouth AmericaSouth Central AsiaSouth Eastern AsiaSouthern EuropeSpainSt. Vincent and the GrenadinesTaiwanTrinidad and TobagoUruguayVenezuelaVietnamWestern AfricaWestern Europe
Immigrant Origin (Percentage)
AfricaArgentinaAsiaBahamasBangladeshBelizeBoliviaBrazilCambodiaCanadaCaribbeanCentral AmericaChileChinaColombiaCosta RicaCubaCzechoslovakiaDominican RepublicEastern AfricaEastern AsiaEastern EuropeEcuadorEl SalvadorEnglandEuropeGermanyGreeceGuatemalaGuyanaHaitiHondurasIndiaItalyJamaicaJapanLatin AmericaMexicoNetherlandsNicaraguaNigeriaNorthern EuropeOceaniaPakistanPanamaPeruPhilippinesPolandRussiaSouth AmericaSouth Central AsiaSouth Eastern AsiaSouthern EuropeSpainSt. Vincent and the GrenadinesTaiwanTrinidad and TobagoUruguayVenezuelaVietnamWestern AfricaWestern Europe
Income
Highest Per Capita IncomeHighest Earnings | MaleHighest Earnings | FemaleHighest Wage/Income Gap ($)Highest Wage/Income Gap (%)Highest Inequality / Gini IndexLowest Per Capita IncomeLowest Earnings | MaleLowest Earnings | FemaleLowest Wage/Income Gap ($)Lowest Wage/Income Gap (%)Lowest Inequality / Gini Index
Income (Families)
Highest Family IncomeLowest Family IncomeFamily Income | $0-10kFamily Income | $100k+Family Income | $200k+
Income (Households)
Highest Household IncomeLowest Household IncomeHousehold Income | $0-10kHousehold Income | $200k+Household Income | $100k+
Poverty
Highest PovertyHighest Poverty | MaleHighest Poverty | FemaleHighest Poverty | Female 18-24Highest Poverty | Female 25-34Highest Poverty | Child 0-5Highest Poverty | Child 0-16Highest Poverty | Boys 0-16Highest Poverty | Girls 0-16Highest Poverty | Seniors 65+Highest Poverty | Seniors 75+ Lowest PovertyLowest Poverty | MaleLowest Poverty | FemaleLowest Poverty | Child 0-5Lowest Poverty | Child 0-16Lowest Poverty | Boys 0-16Lowest Poverty | Girls 0-16Lowest Poverty | Seniors 65+Lowest Poverty | Seniors 75+
Poverty (Families)
Highest Family PovertyHighest Poverty | Married CoupleHighest Poverty | Single MaleHighest Poverty | Single FemaleHighest Poverty | Single FatherHighest Poverty | Single MotherLowest Family PovertyLowest Poverty | Married CoupleLowest Poverty | Single MaleLowest Poverty | Single FemaleLowest Poverty | Single FatherLowest Poverty | Single Mother
Unemployment
Highest UnemploymentHighest Unemployment | MaleHighest Unemployment | FemaleHighest Unemployment | Youth < 25Highest Unemployment | Senior > 65Lowest UnemploymentLowest Unemployment | MaleLowest Unemployment | FemaleLowest Unemployment | Youth < 25Lowest Unemployment | Senior > 65
Employment Occupations
Architecture & EngineeringArts, Media & EntertainmentBusiness & FinancialCleaning & MaintenanceCommunity & Social Service Computer & MathematicsComputer, Engineering & ScienceConstruction & ExtractionEducation Instruction & LibraryEducation, Arts & MediaFarming, Fishing & ForestryFirefighting & PreventionFood Preparation & ServingHealth Diagnosing & TreatingHealth TechnologistsHealthcare SupportInstallation, Maintenance & RepairLaw EnforcementLegal Services & SupportLife, Physical & Social ScienceManagementMaterial MovingOffice & AdministrationPersonal Care and ServiceProductionSales & RelatedSecurity & ProtectionTransportation
Employment Industries
Accommodation & Food ServicesAdministrative & Support ServicesAgriculture, Fishing & HuntingArts, Entertainment & RecreationConstructionEducational ServicesFinance & InsuranceHealth Care & Social AssistanceInformation & TechnologyManufacturingMining, Quarrying, & ExtractionProfessional & Scientific ServicesPublic AdministrationReal Estate, Rental & LeasingRetail TradeTransportation & WarehousingUtilitiesWholesale Trade
Employer Class
Private Company EmployeesSelf-Employed / IncorporatedSelf-Employed / Not IncorporatedNot-for-profit OrganizationsLocal Government EmployeesState Government EmployeesFederal Government EmployeesUnpaid Family Workers
Commute Time
Longest CommuteLongest Commute | MaleLongest Commute | FemaleShortest CommuteShortest Commute | MaleShortest Commute | Female
Commute Means
School Enrollment
In Private SchoolNursery / PreschoolKindergartenElementary SchoolMiddle SchoolHigh SchoolCollegeUniversity
Education by Degree Field
Computers and MathematicsBio, Nature & AgriculturalPhysical and Health SciencesPsychologySocial SciencesEngineeringMultidisciplinary StudiesScience and EngineeringBusinessEducationLiterature and LanguagesLiberal Arts and HistoryVisual and Performing ArtsCommunicationsArts and Humanities
Occupancy
Finances
Highest Median Housing CostsHighest Property PricesHighest Owner Housing CostsHighest Renter Housing CostsHighest Housing Costs / IncomeLowest Median Housing CostsLowest Property PricesLowest Owner Housing CostsLowest Renter Housing CostsLowest Housing Costs / Income
Physical Characteristics
Homestead
States
AlabamaAlaskaArizonaArkansasCaliforniaColoradoConnecticutDelawareDistrict Of ColumbiaFloridaGeorgiaHawaiiIdahoIllinoisIndianaIowaKansasKentuckyLouisianaMaineMarylandMassachusettsMichiganMinnesotaMississippiMissouriMontanaNebraskaNevadaNew HampshireNew JerseyNew MexicoNew YorkNorth CarolinaNorth DakotaOhioOklahomaOregonPennsylvaniaPuerto RicoRhode IslandSouth CarolinaSouth DakotaTennesseeTexasUtahVermontVirginiaWashingtonWest VirginiaWisconsinWyoming
Florida Cities
ApopkaArcadiaBoca RatonBoynton BeachBradentonBrooksvilleCape CoralClearwaterCoral SpringsDade CityDavenportDaytona BeachDeerfield BeachDelandDelray BeachDeltonaDunnellonEustisFort LauderdaleFort MyersFort PierceGainesvilleGulf BreezeHialeahHolidayHollywoodHomesteadHudsonInvernessJacksonvilleJupiterKissimmeeLake CityLake WalesLake WorthLakelandLand O LakesLargoLeesburgLehigh AcresLongwoodLutzMelbourneMiamiMiami BeachNaplesNew Port RicheyNorth PortOcalaOpa LockaOrlandoPalm BayPalm Beach GardensPalm HarborPanama CityPanama City BeachPensacolaPinellas ParkPlant CityPompano BeachPort CharlottePort OrangePort Saint LuciePunta GordaSaint AugustineSaint CloudSaint PetersburgSanfordSarasotaSebastianSeminoleSpring HillStuartTallahasseeTampaVeniceVero BeachWesley ChapelWest Palm BeachWinter HavenWinter Park
Compare Zip Codes
Comparison Subject
Compare StatesCompare CitiesCompare Zip Codes
Map of Zip Codes with the Highest Percentage of Unpaid Family Workers in Homestead
0.18%
0.55%
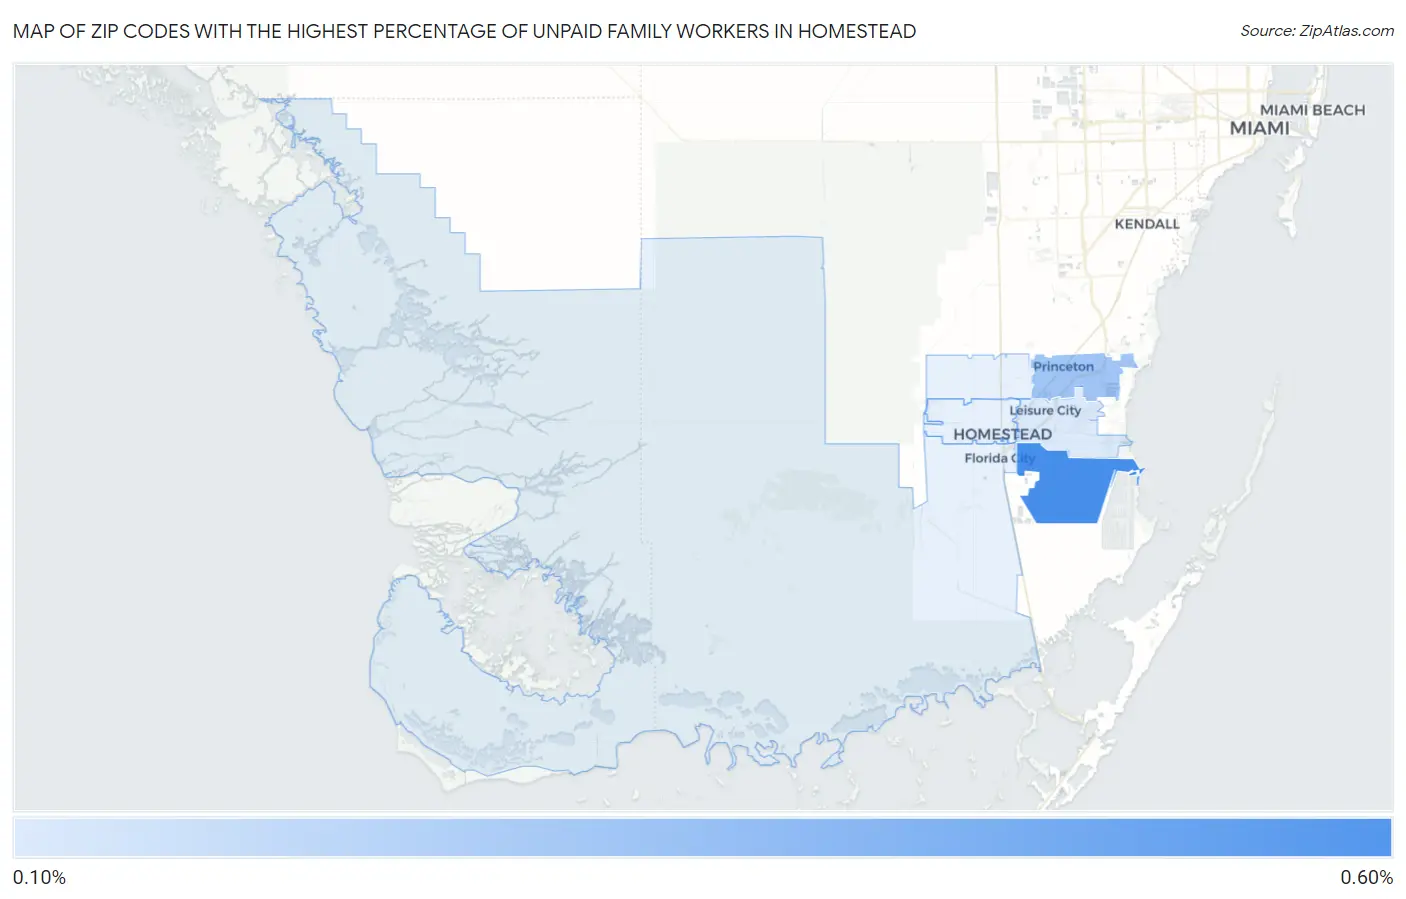
Zip Codes with the Highest Percentage of Unpaid Family Workers in Homestead, FL
| Zip Code | % Unpaid Family Workers | vs State | vs National | |
| 1. | 33035 | 0.55% | 0.20%(+0.351)#92 | 0.19%(+0.366)#3,530 |
| 2. | 33032 | 0.33% | 0.20%(+0.126)#201 | 0.19%(+0.142)#5,520 |
| 3. | 33033 | 0.18% | 0.20%(-0.025)#326 | 0.19%(-0.010)#8,066 |
1
Common Questions
What are the Top 5 Zip Codes with the Highest Percentage of Unpaid Family Workers in Homestead, FL?
Top 5 Zip Codes with the Highest Percentage of Unpaid Family Workers in Homestead, FL are:
What zip code has the Highest Percentage of Unpaid Family Workers in Homestead, FL?
33035 has the Highest Percentage of Unpaid Family Workers in Homestead, FL with 0.55%.
What is the Percentage of Unpaid Family Workers in Homestead, FL?
Percentage of Unpaid Family Workers in Homestead is 0.13%.
What is the Percentage of Unpaid Family Workers in Florida?
Percentage of Unpaid Family Workers in Florida is 0.20%.
What is the Percentage of Unpaid Family Workers in the United States?
Percentage of Unpaid Family Workers in the United States is 0.19%.