Charlotte Harbor, FL Map & Demographics
Charlotte Harbor Map
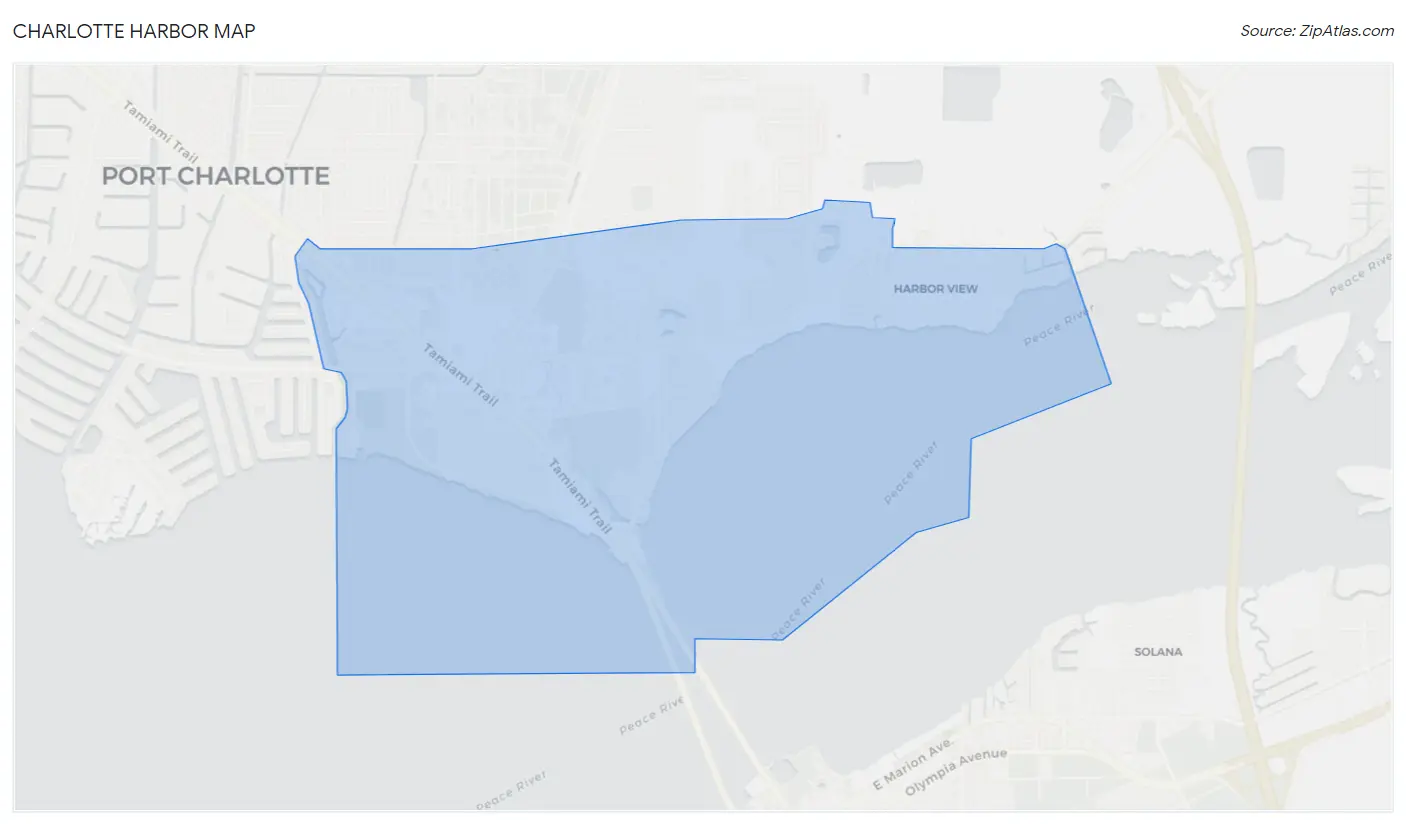
Charlotte Harbor Overview
$29,174
PER CAPITA INCOME
$55,484
AVG FAMILY INCOME
$38,951
AVG HOUSEHOLD INCOME
6.9%
WAGE / INCOME GAP [ % ]
93.1¢/ $1
WAGE / INCOME GAP [ $ ]
0.44
INEQUALITY / GINI INDEX
4,516
TOTAL POPULATION
2,111
MALE POPULATION
2,405
FEMALE POPULATION
87.78
MALES / 100 FEMALES
113.93
FEMALES / 100 MALES
67.4
MEDIAN AGE
2.5
AVG FAMILY SIZE
1.8
AVG HOUSEHOLD SIZE
1,172
LABOR FORCE [ PEOPLE ]
29.3%
PERCENT IN LABOR FORCE
2.6%
UNEMPLOYMENT RATE
Income in Charlotte Harbor
Income Overview in Charlotte Harbor
Per Capita Income in Charlotte Harbor is $29,174, while median incomes of families and households are $55,484 and $38,951 respectively.
| Characteristic | Number | Measure |
| Per Capita Income | 4,516 | $29,174 |
| Median Family Income | 1,040 | $55,484 |
| Mean Family Income | 1,040 | $68,044 |
| Median Household Income | 2,123 | $38,951 |
| Mean Household Income | 2,123 | $54,887 |
| Income Deficit | 1,040 | $0 |
| Wage / Income Gap (%) | 4,516 | 6.95% |
| Wage / Income Gap ($) | 4,516 | 93.05¢ per $1 |
| Gini / Inequality Index | 4,516 | 0.44 |
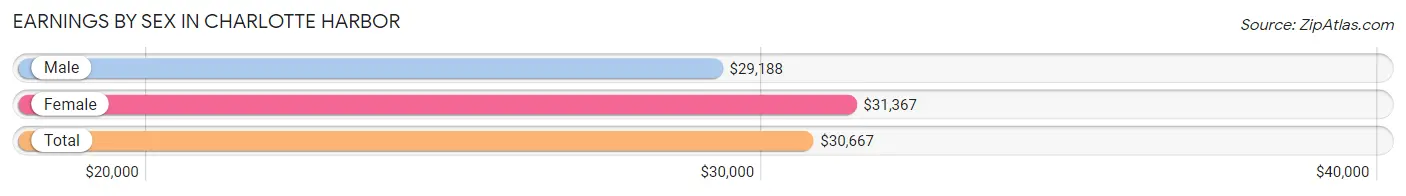
Earnings by Sex in Charlotte Harbor
Average Earnings in Charlotte Harbor are $30,667, $29,188 for men and $31,367 for women, a difference of 7.0%.
| Sex | Number | Average Earnings |
| Male | 610 (48.3%) | $29,188 |
| Female | 652 (51.7%) | $31,367 |
| Total | 1,262 (100.0%) | $30,667 |
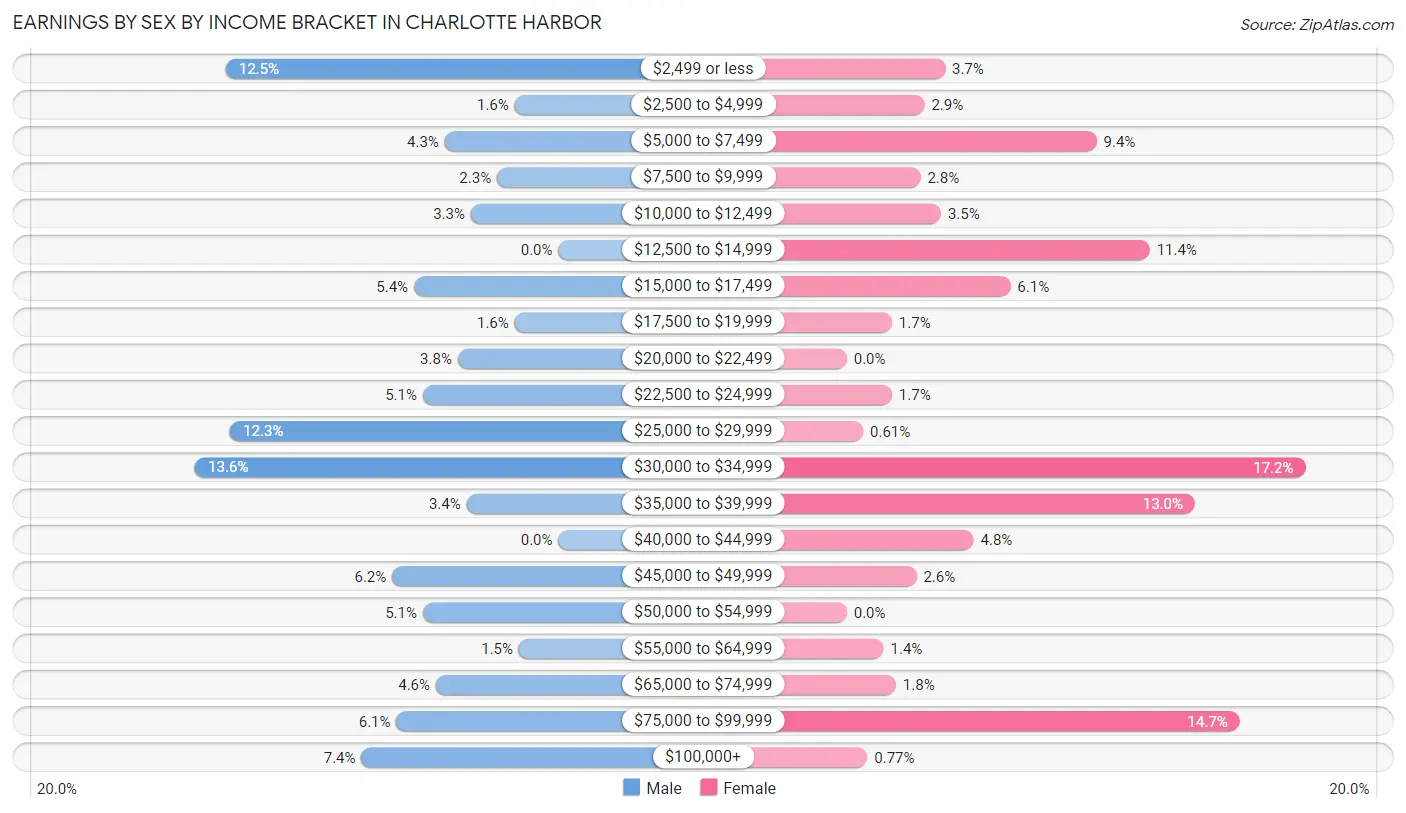
Earnings by Sex by Income Bracket in Charlotte Harbor
The most common earnings brackets in Charlotte Harbor are $30,000 to $34,999 for men (83 | 13.6%) and $30,000 to $34,999 for women (112 | 17.2%).
| Income | Male | Female |
| $2,499 or less | 76 (12.5%) | 24 (3.7%) |
| $2,500 to $4,999 | 10 (1.6%) | 19 (2.9%) |
| $5,000 to $7,499 | 26 (4.3%) | 61 (9.4%) |
| $7,500 to $9,999 | 14 (2.3%) | 18 (2.8%) |
| $10,000 to $12,499 | 20 (3.3%) | 23 (3.5%) |
| $12,500 to $14,999 | 0 (0.0%) | 74 (11.4%) |
| $15,000 to $17,499 | 33 (5.4%) | 40 (6.1%) |
| $17,500 to $19,999 | 10 (1.6%) | 11 (1.7%) |
| $20,000 to $22,499 | 23 (3.8%) | 0 (0.0%) |
| $22,500 to $24,999 | 31 (5.1%) | 11 (1.7%) |
| $25,000 to $29,999 | 75 (12.3%) | 4 (0.6%) |
| $30,000 to $34,999 | 83 (13.6%) | 112 (17.2%) |
| $35,000 to $39,999 | 21 (3.4%) | 85 (13.0%) |
| $40,000 to $44,999 | 0 (0.0%) | 31 (4.8%) |
| $45,000 to $49,999 | 38 (6.2%) | 17 (2.6%) |
| $50,000 to $54,999 | 31 (5.1%) | 0 (0.0%) |
| $55,000 to $64,999 | 9 (1.5%) | 9 (1.4%) |
| $65,000 to $74,999 | 28 (4.6%) | 12 (1.8%) |
| $75,000 to $99,999 | 37 (6.1%) | 96 (14.7%) |
| $100,000+ | 45 (7.4%) | 5 (0.8%) |
| Total | 610 (100.0%) | 652 (100.0%) |
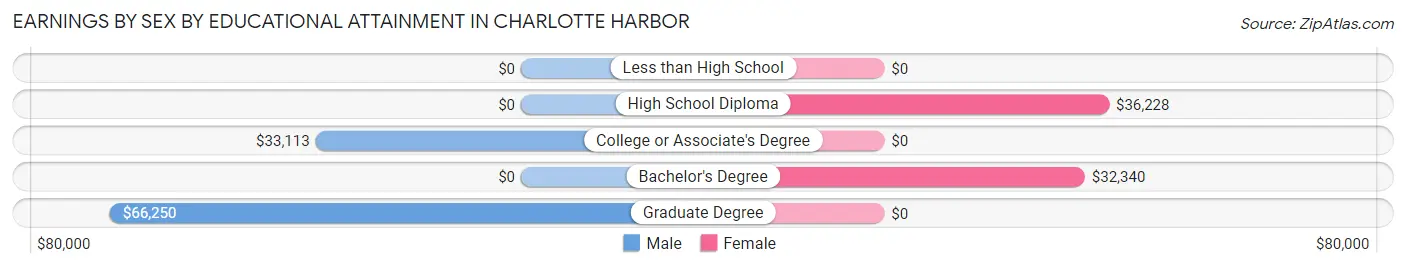
Earnings by Sex by Educational Attainment in Charlotte Harbor
Average earnings in Charlotte Harbor are $30,500 for men and $31,450 for women, a difference of 3.0%. Men with an educational attainment of graduate degree enjoy the highest average annual earnings of $66,250, while those with college or associate's degree education earn the least with $33,113. Women with an educational attainment of high school diploma earn the most with the average annual earnings of $36,228, while those with bachelor's degree education have the smallest earnings of $32,340.
| Educational Attainment | Male Income | Female Income |
| Less than High School | - | - |
| High School Diploma | - | - |
| College or Associate's Degree | $33,113 | $0 |
| Bachelor's Degree | - | - |
| Graduate Degree | $66,250 | $0 |
| Total | $30,500 | $31,450 |
Family Income in Charlotte Harbor
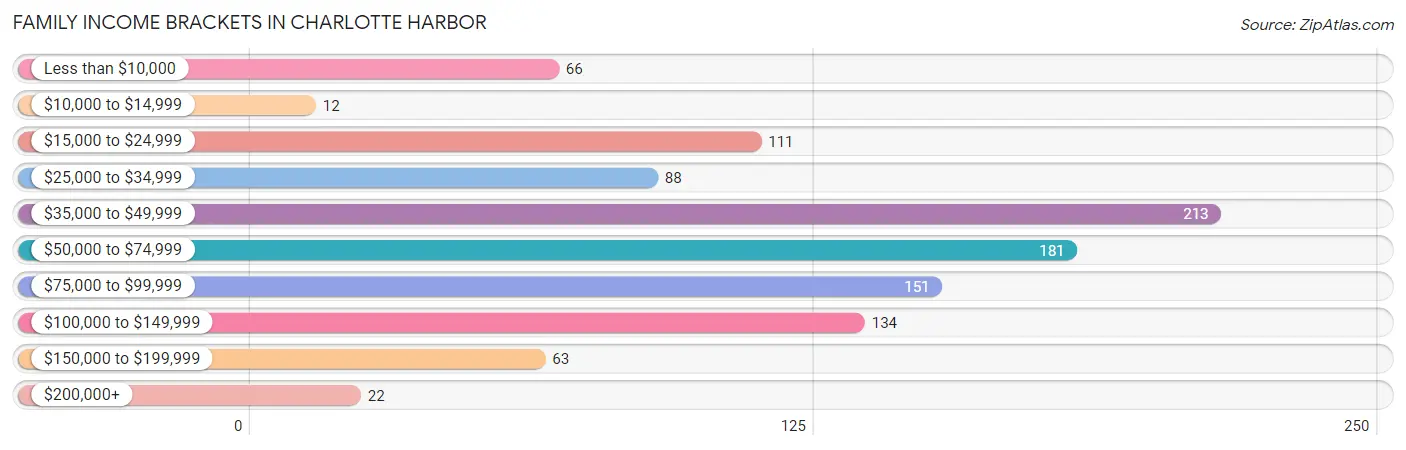
Family Income Brackets in Charlotte Harbor
According to the Charlotte Harbor family income data, there are 213 families falling into the $35,000 to $49,999 income range, which is the most common income bracket and makes up 20.5% of all families. Conversely, the $10,000 to $14,999 income bracket is the least frequent group with only 12 families (1.1%) belonging to this category.
| Income Bracket | # Families | % Families |
| Less than $10,000 | 66 | 6.3% |
| $10,000 to $14,999 | 12 | 1.2% |
| $15,000 to $24,999 | 111 | 10.7% |
| $25,000 to $34,999 | 88 | 8.5% |
| $35,000 to $49,999 | 213 | 20.5% |
| $50,000 to $74,999 | 181 | 17.4% |
| $75,000 to $99,999 | 151 | 14.5% |
| $100,000 to $149,999 | 134 | 12.9% |
| $150,000 to $199,999 | 63 | 6.1% |
| $200,000+ | 22 | 2.1% |
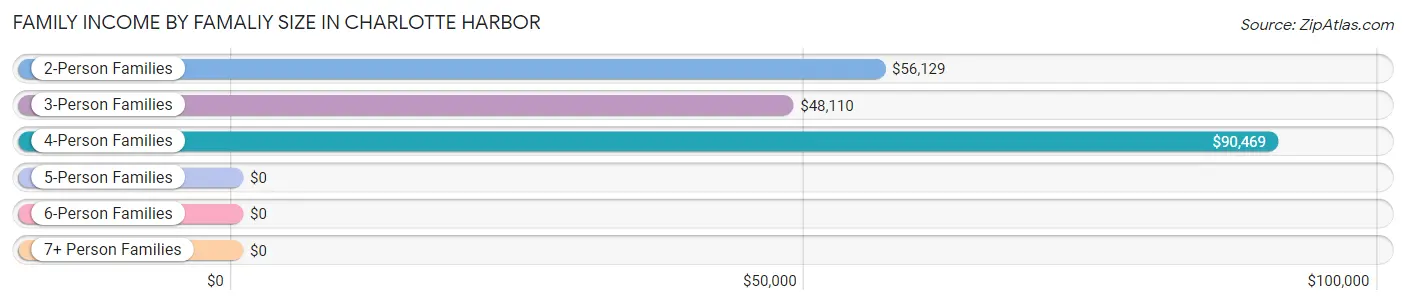
Family Income by Famaliy Size in Charlotte Harbor
4-person families (69 | 6.6%) account for the highest median family income in Charlotte Harbor with $90,469 per family, while 2-person families (670 | 64.4%) have the highest median income of $28,064 per family member.
| Income Bracket | # Families | Median Income |
| 2-Person Families | 670 (64.4%) | $56,129 |
| 3-Person Families | 286 (27.5%) | $48,110 |
| 4-Person Families | 69 (6.6%) | $90,469 |
| 5-Person Families | 15 (1.4%) | $0 |
| 6-Person Families | 0 (0.0%) | $0 |
| 7+ Person Families | 0 (0.0%) | $0 |
| Total | 1,040 (100.0%) | $55,484 |
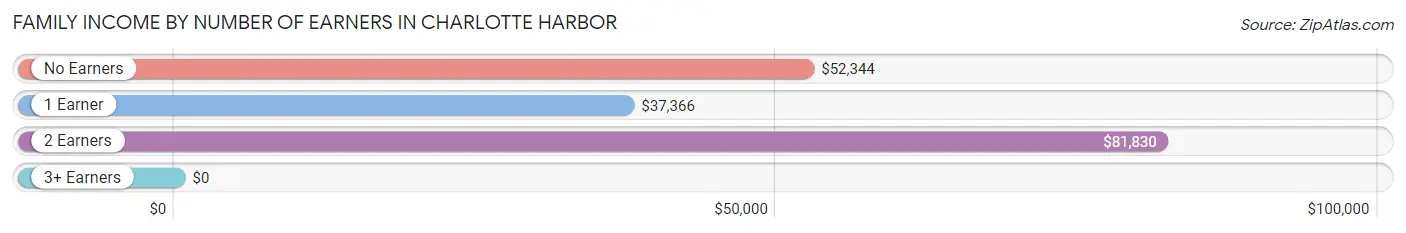
Family Income by Number of Earners in Charlotte Harbor
| Number of Earners | # Families | Median Income |
| No Earners | 493 (47.4%) | $52,344 |
| 1 Earner | 364 (35.0%) | $37,366 |
| 2 Earners | 168 (16.2%) | $81,830 |
| 3+ Earners | 15 (1.4%) | $0 |
| Total | 1,040 (100.0%) | $55,484 |
Household Income in Charlotte Harbor
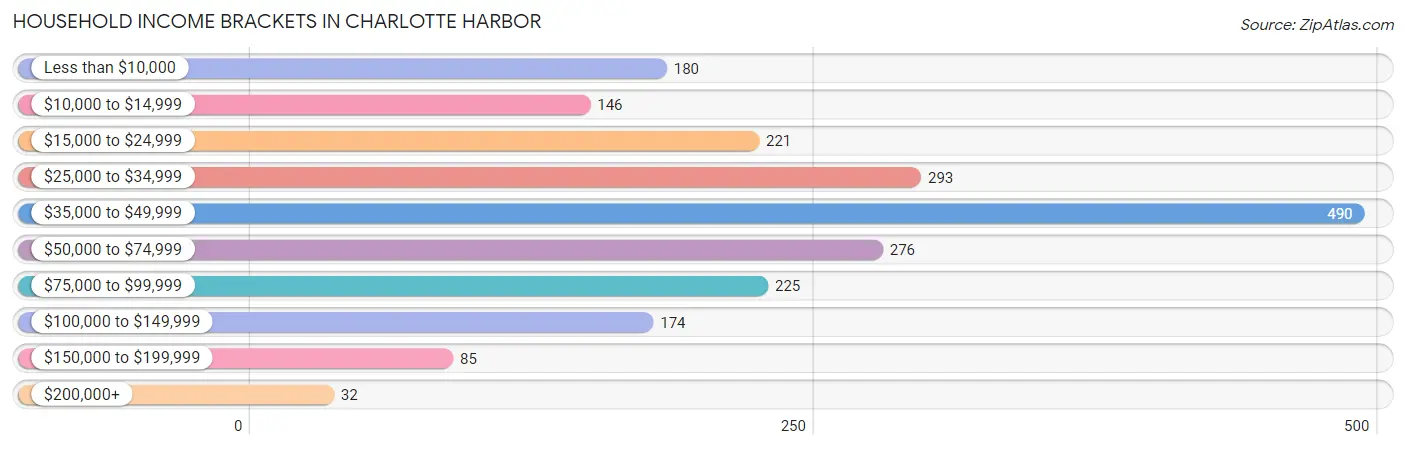
Household Income Brackets in Charlotte Harbor
With 490 households falling in the category, the $35,000 to $49,999 income range is the most frequent in Charlotte Harbor, accounting for 23.1% of all households. In contrast, only 32 households (1.5%) fall into the $200,000+ income bracket, making it the least populous group.
| Income Bracket | # Households | % Households |
| Less than $10,000 | 180 | 8.5% |
| $10,000 to $14,999 | 146 | 6.9% |
| $15,000 to $24,999 | 221 | 10.4% |
| $25,000 to $34,999 | 293 | 13.8% |
| $35,000 to $49,999 | 490 | 23.1% |
| $50,000 to $74,999 | 276 | 13.0% |
| $75,000 to $99,999 | 225 | 10.6% |
| $100,000 to $149,999 | 174 | 8.2% |
| $150,000 to $199,999 | 85 | 4.0% |
| $200,000+ | 32 | 1.5% |
Household Income by Householder Age in Charlotte Harbor
The median household income in Charlotte Harbor is $38,951, with the highest median household income of $40,568 found in the 45 to 64 years age bracket for the primary householder. A total of 413 households (19.5%) fall into this category. Meanwhile, the 15 to 24 years age bracket for the primary householder has the lowest median household income of $26,513, with 85 households (4.0%) in this group.
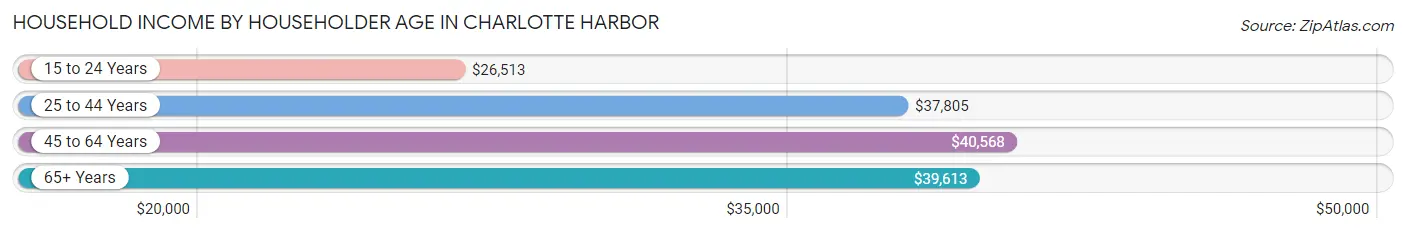
| Income Bracket | # Households | Median Income |
| 15 to 24 Years | 85 (4.0%) | $26,513 |
| 25 to 44 Years | 310 (14.6%) | $37,805 |
| 45 to 64 Years | 413 (19.5%) | $40,568 |
| 65+ Years | 1,315 (61.9%) | $39,613 |
| Total | 2,123 (100.0%) | $38,951 |
Poverty in Charlotte Harbor
Income Below Poverty by Sex and Age in Charlotte Harbor
With 21.8% poverty level for males and 19.5% for females among the residents of Charlotte Harbor, 15 year old males and 16 and 17 year old females are the most vulnerable to poverty, with 5 males (100.0%) and 1 females (100.0%) in their respective age groups living below the poverty level.
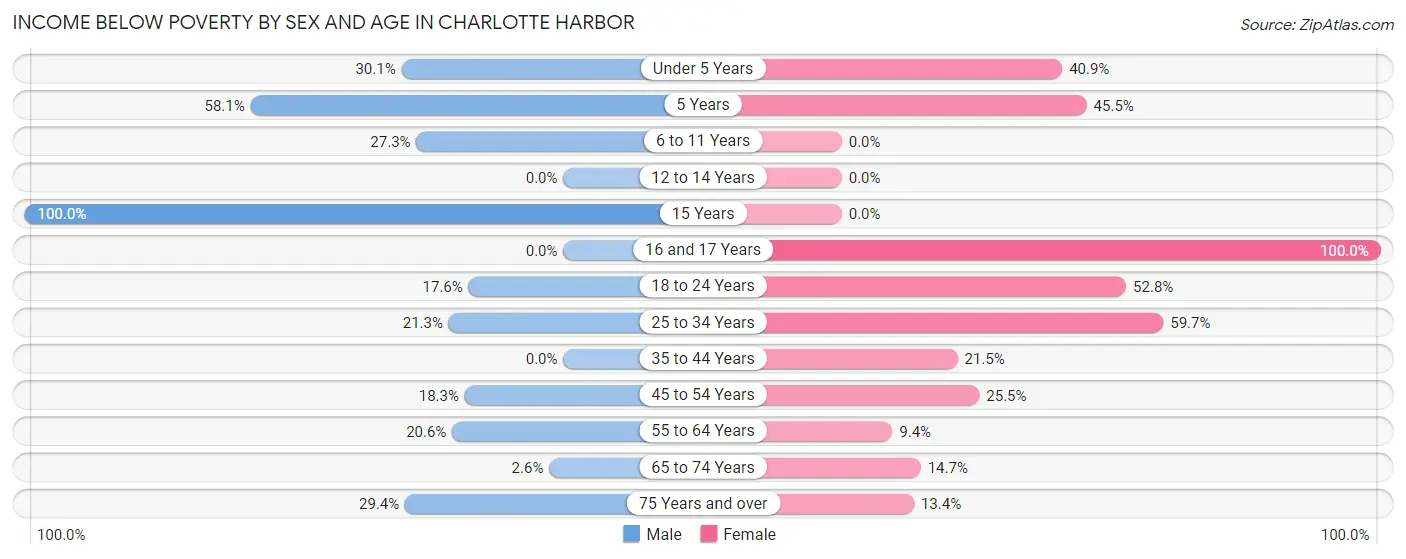
| Age Bracket | Male | Female |
| Under 5 Years | 61 (30.0%) | 9 (40.9%) |
| 5 Years | 18 (58.1%) | 10 (45.5%) |
| 6 to 11 Years | 18 (27.3%) | 0 (0.0%) |
| 12 to 14 Years | 0 (0.0%) | 0 (0.0%) |
| 15 Years | 5 (100.0%) | 0 (0.0%) |
| 16 and 17 Years | 0 (0.0%) | 1 (100.0%) |
| 18 to 24 Years | 19 (17.6%) | 19 (52.8%) |
| 25 to 34 Years | 44 (21.3%) | 111 (59.7%) |
| 35 to 44 Years | 0 (0.0%) | 29 (21.5%) |
| 45 to 54 Years | 15 (18.3%) | 48 (25.5%) |
| 55 to 64 Years | 46 (20.6%) | 15 (9.4%) |
| 65 to 74 Years | 7 (2.6%) | 63 (14.6%) |
| 75 Years and over | 183 (29.4%) | 95 (13.4%) |
| Total | 416 (21.8%) | 400 (19.5%) |
Income Above Poverty by Sex and Age in Charlotte Harbor
According to the poverty statistics in Charlotte Harbor, males aged 35 to 44 years and females aged 6 to 11 years are the age groups that are most secure financially, with 100.0% of males and 100.0% of females in these age groups living above the poverty line.
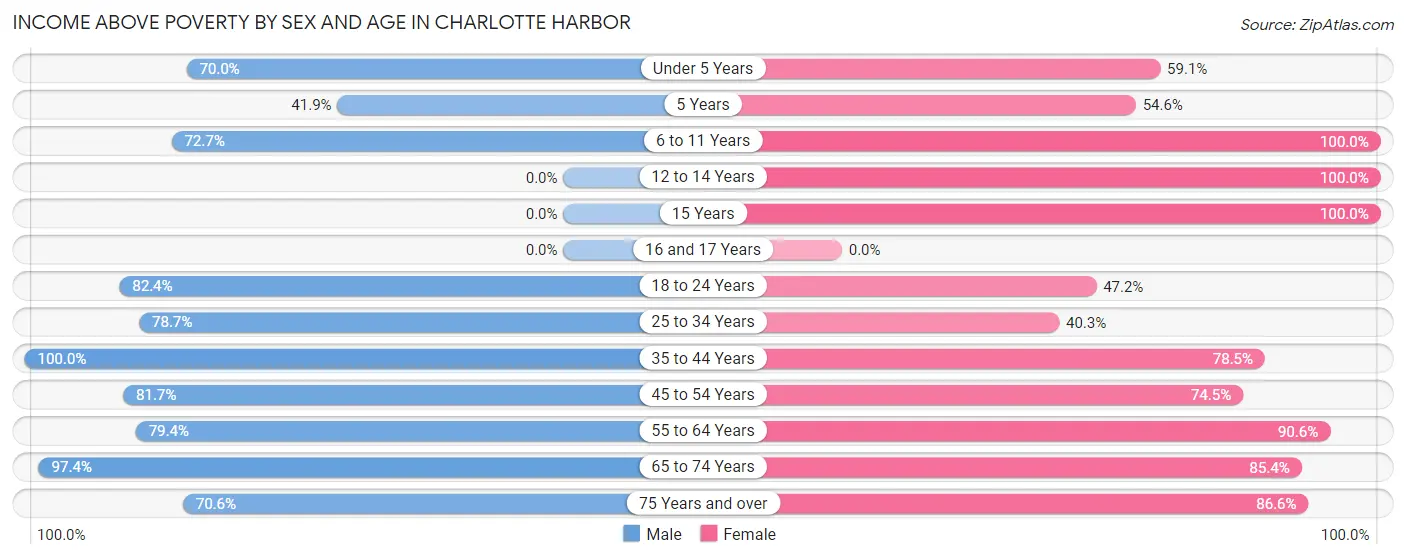
| Age Bracket | Male | Female |
| Under 5 Years | 142 (70.0%) | 13 (59.1%) |
| 5 Years | 13 (41.9%) | 12 (54.5%) |
| 6 to 11 Years | 48 (72.7%) | 98 (100.0%) |
| 12 to 14 Years | 0 (0.0%) | 43 (100.0%) |
| 15 Years | 0 (0.0%) | 26 (100.0%) |
| 16 and 17 Years | 0 (0.0%) | 0 (0.0%) |
| 18 to 24 Years | 89 (82.4%) | 17 (47.2%) |
| 25 to 34 Years | 163 (78.7%) | 75 (40.3%) |
| 35 to 44 Years | 89 (100.0%) | 106 (78.5%) |
| 45 to 54 Years | 67 (81.7%) | 140 (74.5%) |
| 55 to 64 Years | 177 (79.4%) | 145 (90.6%) |
| 65 to 74 Years | 260 (97.4%) | 367 (85.4%) |
| 75 Years and over | 440 (70.6%) | 614 (86.6%) |
| Total | 1,488 (78.1%) | 1,656 (80.5%) |
Income Below Poverty Among Married-Couple Families in Charlotte Harbor
The poverty statistics for married-couple families in Charlotte Harbor show that 12.0% or 83 of the total 691 families live below the poverty line. Families with 1 or 2 children have the highest poverty rate of 24.0%, comprising of 19 families. On the other hand, families with no children have the lowest poverty rate of 10.5%, which includes 64 families.
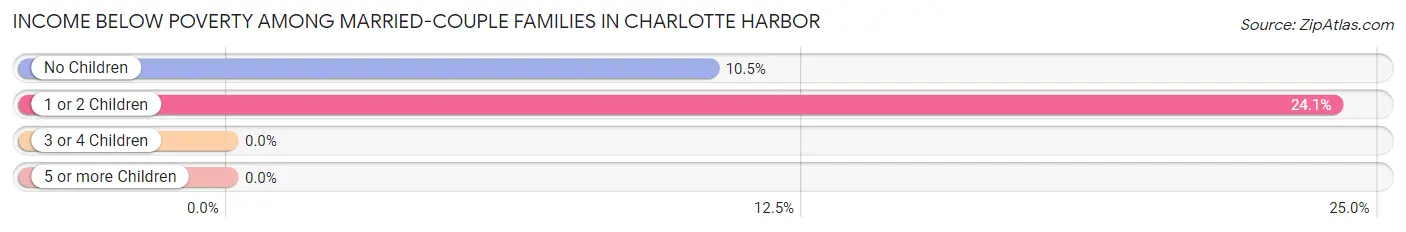
| Children | Above Poverty | Below Poverty |
| No Children | 548 (89.5%) | 64 (10.5%) |
| 1 or 2 Children | 60 (75.9%) | 19 (24.0%) |
| 3 or 4 Children | 0 (0.0%) | 0 (0.0%) |
| 5 or more Children | 0 (0.0%) | 0 (0.0%) |
| Total | 608 (88.0%) | 83 (12.0%) |
Income Below Poverty Among Single-Parent Households in Charlotte Harbor
According to the poverty data in Charlotte Harbor, 14.7% or 14 single-father households and 23.6% or 60 single-mother households are living below the poverty line. Among single-father households, those with 1 or 2 children have the highest poverty rate, with 14 households (25.0%) experiencing poverty. Likewise, among single-mother households, those with 1 or 2 children have the highest poverty rate, with 60 households (29.1%) falling below the poverty line.
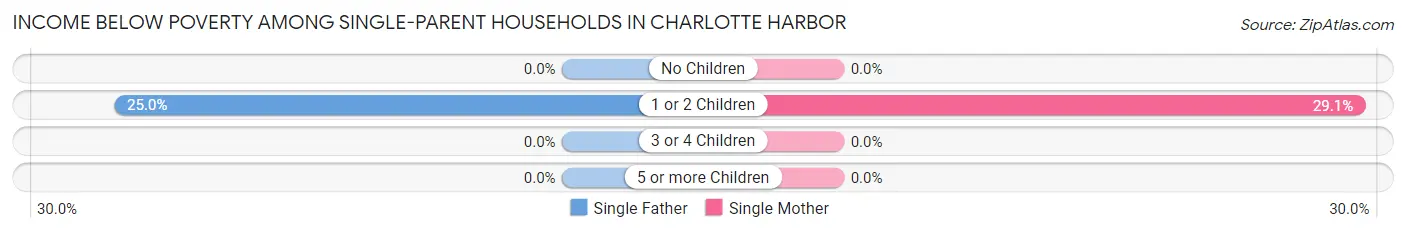
| Children | Single Father | Single Mother |
| No Children | 0 (0.0%) | 0 (0.0%) |
| 1 or 2 Children | 14 (25.0%) | 60 (29.1%) |
| 3 or 4 Children | 0 (0.0%) | 0 (0.0%) |
| 5 or more Children | 0 (0.0%) | 0 (0.0%) |
| Total | 14 (14.7%) | 60 (23.6%) |
Income Below Poverty Among Married-Couple vs Single-Parent Households in Charlotte Harbor
The poverty data for Charlotte Harbor shows that 83 of the married-couple family households (12.0%) and 74 of the single-parent households (21.2%) are living below the poverty level. Within the married-couple family households, those with 1 or 2 children have the highest poverty rate, with 19 households (24.0%) falling below the poverty line. Among the single-parent households, those with 1 or 2 children have the highest poverty rate, with 74 household (28.2%) living below poverty.
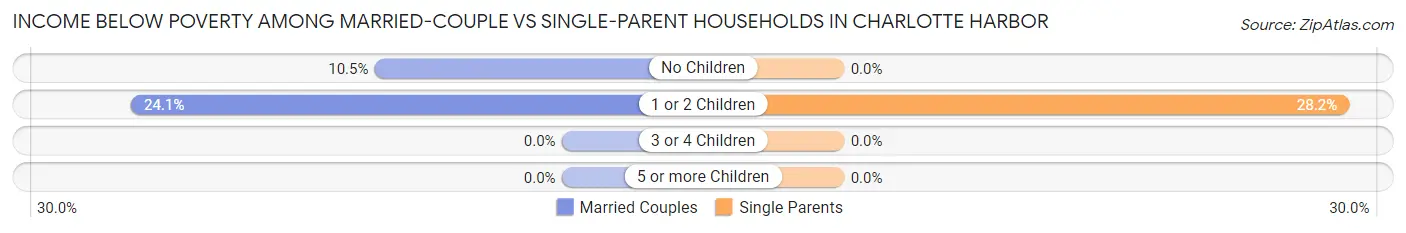
| Children | Married-Couple Families | Single-Parent Households |
| No Children | 64 (10.5%) | 0 (0.0%) |
| 1 or 2 Children | 19 (24.0%) | 74 (28.2%) |
| 3 or 4 Children | 0 (0.0%) | 0 (0.0%) |
| 5 or more Children | 0 (0.0%) | 0 (0.0%) |
| Total | 83 (12.0%) | 74 (21.2%) |
Race in Charlotte Harbor
The most populous races in Charlotte Harbor are White / Caucasian (3,843 | 85.1%), Two or more Races (317 | 7.0%), and Hispanic or Latino (292 | 6.5%).
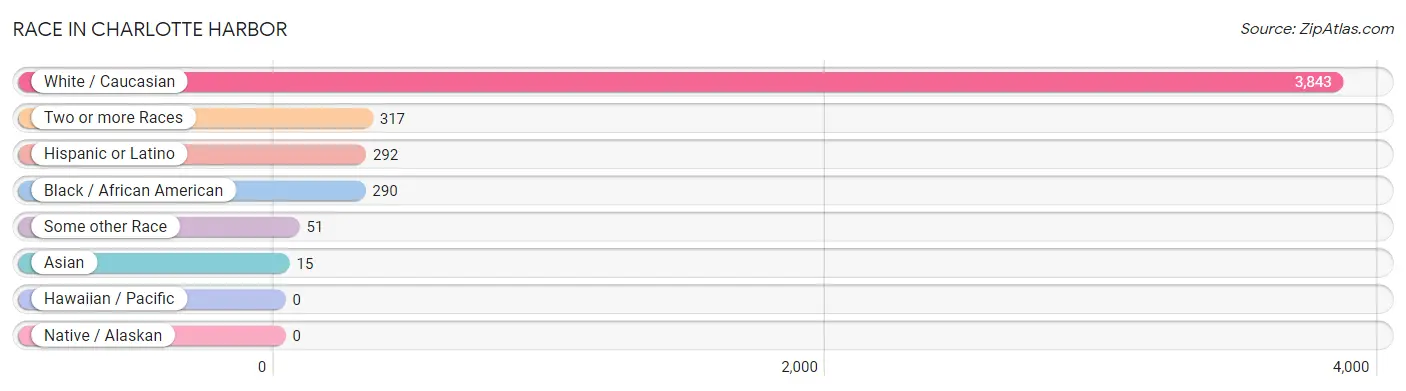
| Race | # Population | % Population |
| Asian | 15 | 0.3% |
| Black / African American | 290 | 6.4% |
| Hawaiian / Pacific | 0 | 0.0% |
| Hispanic or Latino | 292 | 6.5% |
| Native / Alaskan | 0 | 0.0% |
| White / Caucasian | 3,843 | 85.1% |
| Two or more Races | 317 | 7.0% |
| Some other Race | 51 | 1.1% |
| Total | 4,516 | 100.0% |
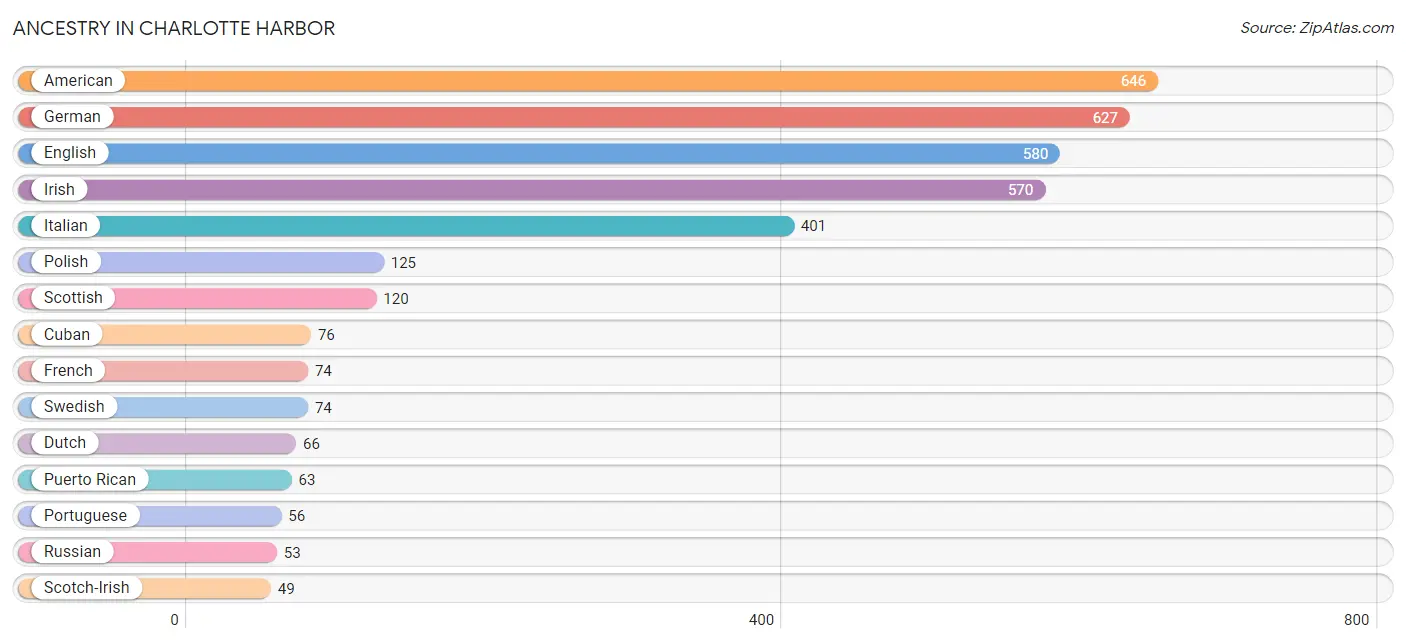
Ancestry in Charlotte Harbor
The most populous ancestries reported in Charlotte Harbor are American (646 | 14.3%), German (627 | 13.9%), English (580 | 12.8%), Irish (570 | 12.6%), and Italian (401 | 8.9%), together accounting for 62.5% of all Charlotte Harbor residents.
| Ancestry | # Population | % Population |
| American | 646 | 14.3% |
| Arab | 21 | 0.5% |
| Argentinean | 8 | 0.2% |
| Armenian | 16 | 0.4% |
| Blackfeet | 9 | 0.2% |
| British | 15 | 0.3% |
| Canadian | 20 | 0.4% |
| Cherokee | 39 | 0.9% |
| Colombian | 9 | 0.2% |
| Cuban | 76 | 1.7% |
| Dominican | 40 | 0.9% |
| Dutch | 66 | 1.5% |
| Eastern European | 27 | 0.6% |
| English | 580 | 12.8% |
| European | 21 | 0.5% |
| Finnish | 7 | 0.2% |
| French | 74 | 1.6% |
| French Canadian | 27 | 0.6% |
| German | 627 | 13.9% |
| Greek | 8 | 0.2% |
| Haitian | 16 | 0.4% |
| Hungarian | 36 | 0.8% |
| Irish | 570 | 12.6% |
| Italian | 401 | 8.9% |
| Korean | 8 | 0.2% |
| Lebanese | 21 | 0.5% |
| Lithuanian | 7 | 0.2% |
| Mexican | 37 | 0.8% |
| Northern European | 29 | 0.6% |
| Norwegian | 16 | 0.4% |
| Pennsylvania German | 10 | 0.2% |
| Polish | 125 | 2.8% |
| Portuguese | 56 | 1.2% |
| Puerto Rican | 63 | 1.4% |
| Romanian | 7 | 0.2% |
| Russian | 53 | 1.2% |
| Scotch-Irish | 49 | 1.1% |
| Scottish | 120 | 2.7% |
| South American | 17 | 0.4% |
| Spaniard | 31 | 0.7% |
| Spanish | 19 | 0.4% |
| Swedish | 74 | 1.6% |
| Swiss | 18 | 0.4% |
| Thai | 7 | 0.2% |
| Ukrainian | 49 | 1.1% |
| Welsh | 17 | 0.4% | View All 46 Rows |
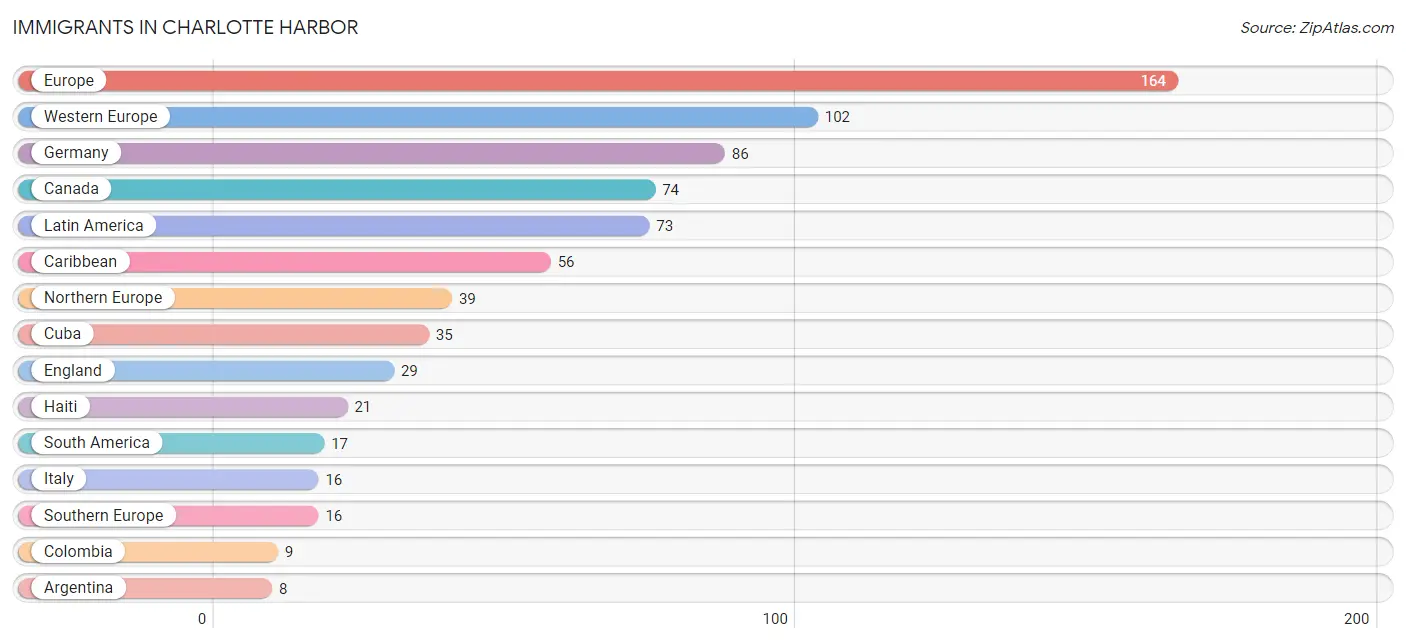
Immigrants in Charlotte Harbor
The most numerous immigrant groups reported in Charlotte Harbor came from Europe (164 | 3.6%), Western Europe (102 | 2.3%), Germany (86 | 1.9%), Canada (74 | 1.6%), and Latin America (73 | 1.6%), together accounting for 11.0% of all Charlotte Harbor residents.
| Immigration Origin | # Population | % Population |
| Argentina | 8 | 0.2% |
| Asia | 7 | 0.2% |
| Austria | 8 | 0.2% |
| Canada | 74 | 1.6% |
| Caribbean | 56 | 1.2% |
| Colombia | 9 | 0.2% |
| Cuba | 35 | 0.8% |
| Eastern Europe | 7 | 0.2% |
| England | 29 | 0.6% |
| Europe | 164 | 3.6% |
| Germany | 86 | 1.9% |
| Haiti | 21 | 0.5% |
| India | 7 | 0.2% |
| Italy | 16 | 0.4% |
| Latin America | 73 | 1.6% |
| Netherlands | 8 | 0.2% |
| Northern Europe | 39 | 0.9% |
| Romania | 7 | 0.2% |
| South America | 17 | 0.4% |
| South Central Asia | 7 | 0.2% |
| Southern Europe | 16 | 0.4% |
| Western Europe | 102 | 2.3% | View All 22 Rows |
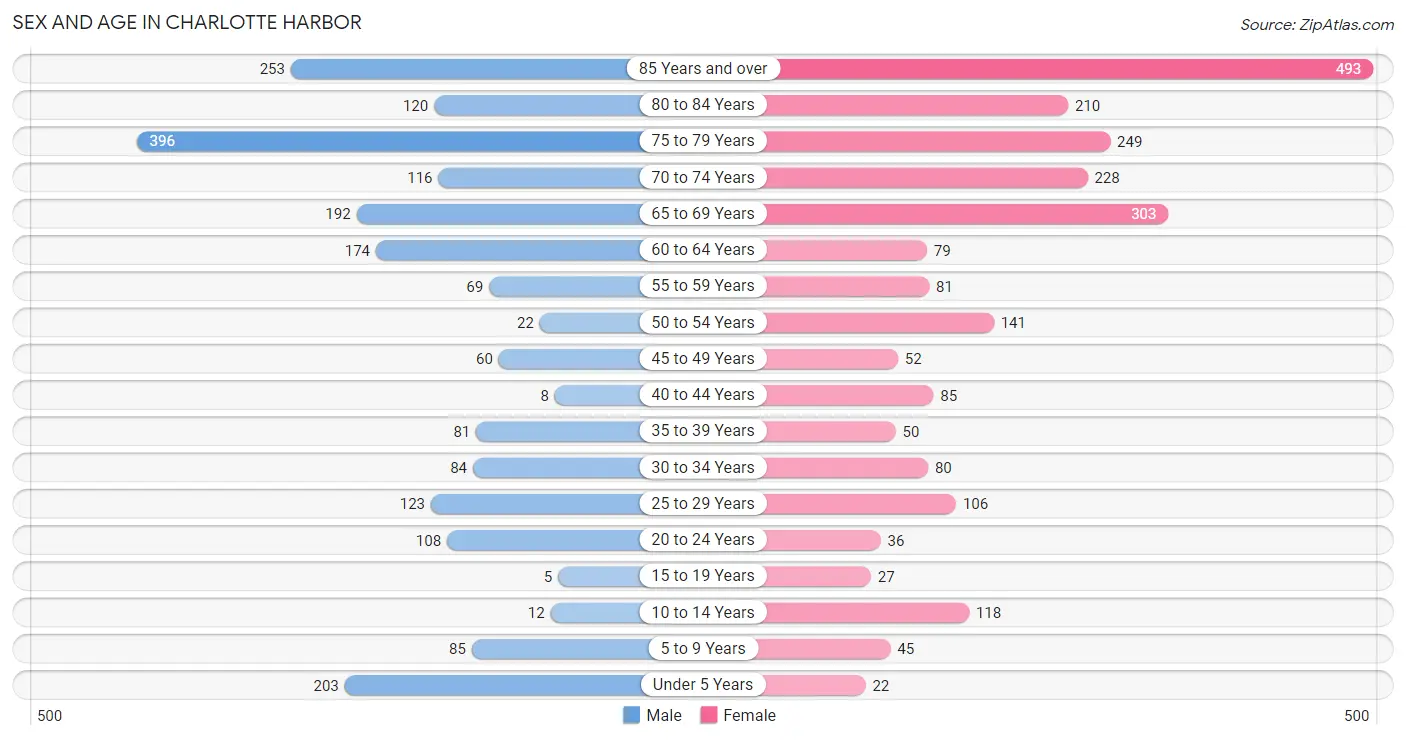
Sex and Age in Charlotte Harbor
Sex and Age in Charlotte Harbor
The most populous age groups in Charlotte Harbor are 75 to 79 Years (396 | 18.8%) for men and 85 Years and over (493 | 20.5%) for women.
| Age Bracket | Male | Female |
| Under 5 Years | 203 (9.6%) | 22 (0.9%) |
| 5 to 9 Years | 85 (4.0%) | 45 (1.9%) |
| 10 to 14 Years | 12 (0.6%) | 118 (4.9%) |
| 15 to 19 Years | 5 (0.2%) | 27 (1.1%) |
| 20 to 24 Years | 108 (5.1%) | 36 (1.5%) |
| 25 to 29 Years | 123 (5.8%) | 106 (4.4%) |
| 30 to 34 Years | 84 (4.0%) | 80 (3.3%) |
| 35 to 39 Years | 81 (3.8%) | 50 (2.1%) |
| 40 to 44 Years | 8 (0.4%) | 85 (3.5%) |
| 45 to 49 Years | 60 (2.8%) | 52 (2.2%) |
| 50 to 54 Years | 22 (1.0%) | 141 (5.9%) |
| 55 to 59 Years | 69 (3.3%) | 81 (3.4%) |
| 60 to 64 Years | 174 (8.2%) | 79 (3.3%) |
| 65 to 69 Years | 192 (9.1%) | 303 (12.6%) |
| 70 to 74 Years | 116 (5.5%) | 228 (9.5%) |
| 75 to 79 Years | 396 (18.8%) | 249 (10.3%) |
| 80 to 84 Years | 120 (5.7%) | 210 (8.7%) |
| 85 Years and over | 253 (12.0%) | 493 (20.5%) |
| Total | 2,111 (100.0%) | 2,405 (100.0%) |
Families and Households in Charlotte Harbor
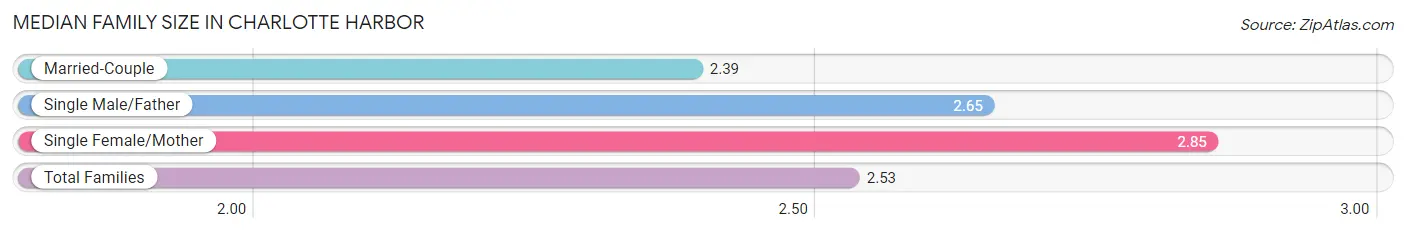
Median Family Size in Charlotte Harbor
The median family size in Charlotte Harbor is 2.53 persons per family, with single female/mother families (254 | 24.4%) accounting for the largest median family size of 2.85 persons per family. On the other hand, married-couple families (691 | 66.4%) represent the smallest median family size with 2.39 persons per family.
| Family Type | # Families | Family Size |
| Married-Couple | 691 (66.4%) | 2.39 |
| Single Male/Father | 95 (9.1%) | 2.65 |
| Single Female/Mother | 254 (24.4%) | 2.85 |
| Total Families | 1,040 (100.0%) | 2.53 |
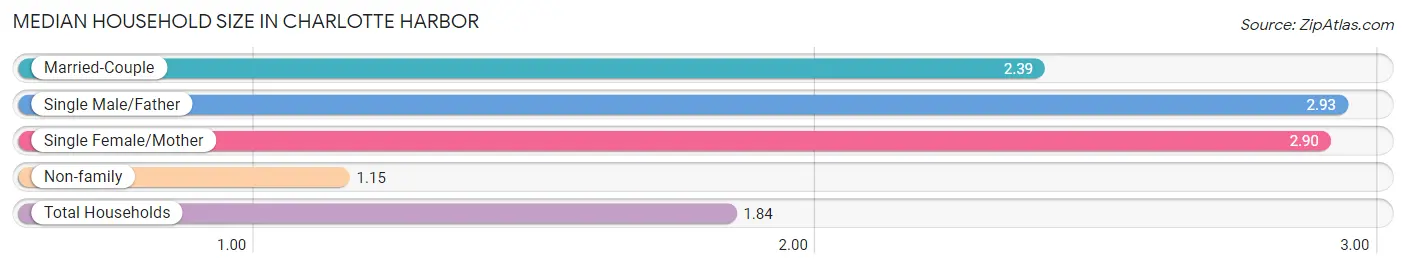
Median Household Size in Charlotte Harbor
The median household size in Charlotte Harbor is 1.84 persons per household, with single male/father households (95 | 4.5%) accounting for the largest median household size of 2.93 persons per household. non-family households (1,083 | 51.0%) represent the smallest median household size with 1.15 persons per household.
| Household Type | # Households | Household Size |
| Married-Couple | 691 (32.6%) | 2.39 |
| Single Male/Father | 95 (4.5%) | 2.93 |
| Single Female/Mother | 254 (12.0%) | 2.90 |
| Non-family | 1,083 (51.0%) | 1.15 |
| Total Households | 2,123 (100.0%) | 1.84 |
Household Size by Marriage Status in Charlotte Harbor
Out of a total of 2,123 households in Charlotte Harbor, 1,040 (49.0%) are family households, while 1,083 (51.0%) are nonfamily households. The most numerous type of family households are 2-person households, comprising 660, and the most common type of nonfamily households are 1-person households, comprising 978.
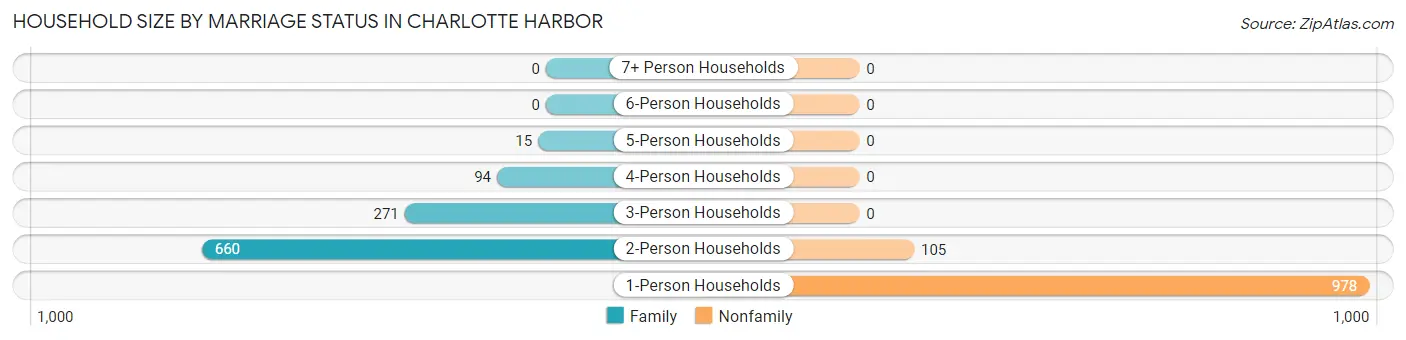
| Household Size | Family Households | Nonfamily Households |
| 1-Person Households | - | 978 (46.1%) |
| 2-Person Households | 660 (31.1%) | 105 (5.0%) |
| 3-Person Households | 271 (12.8%) | 0 (0.0%) |
| 4-Person Households | 94 (4.4%) | 0 (0.0%) |
| 5-Person Households | 15 (0.7%) | 0 (0.0%) |
| 6-Person Households | 0 (0.0%) | 0 (0.0%) |
| 7+ Person Households | 0 (0.0%) | 0 (0.0%) |
| Total | 1,040 (49.0%) | 1,083 (51.0%) |
Female Fertility in Charlotte Harbor
Fertility by Age in Charlotte Harbor
Average fertility rate in Charlotte Harbor is 209.0 births per 1,000 women. Women in the age bracket of 20 to 34 years have the highest fertility rate with 410.0 births per 1,000 women. Women in the age bracket of 20 to 34 years acount for 100.0% of all women with births.
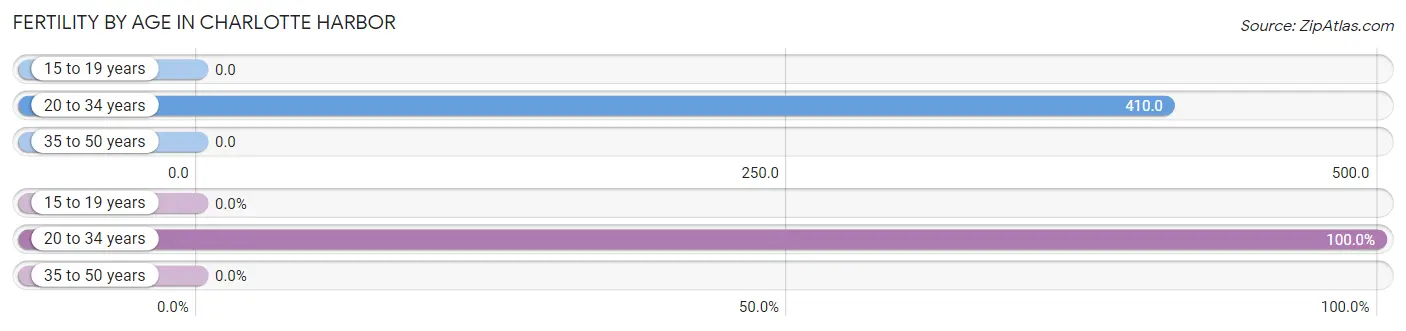
| Age Bracket | Women with Births | Births / 1,000 Women |
| 15 to 19 years | 0 (0.0%) | 0.0 |
| 20 to 34 years | 91 (100.0%) | 410.0 |
| 35 to 50 years | 0 (0.0%) | 0.0 |
| Total | 91 (100.0%) | 209.0 |
Fertility by Age by Marriage Status in Charlotte Harbor
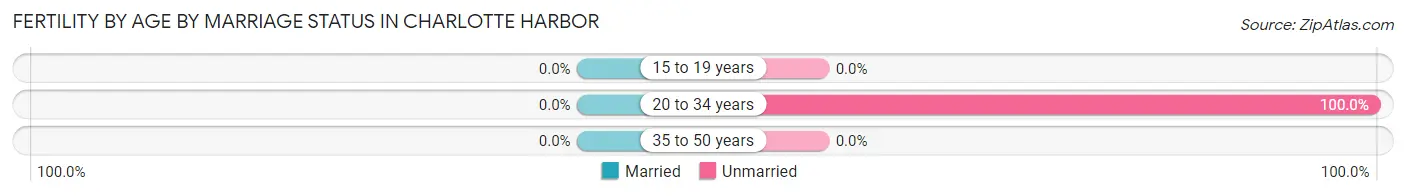
| Age Bracket | Married | Unmarried |
| 15 to 19 years | 0 (0.0%) | 0 (0.0%) |
| 20 to 34 years | 0 (0.0%) | 91 (100.0%) |
| 35 to 50 years | 0 (0.0%) | 0 (0.0%) |
| Total | 0 (0.0%) | 91 (100.0%) |
Fertility by Education in Charlotte Harbor
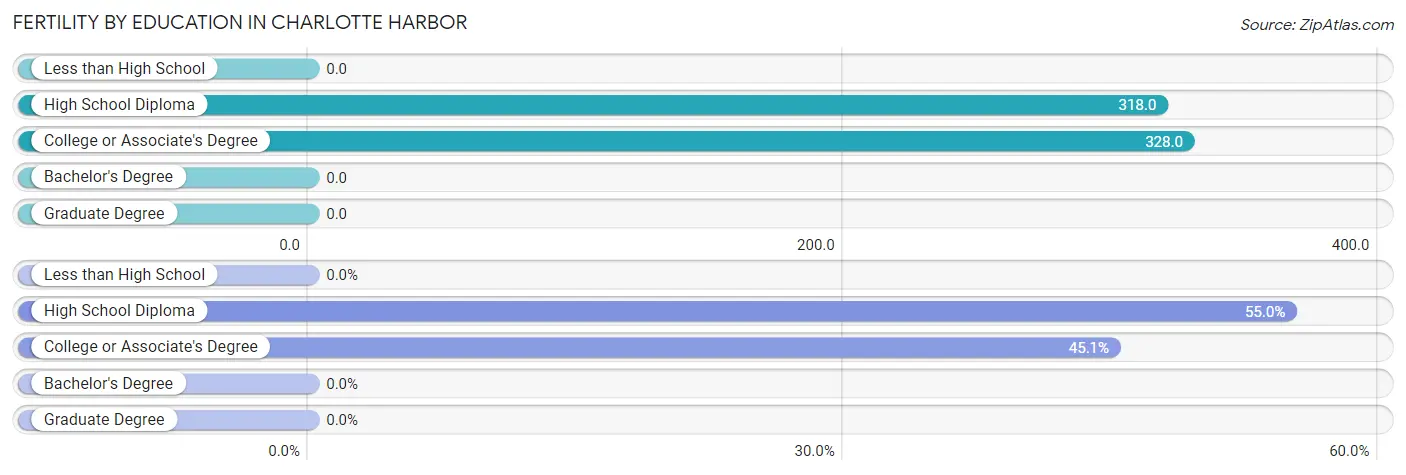
| Educational Attainment | Women with Births | Births / 1,000 Women |
| Less than High School | 0 (0.0%) | 0.0 |
| High School Diploma | 50 (54.9%) | 318.0 |
| College or Associate's Degree | 41 (45.1%) | 328.0 |
| Bachelor's Degree | 0 (0.0%) | 0.0 |
| Graduate Degree | 0 (0.0%) | 0.0 |
| Total | 91 (100.0%) | 209.0 |
Fertility by Education by Marriage Status in Charlotte Harbor
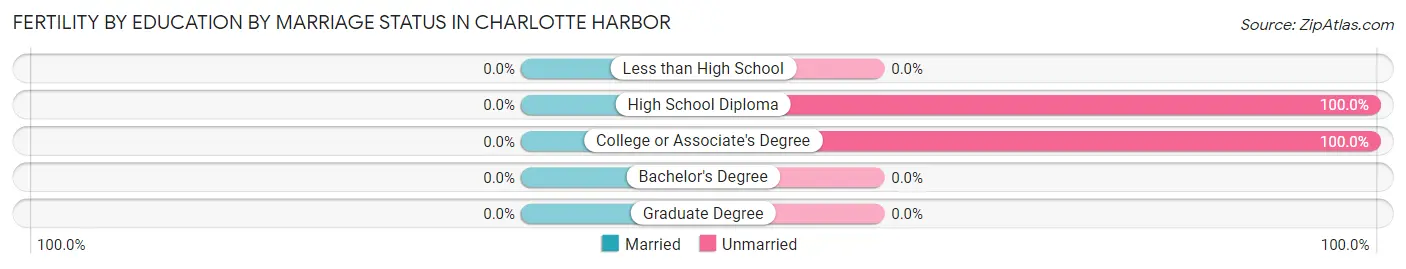
| Educational Attainment | Married | Unmarried |
| Less than High School | 0 (0.0%) | 0 (0.0%) |
| High School Diploma | 0 (0.0%) | 50 (100.0%) |
| College or Associate's Degree | 0 (0.0%) | 41 (100.0%) |
| Bachelor's Degree | 0 (0.0%) | 0 (0.0%) |
| Graduate Degree | 0 (0.0%) | 0 (0.0%) |
| Total | 0 (0.0%) | 91 (100.0%) |
Employment Characteristics in Charlotte Harbor
Employment by Class of Employer in Charlotte Harbor
Among the 1,119 employed individuals in Charlotte Harbor, private company employees (808 | 72.2%), local government employees (101 | 9.0%), and self-employed (incorporated) (63 | 5.6%) make up the most common classes of employment.
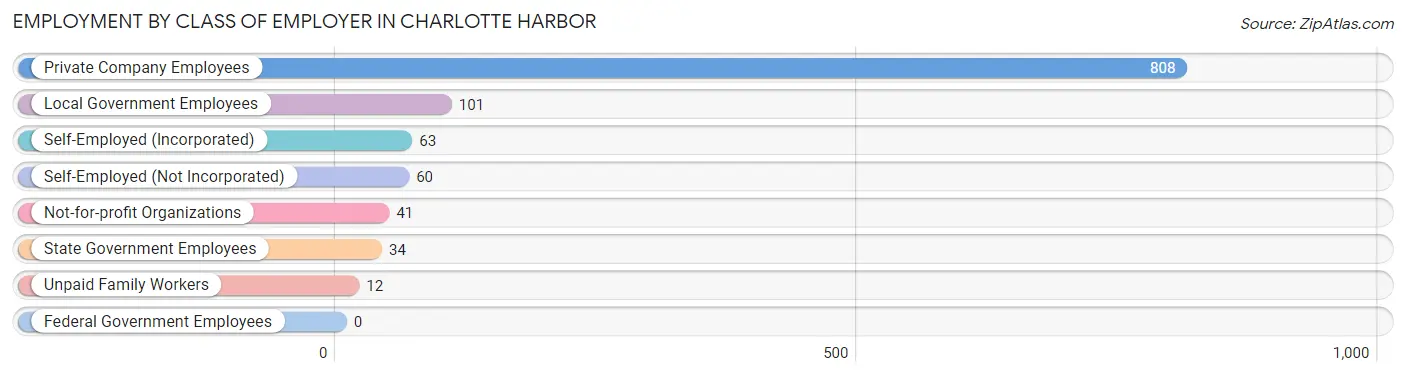
| Employer Class | # Employees | % Employees |
| Private Company Employees | 808 | 72.2% |
| Self-Employed (Incorporated) | 63 | 5.6% |
| Self-Employed (Not Incorporated) | 60 | 5.4% |
| Not-for-profit Organizations | 41 | 3.7% |
| Local Government Employees | 101 | 9.0% |
| State Government Employees | 34 | 3.0% |
| Federal Government Employees | 0 | 0.0% |
| Unpaid Family Workers | 12 | 1.1% |
| Total | 1,119 | 100.0% |
Employment Status by Age in Charlotte Harbor
According to the labor force statistics for Charlotte Harbor, out of the total population over 16 years of age (4,000), 29.3% or 1,172 individuals are in the labor force, with 2.6% or 30 of them unemployed. The age group with the highest labor force participation rate is 25 to 29 years, with 91.7% or 210 individuals in the labor force. Within the labor force, the 65 to 74 years age range has the highest percentage of unemployed individuals, with 9.1% or 15 of them being unemployed.
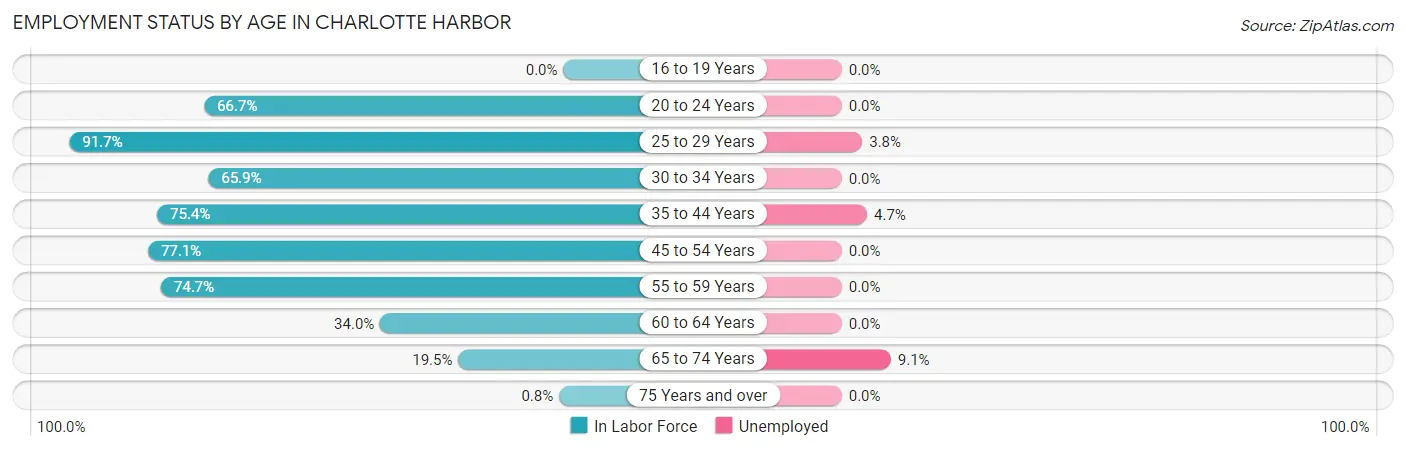
| Age Bracket | In Labor Force | Unemployed |
| 16 to 19 Years | 0 (0.0%) | 0 (0.0%) |
| 20 to 24 Years | 96 (66.7%) | 0 (0.0%) |
| 25 to 29 Years | 210 (91.7%) | 8 (3.8%) |
| 30 to 34 Years | 108 (65.9%) | 0 (0.0%) |
| 35 to 44 Years | 169 (75.4%) | 8 (4.7%) |
| 45 to 54 Years | 212 (77.1%) | 0 (0.0%) |
| 55 to 59 Years | 112 (74.7%) | 0 (0.0%) |
| 60 to 64 Years | 86 (34.0%) | 0 (0.0%) |
| 65 to 74 Years | 164 (19.5%) | 15 (9.1%) |
| 75 Years and over | 14 (0.8%) | 0 (0.0%) |
| Total | 1,172 (29.3%) | 30 (2.6%) |
Employment Status by Educational Attainment in Charlotte Harbor
According to labor force statistics for Charlotte Harbor, 69.3% of individuals (897) out of the total population between 25 and 64 years of age (1,295) are in the labor force, with 1.8% or 16 of them being unemployed. The group with the highest labor force participation rate are those with the educational attainment of college / associate degree, with 79.1% or 261 individuals in the labor force. Within the labor force, individuals with college / associate degree education have the highest percentage of unemployment, with 6.1% or 16 of them being unemployed.
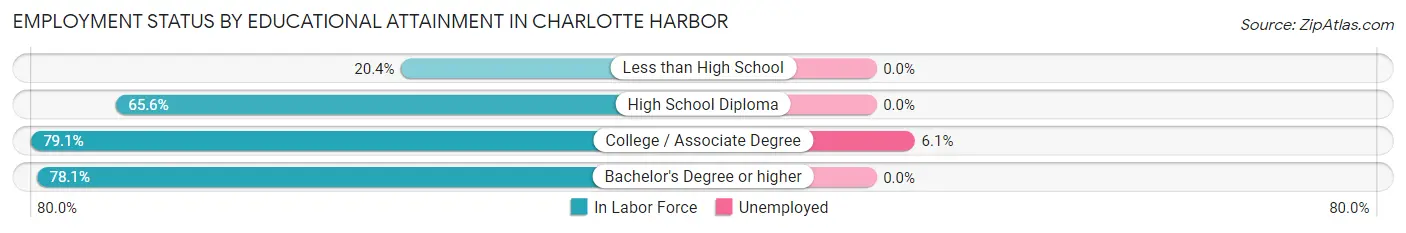
| Educational Attainment | In Labor Force | Unemployed |
| Less than High School | 20 (20.4%) | 0 (0.0%) |
| High School Diploma | 320 (65.6%) | 0 (0.0%) |
| College / Associate Degree | 261 (79.1%) | 20 (6.1%) |
| Bachelor's Degree or higher | 296 (78.1%) | 0 (0.0%) |
| Total | 897 (69.3%) | 23 (1.8%) |
Employment Occupations by Sex in Charlotte Harbor
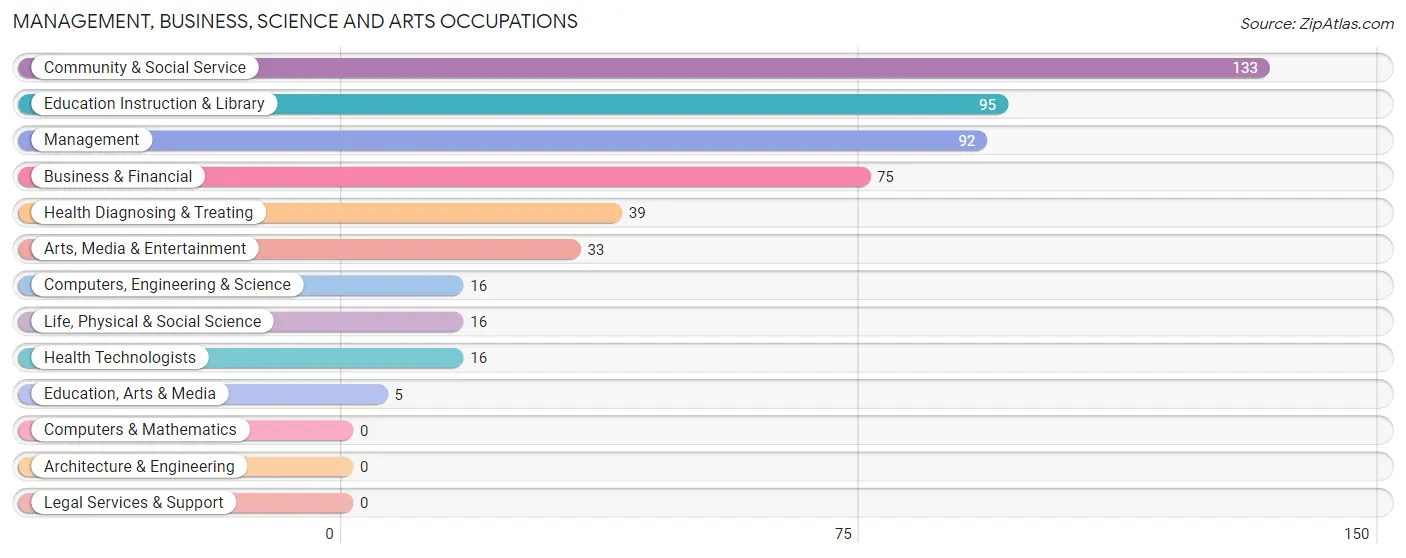
Management, Business, Science and Arts Occupations
The most common Management, Business, Science and Arts occupations in Charlotte Harbor are Community & Social Service (133 | 11.7%), Education Instruction & Library (95 | 8.3%), Management (92 | 8.1%), Business & Financial (75 | 6.6%), and Health Diagnosing & Treating (39 | 3.4%).
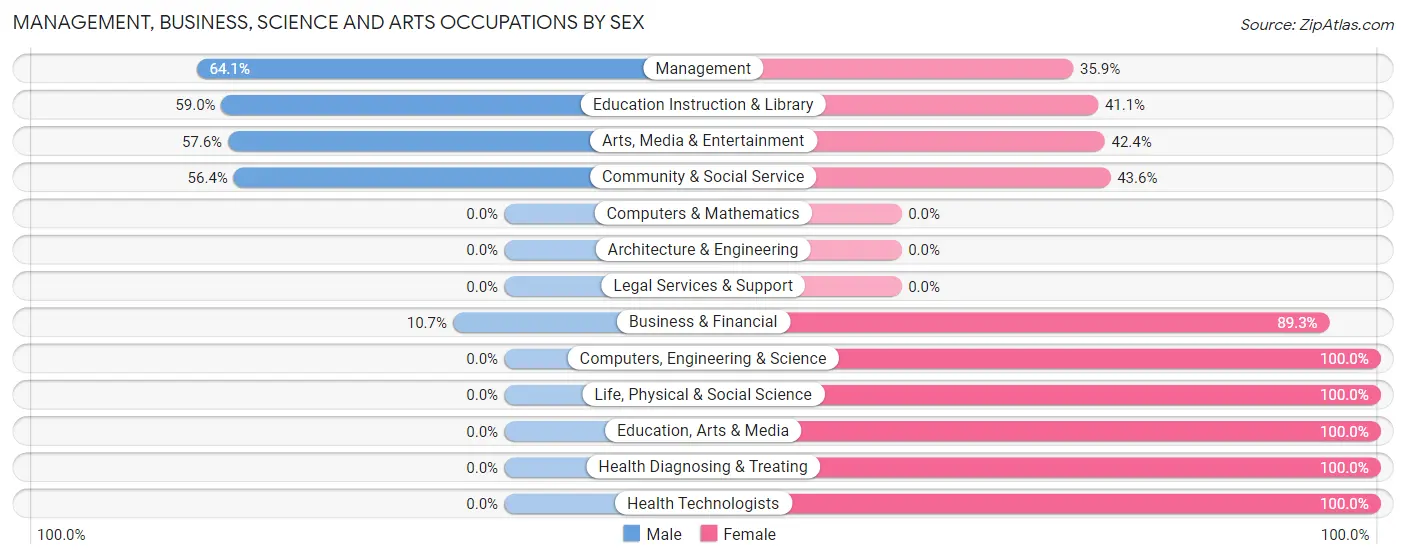
Management, Business, Science and Arts Occupations by Sex
Within the Management, Business, Science and Arts occupations in Charlotte Harbor, the most male-oriented occupations are Management (64.1%), Education Instruction & Library (59.0%), and Arts, Media & Entertainment (57.6%), while the most female-oriented occupations are Computers, Engineering & Science (100.0%), Life, Physical & Social Science (100.0%), and Education, Arts & Media (100.0%).
| Occupation | Male | Female |
| Management | 59 (64.1%) | 33 (35.9%) |
| Business & Financial | 8 (10.7%) | 67 (89.3%) |
| Computers, Engineering & Science | 0 (0.0%) | 16 (100.0%) |
| Computers & Mathematics | 0 (0.0%) | 0 (0.0%) |
| Architecture & Engineering | 0 (0.0%) | 0 (0.0%) |
| Life, Physical & Social Science | 0 (0.0%) | 16 (100.0%) |
| Community & Social Service | 75 (56.4%) | 58 (43.6%) |
| Education, Arts & Media | 0 (0.0%) | 5 (100.0%) |
| Legal Services & Support | 0 (0.0%) | 0 (0.0%) |
| Education Instruction & Library | 56 (59.0%) | 39 (41.0%) |
| Arts, Media & Entertainment | 19 (57.6%) | 14 (42.4%) |
| Health Diagnosing & Treating | 0 (0.0%) | 39 (100.0%) |
| Health Technologists | 0 (0.0%) | 16 (100.0%) |
| Total (Category) | 142 (40.0%) | 213 (60.0%) |
| Total (Overall) | 541 (47.5%) | 599 (52.5%) |
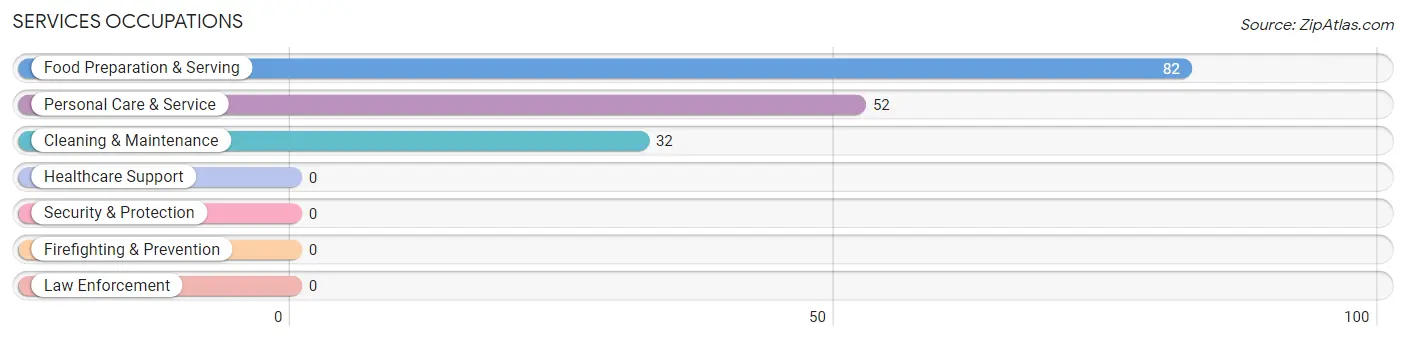
Services Occupations
The most common Services occupations in Charlotte Harbor are Food Preparation & Serving (82 | 7.2%), Personal Care & Service (52 | 4.6%), and Cleaning & Maintenance (32 | 2.8%).
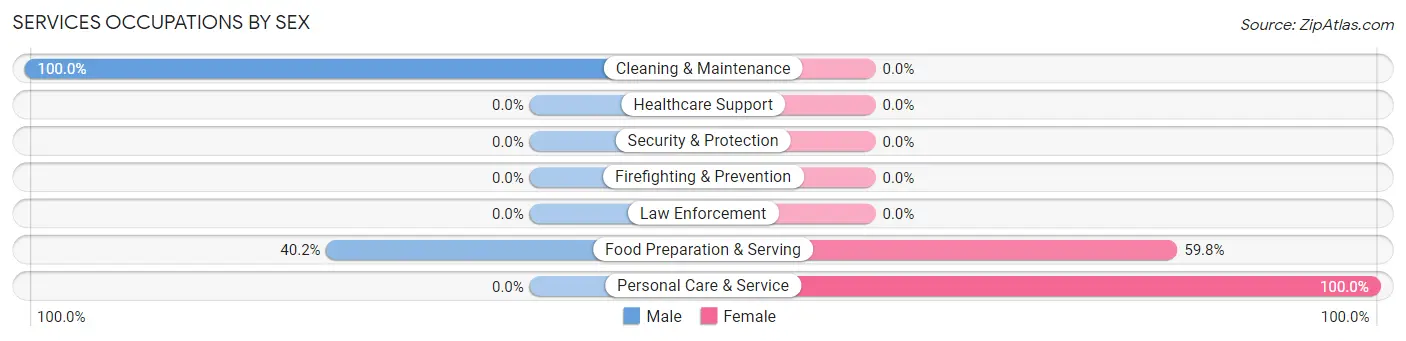
Services Occupations by Sex
Within the Services occupations in Charlotte Harbor, the most male-oriented occupations are Cleaning & Maintenance (100.0%), and Food Preparation & Serving (40.2%), while the most female-oriented occupations are Personal Care & Service (100.0%), and Food Preparation & Serving (59.8%).
| Occupation | Male | Female |
| Healthcare Support | 0 (0.0%) | 0 (0.0%) |
| Security & Protection | 0 (0.0%) | 0 (0.0%) |
| Firefighting & Prevention | 0 (0.0%) | 0 (0.0%) |
| Law Enforcement | 0 (0.0%) | 0 (0.0%) |
| Food Preparation & Serving | 33 (40.2%) | 49 (59.8%) |
| Cleaning & Maintenance | 32 (100.0%) | 0 (0.0%) |
| Personal Care & Service | 0 (0.0%) | 52 (100.0%) |
| Total (Category) | 65 (39.2%) | 101 (60.8%) |
| Total (Overall) | 541 (47.5%) | 599 (52.5%) |
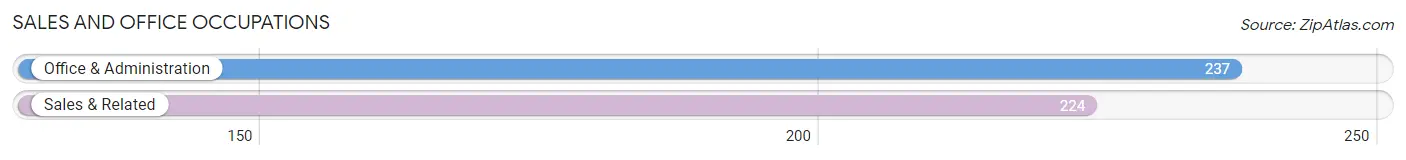
Sales and Office Occupations
The most common Sales and Office occupations in Charlotte Harbor are Office & Administration (237 | 20.8%), and Sales & Related (224 | 19.7%).
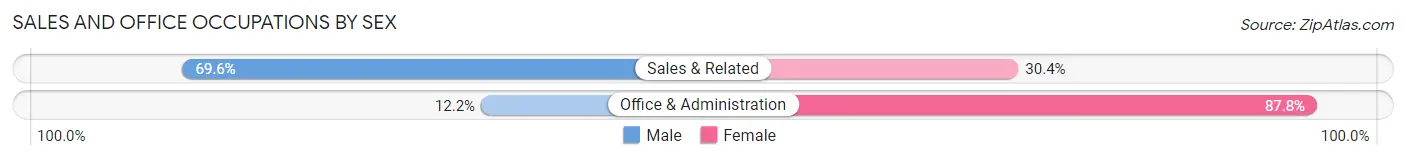
Sales and Office Occupations by Sex
| Occupation | Male | Female |
| Sales & Related | 156 (69.6%) | 68 (30.4%) |
| Office & Administration | 29 (12.2%) | 208 (87.8%) |
| Total (Category) | 185 (40.1%) | 276 (59.9%) |
| Total (Overall) | 541 (47.5%) | 599 (52.5%) |
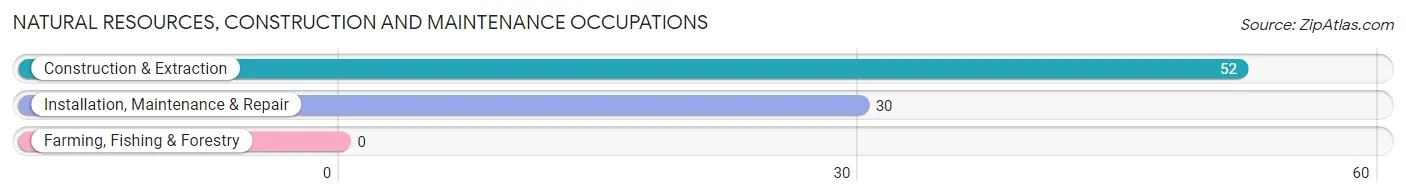
Natural Resources, Construction and Maintenance Occupations
The most common Natural Resources, Construction and Maintenance occupations in Charlotte Harbor are Construction & Extraction (52 | 4.6%), and Installation, Maintenance & Repair (30 | 2.6%).
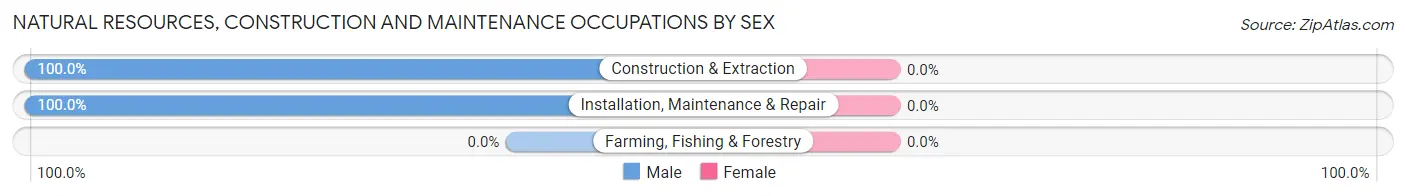
Natural Resources, Construction and Maintenance Occupations by Sex
| Occupation | Male | Female |
| Farming, Fishing & Forestry | 0 (0.0%) | 0 (0.0%) |
| Construction & Extraction | 52 (100.0%) | 0 (0.0%) |
| Installation, Maintenance & Repair | 30 (100.0%) | 0 (0.0%) |
| Total (Category) | 82 (100.0%) | 0 (0.0%) |
| Total (Overall) | 541 (47.5%) | 599 (52.5%) |
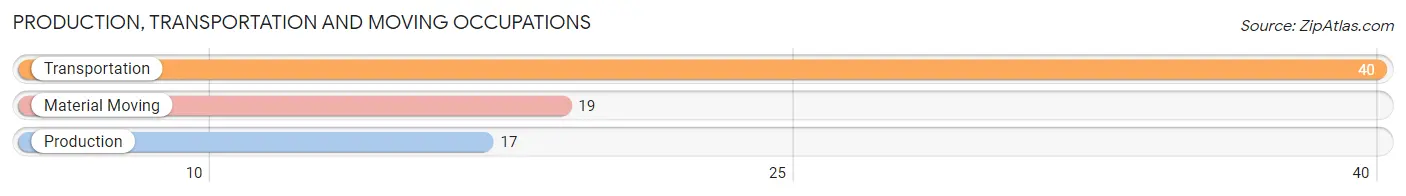
Production, Transportation and Moving Occupations
The most common Production, Transportation and Moving occupations in Charlotte Harbor are Transportation (40 | 3.5%), Material Moving (19 | 1.7%), and Production (17 | 1.5%).
Production, Transportation and Moving Occupations by Sex
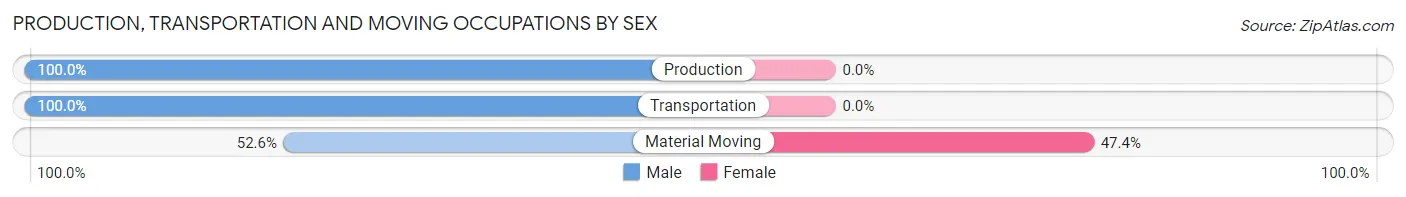
| Occupation | Male | Female |
| Production | 17 (100.0%) | 0 (0.0%) |
| Transportation | 40 (100.0%) | 0 (0.0%) |
| Material Moving | 10 (52.6%) | 9 (47.4%) |
| Total (Category) | 67 (88.2%) | 9 (11.8%) |
| Total (Overall) | 541 (47.5%) | 599 (52.5%) |
Employment Industries by Sex in Charlotte Harbor
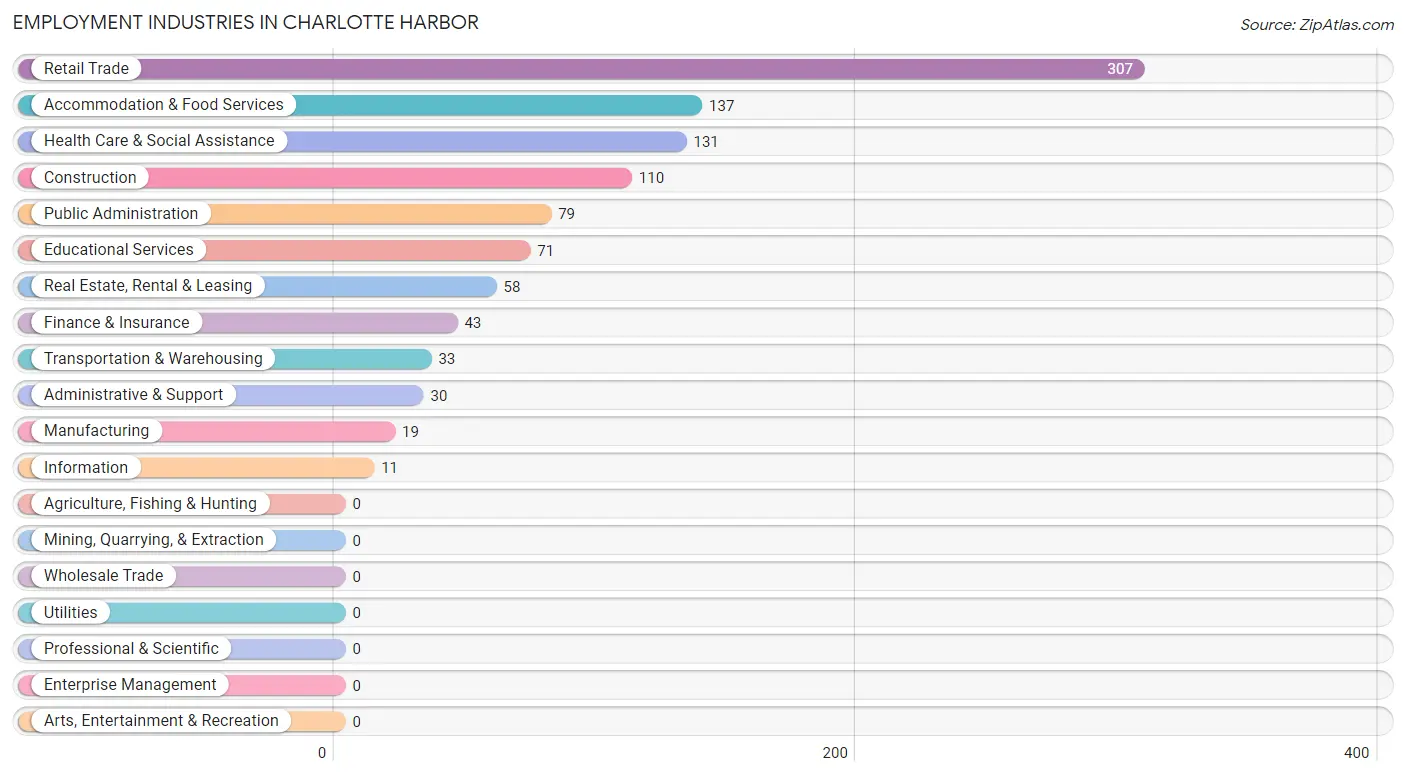
Employment Industries in Charlotte Harbor
The major employment industries in Charlotte Harbor include Retail Trade (307 | 26.9%), Accommodation & Food Services (137 | 12.0%), Health Care & Social Assistance (131 | 11.5%), Construction (110 | 9.7%), and Public Administration (79 | 6.9%).
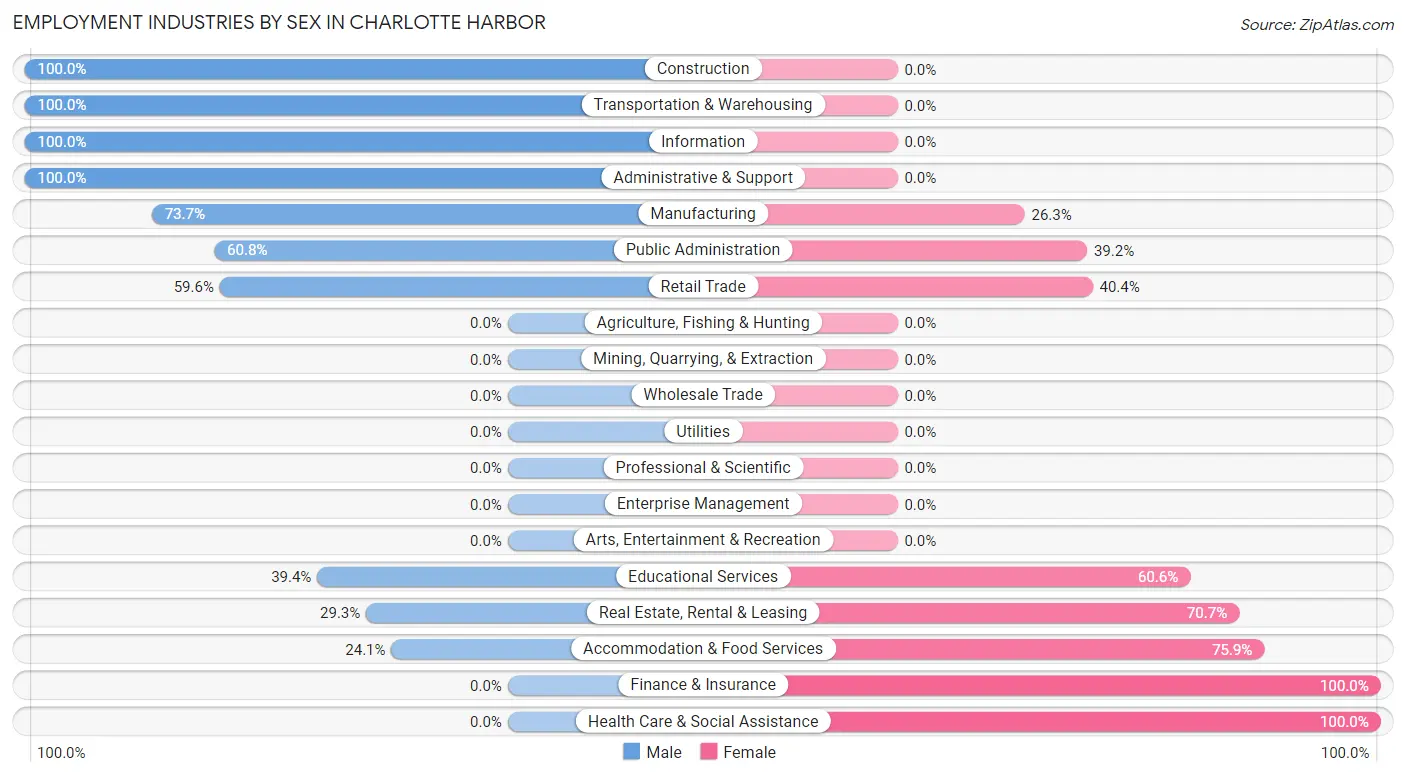
Employment Industries by Sex in Charlotte Harbor
The Charlotte Harbor industries that see more men than women are Construction (100.0%), Transportation & Warehousing (100.0%), and Information (100.0%), whereas the industries that tend to have a higher number of women are Finance & Insurance (100.0%), Health Care & Social Assistance (100.0%), and Accommodation & Food Services (75.9%).
| Industry | Male | Female |
| Agriculture, Fishing & Hunting | 0 (0.0%) | 0 (0.0%) |
| Mining, Quarrying, & Extraction | 0 (0.0%) | 0 (0.0%) |
| Construction | 110 (100.0%) | 0 (0.0%) |
| Manufacturing | 14 (73.7%) | 5 (26.3%) |
| Wholesale Trade | 0 (0.0%) | 0 (0.0%) |
| Retail Trade | 183 (59.6%) | 124 (40.4%) |
| Transportation & Warehousing | 33 (100.0%) | 0 (0.0%) |
| Utilities | 0 (0.0%) | 0 (0.0%) |
| Information | 11 (100.0%) | 0 (0.0%) |
| Finance & Insurance | 0 (0.0%) | 43 (100.0%) |
| Real Estate, Rental & Leasing | 17 (29.3%) | 41 (70.7%) |
| Professional & Scientific | 0 (0.0%) | 0 (0.0%) |
| Enterprise Management | 0 (0.0%) | 0 (0.0%) |
| Administrative & Support | 30 (100.0%) | 0 (0.0%) |
| Educational Services | 28 (39.4%) | 43 (60.6%) |
| Health Care & Social Assistance | 0 (0.0%) | 131 (100.0%) |
| Arts, Entertainment & Recreation | 0 (0.0%) | 0 (0.0%) |
| Accommodation & Food Services | 33 (24.1%) | 104 (75.9%) |
| Public Administration | 48 (60.8%) | 31 (39.2%) |
| Total | 541 (47.5%) | 599 (52.5%) |
Education in Charlotte Harbor
School Enrollment in Charlotte Harbor
The most common levels of schooling among the 352 students in Charlotte Harbor are elementary school (108 | 30.7%), middle school (83 | 23.6%), and kindergarten (63 | 17.9%).
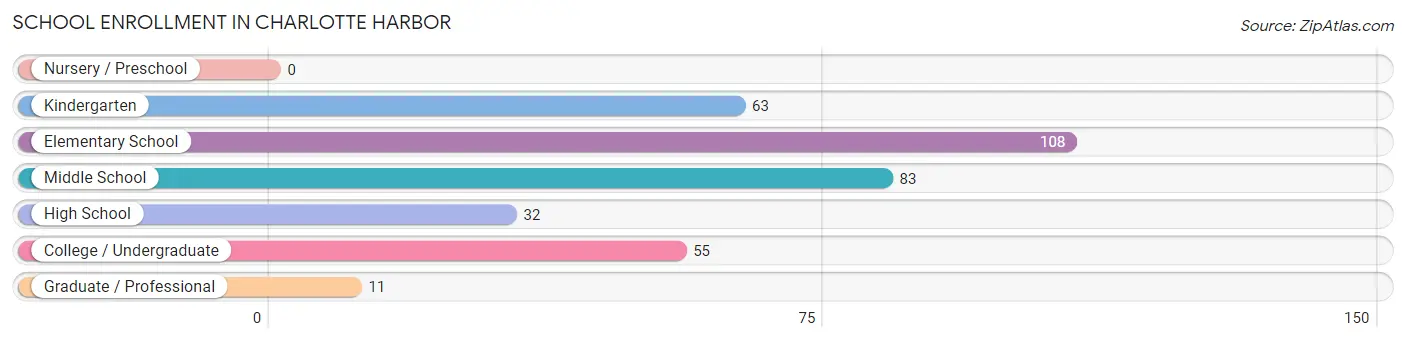
| School Level | # Students | % Students |
| Nursery / Preschool | 0 | 0.0% |
| Kindergarten | 63 | 17.9% |
| Elementary School | 108 | 30.7% |
| Middle School | 83 | 23.6% |
| High School | 32 | 9.1% |
| College / Undergraduate | 55 | 15.6% |
| Graduate / Professional | 11 | 3.1% |
| Total | 352 | 100.0% |
School Enrollment by Age by Funding Source in Charlotte Harbor
Out of a total of 352 students who are enrolled in schools in Charlotte Harbor, 54 (15.3%) attend a private institution, while the remaining 298 (84.7%) are enrolled in public schools. The age group of 10 to 14 year olds has the highest likelihood of being enrolled in private schools, with 42 (32.3% in the age bracket) enrolled. Conversely, the age group of 5 to 9 year old has the lowest likelihood of being enrolled in a private school, with 124 (100.0% in the age bracket) attending a public institution.
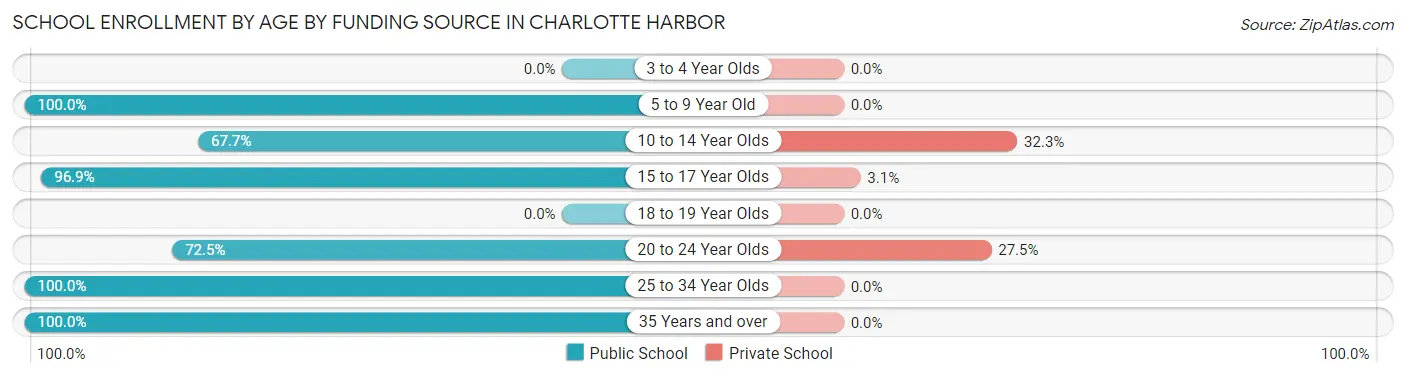
| Age Bracket | Public School | Private School |
| 3 to 4 Year Olds | 0 (0.0%) | 0 (0.0%) |
| 5 to 9 Year Old | 124 (100.0%) | 0 (0.0%) |
| 10 to 14 Year Olds | 88 (67.7%) | 42 (32.3%) |
| 15 to 17 Year Olds | 31 (96.9%) | 1 (3.1%) |
| 18 to 19 Year Olds | 0 (0.0%) | 0 (0.0%) |
| 20 to 24 Year Olds | 29 (72.5%) | 11 (27.5%) |
| 25 to 34 Year Olds | 20 (100.0%) | 0 (0.0%) |
| 35 Years and over | 6 (100.0%) | 0 (0.0%) |
| Total | 298 (84.7%) | 54 (15.3%) |
Educational Attainment by Field of Study in Charlotte Harbor
Business (266 | 26.1%), education (180 | 17.6%), engineering (82 | 8.0%), physical & health sciences (80 | 7.8%), and psychology (74 | 7.2%) are the most common fields of study among 1,021 individuals in Charlotte Harbor who have obtained a bachelor's degree or higher.
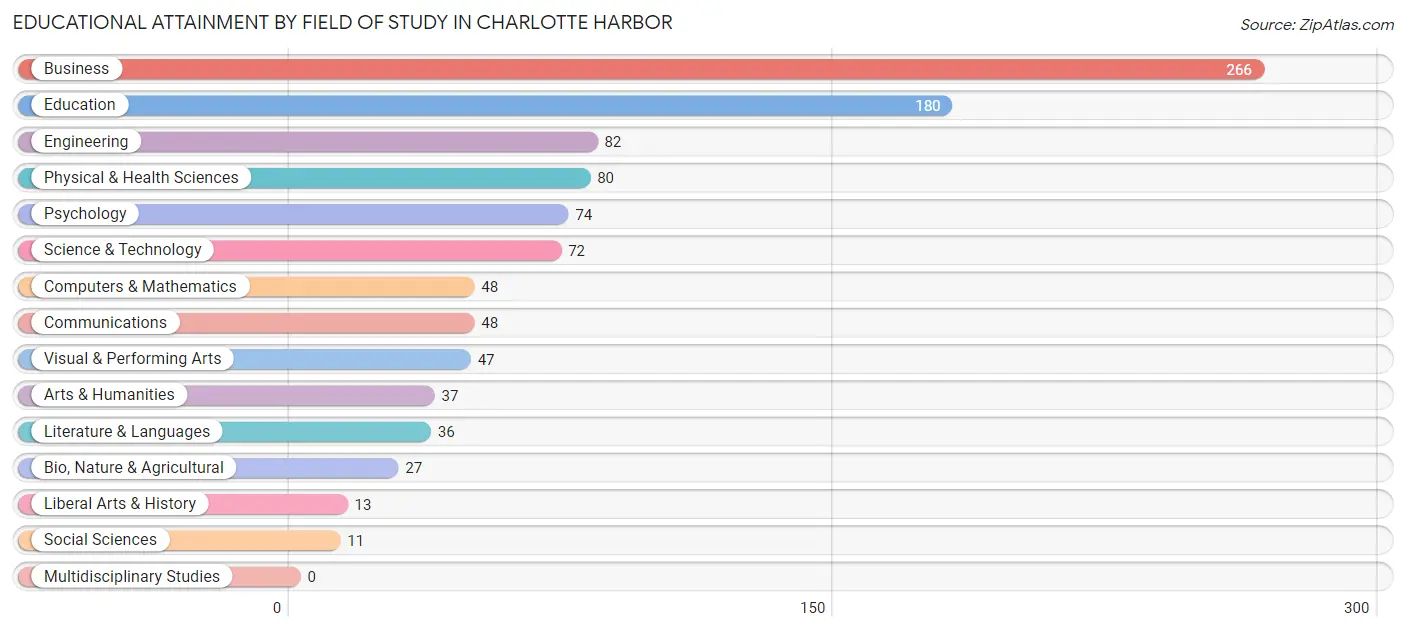
| Field of Study | # Graduates | % Graduates |
| Computers & Mathematics | 48 | 4.7% |
| Bio, Nature & Agricultural | 27 | 2.6% |
| Physical & Health Sciences | 80 | 7.8% |
| Psychology | 74 | 7.2% |
| Social Sciences | 11 | 1.1% |
| Engineering | 82 | 8.0% |
| Multidisciplinary Studies | 0 | 0.0% |
| Science & Technology | 72 | 7.0% |
| Business | 266 | 26.1% |
| Education | 180 | 17.6% |
| Literature & Languages | 36 | 3.5% |
| Liberal Arts & History | 13 | 1.3% |
| Visual & Performing Arts | 47 | 4.6% |
| Communications | 48 | 4.7% |
| Arts & Humanities | 37 | 3.6% |
| Total | 1,021 | 100.0% |
Transportation & Commute in Charlotte Harbor
Vehicle Availability by Sex in Charlotte Harbor
The most prevalent vehicle ownership categories in Charlotte Harbor are males with 2 vehicles (227, accounting for 42.8%) and females with 2 vehicles (312, making up 38.5%).
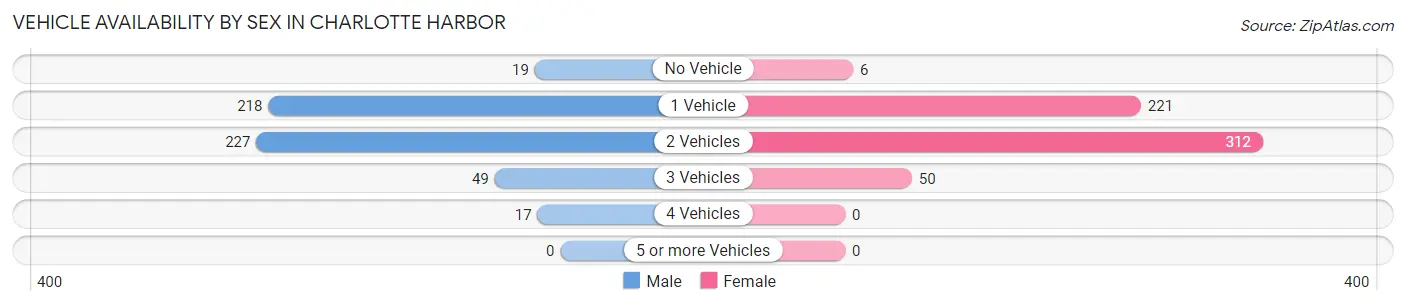
| Vehicles Available | Male | Female |
| No Vehicle | 19 (3.6%) | 6 (1.0%) |
| 1 Vehicle | 218 (41.1%) | 221 (37.5%) |
| 2 Vehicles | 227 (42.8%) | 312 (53.0%) |
| 3 Vehicles | 49 (9.2%) | 50 (8.5%) |
| 4 Vehicles | 17 (3.2%) | 0 (0.0%) |
| 5 or more Vehicles | 0 (0.0%) | 0 (0.0%) |
| Total | 530 (100.0%) | 589 (100.0%) |
Commute Time in Charlotte Harbor
The most frequently occuring commute durations in Charlotte Harbor are 15 to 19 minutes (311 commuters, 29.4%), 10 to 14 minutes (176 commuters, 16.6%), and 5 to 9 minutes (165 commuters, 15.6%).
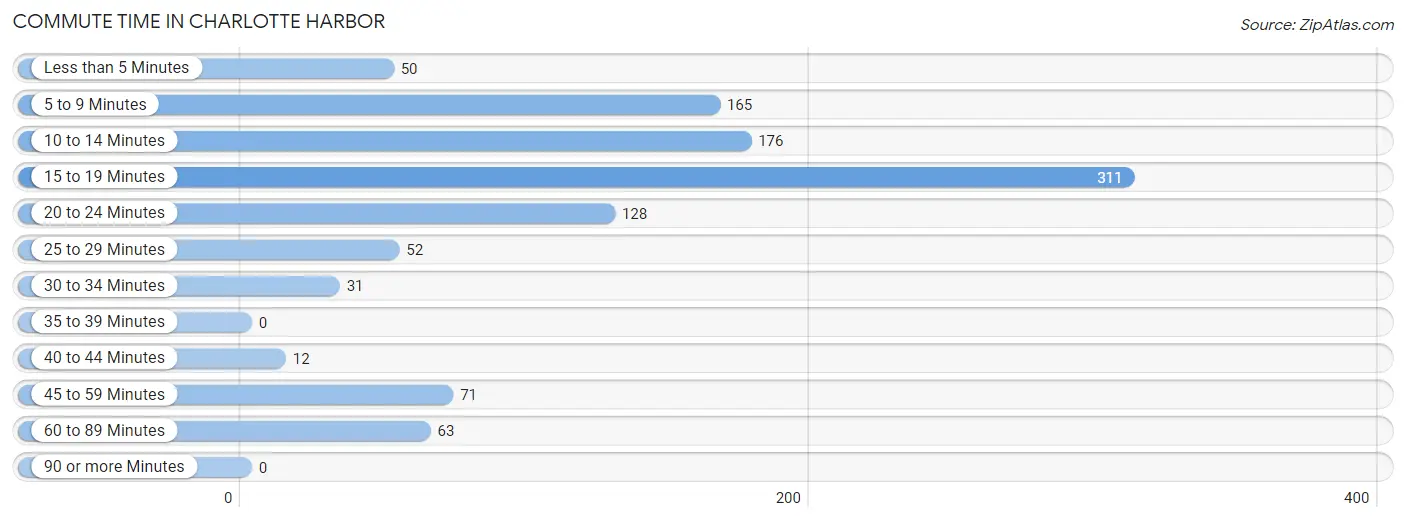
| Commute Time | # Commuters | % Commuters |
| Less than 5 Minutes | 50 | 4.7% |
| 5 to 9 Minutes | 165 | 15.6% |
| 10 to 14 Minutes | 176 | 16.6% |
| 15 to 19 Minutes | 311 | 29.4% |
| 20 to 24 Minutes | 128 | 12.1% |
| 25 to 29 Minutes | 52 | 4.9% |
| 30 to 34 Minutes | 31 | 2.9% |
| 35 to 39 Minutes | 0 | 0.0% |
| 40 to 44 Minutes | 12 | 1.1% |
| 45 to 59 Minutes | 71 | 6.7% |
| 60 to 89 Minutes | 63 | 5.9% |
| 90 or more Minutes | 0 | 0.0% |
Commute Time by Sex in Charlotte Harbor
The most common commute times in Charlotte Harbor are 15 to 19 minutes (181 commuters, 35.5%) for males and 10 to 14 minutes (130 commuters, 23.7%) for females.
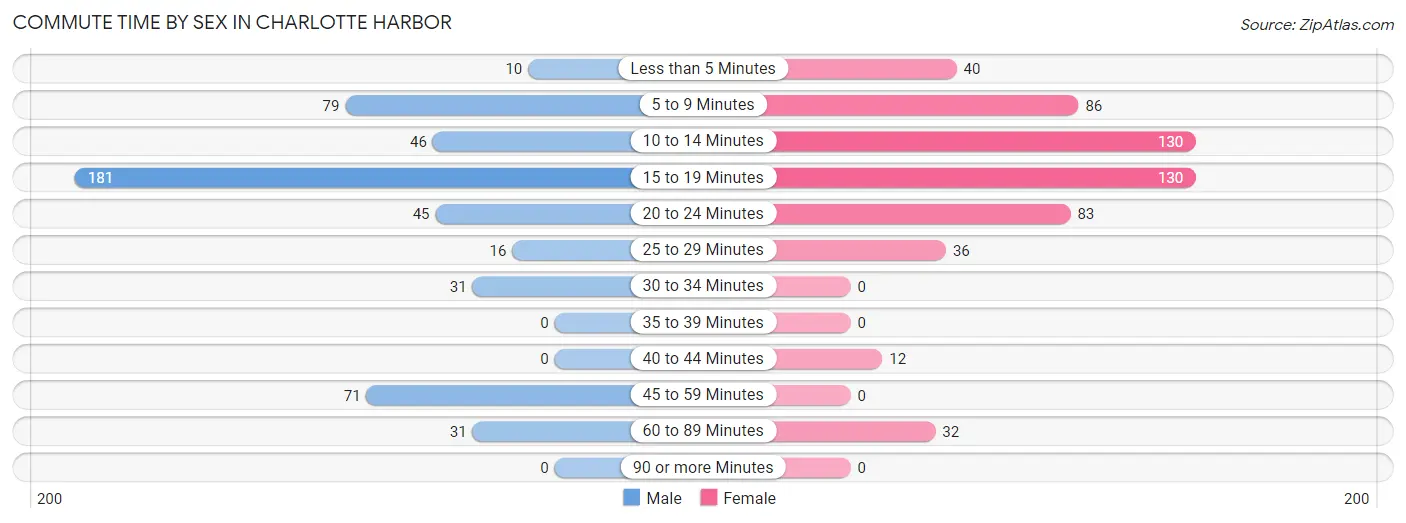
| Commute Time | Male | Female |
| Less than 5 Minutes | 10 (2.0%) | 40 (7.3%) |
| 5 to 9 Minutes | 79 (15.5%) | 86 (15.7%) |
| 10 to 14 Minutes | 46 (9.0%) | 130 (23.7%) |
| 15 to 19 Minutes | 181 (35.5%) | 130 (23.7%) |
| 20 to 24 Minutes | 45 (8.8%) | 83 (15.1%) |
| 25 to 29 Minutes | 16 (3.1%) | 36 (6.6%) |
| 30 to 34 Minutes | 31 (6.1%) | 0 (0.0%) |
| 35 to 39 Minutes | 0 (0.0%) | 0 (0.0%) |
| 40 to 44 Minutes | 0 (0.0%) | 12 (2.2%) |
| 45 to 59 Minutes | 71 (13.9%) | 0 (0.0%) |
| 60 to 89 Minutes | 31 (6.1%) | 32 (5.8%) |
| 90 or more Minutes | 0 (0.0%) | 0 (0.0%) |
Time of Departure to Work by Sex in Charlotte Harbor
The most frequent times of departure to work in Charlotte Harbor are 7:30 AM to 7:59 AM (100, 19.6%) for males and 8:30 AM to 8:59 AM (95, 17.3%) for females.
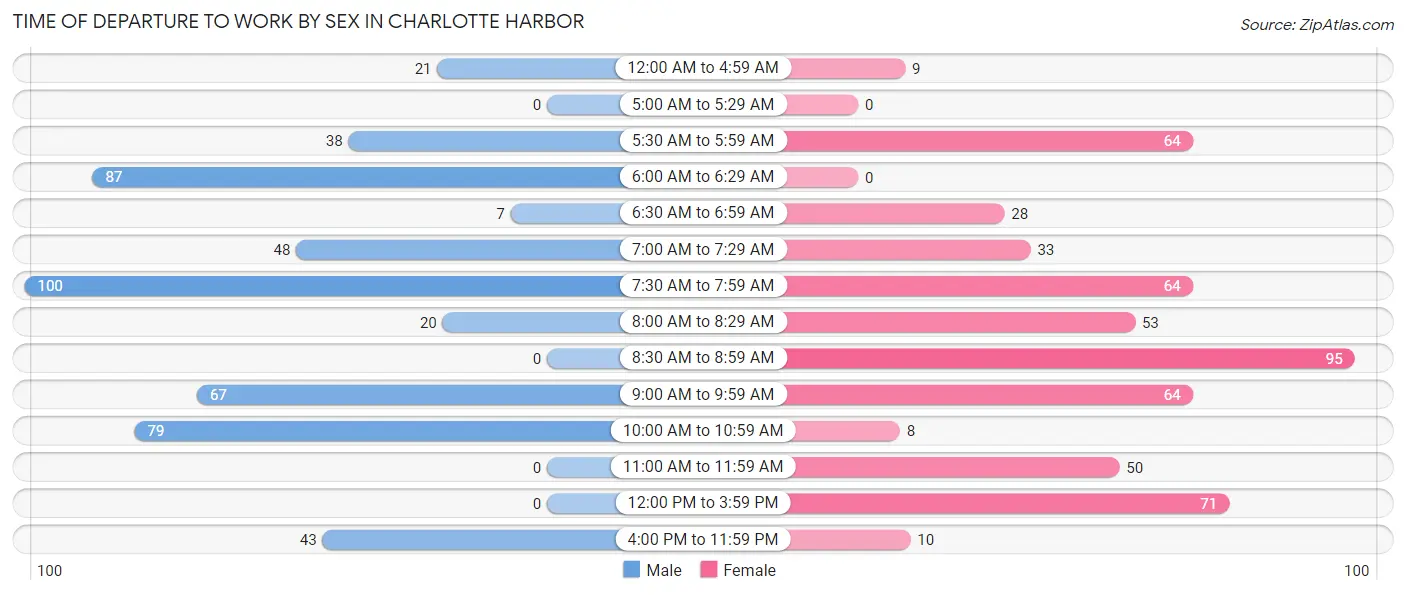
| Time of Departure | Male | Female |
| 12:00 AM to 4:59 AM | 21 (4.1%) | 9 (1.6%) |
| 5:00 AM to 5:29 AM | 0 (0.0%) | 0 (0.0%) |
| 5:30 AM to 5:59 AM | 38 (7.4%) | 64 (11.7%) |
| 6:00 AM to 6:29 AM | 87 (17.1%) | 0 (0.0%) |
| 6:30 AM to 6:59 AM | 7 (1.4%) | 28 (5.1%) |
| 7:00 AM to 7:29 AM | 48 (9.4%) | 33 (6.0%) |
| 7:30 AM to 7:59 AM | 100 (19.6%) | 64 (11.7%) |
| 8:00 AM to 8:29 AM | 20 (3.9%) | 53 (9.7%) |
| 8:30 AM to 8:59 AM | 0 (0.0%) | 95 (17.3%) |
| 9:00 AM to 9:59 AM | 67 (13.1%) | 64 (11.7%) |
| 10:00 AM to 10:59 AM | 79 (15.5%) | 8 (1.5%) |
| 11:00 AM to 11:59 AM | 0 (0.0%) | 50 (9.1%) |
| 12:00 PM to 3:59 PM | 0 (0.0%) | 71 (12.9%) |
| 4:00 PM to 11:59 PM | 43 (8.4%) | 10 (1.8%) |
| Total | 510 (100.0%) | 549 (100.0%) |
Housing Occupancy in Charlotte Harbor
Occupancy by Ownership in Charlotte Harbor
Of the total 2,123 dwellings in Charlotte Harbor, owner-occupied units account for 904 (42.6%), while renter-occupied units make up 1,219 (57.4%).
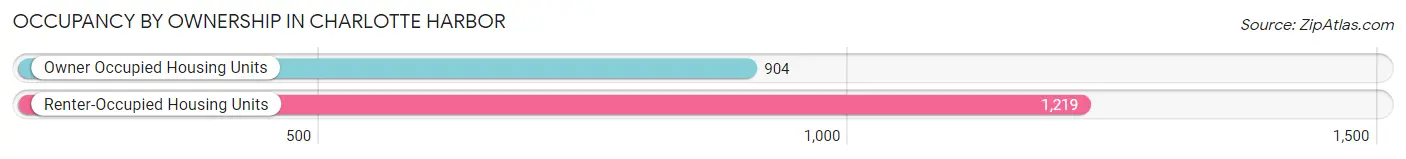
| Occupancy | # Housing Units | % Housing Units |
| Owner Occupied Housing Units | 904 | 42.6% |
| Renter-Occupied Housing Units | 1,219 | 57.4% |
| Total Occupied Housing Units | 2,123 | 100.0% |
Occupancy by Household Size in Charlotte Harbor
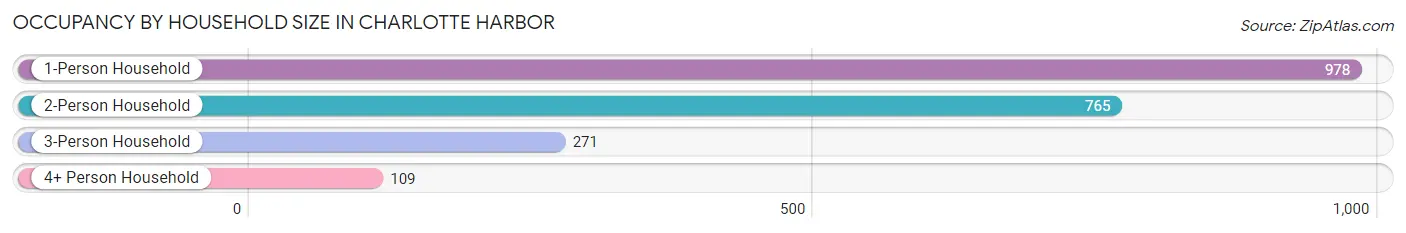
| Household Size | # Housing Units | % Housing Units |
| 1-Person Household | 978 | 46.1% |
| 2-Person Household | 765 | 36.0% |
| 3-Person Household | 271 | 12.8% |
| 4+ Person Household | 109 | 5.1% |
| Total Housing Units | 2,123 | 100.0% |
Occupancy by Ownership by Household Size in Charlotte Harbor
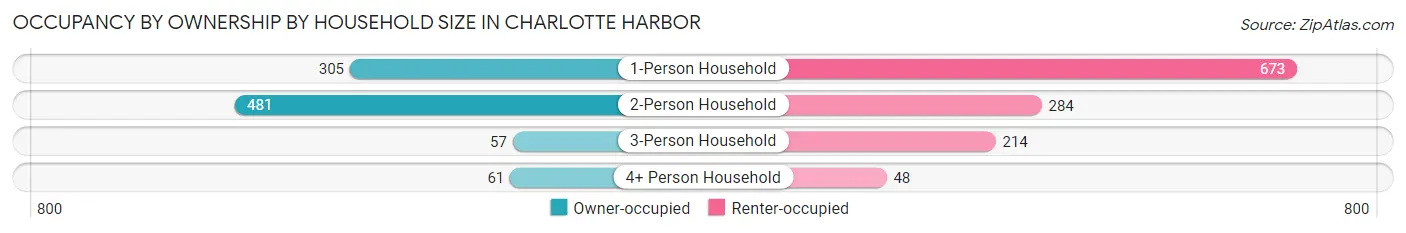
| Household Size | Owner-occupied | Renter-occupied |
| 1-Person Household | 305 (31.2%) | 673 (68.8%) |
| 2-Person Household | 481 (62.9%) | 284 (37.1%) |
| 3-Person Household | 57 (21.0%) | 214 (79.0%) |
| 4+ Person Household | 61 (56.0%) | 48 (44.0%) |
| Total Housing Units | 904 (42.6%) | 1,219 (57.4%) |
Occupancy by Educational Attainment in Charlotte Harbor
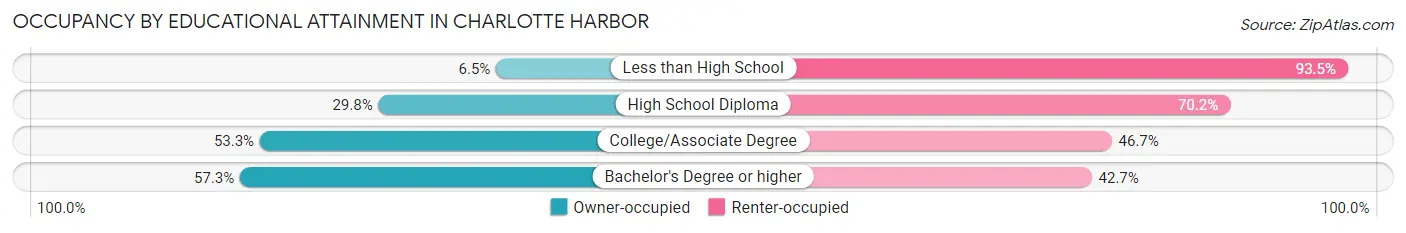
| Household Size | Owner-occupied | Renter-occupied |
| Less than High School | 8 (6.5%) | 115 (93.5%) |
| High School Diploma | 242 (29.8%) | 569 (70.2%) |
| College/Associate Degree | 367 (53.3%) | 321 (46.7%) |
| Bachelor's Degree or higher | 287 (57.3%) | 214 (42.7%) |
Occupancy by Age of Householder in Charlotte Harbor
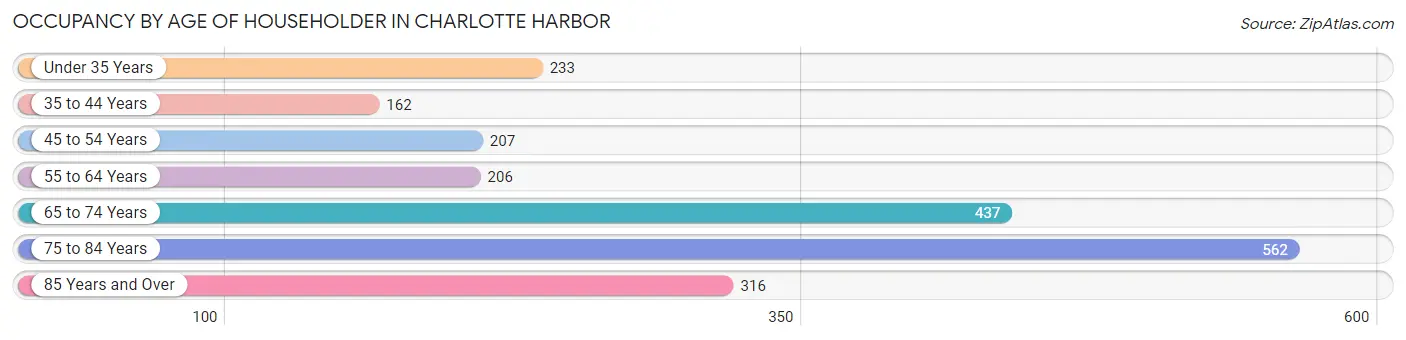
| Age Bracket | # Households | % Households |
| Under 35 Years | 233 | 11.0% |
| 35 to 44 Years | 162 | 7.6% |
| 45 to 54 Years | 207 | 9.8% |
| 55 to 64 Years | 206 | 9.7% |
| 65 to 74 Years | 437 | 20.6% |
| 75 to 84 Years | 562 | 26.5% |
| 85 Years and Over | 316 | 14.9% |
| Total | 2,123 | 100.0% |
Housing Finances in Charlotte Harbor
Median Income by Occupancy in Charlotte Harbor
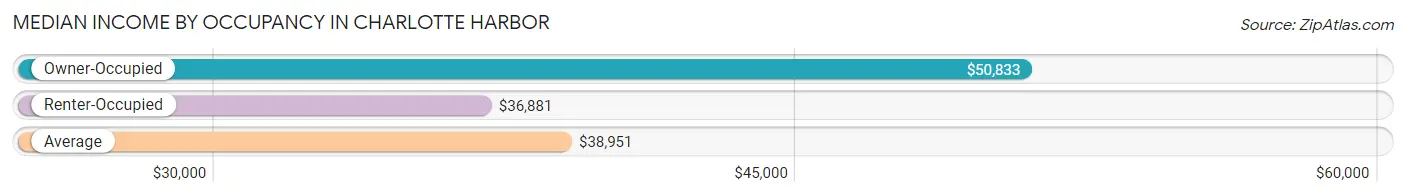
| Occupancy Type | # Households | Median Income |
| Owner-Occupied | 904 (42.6%) | $50,833 |
| Renter-Occupied | 1,219 (57.4%) | $36,881 |
| Average | 2,123 (100.0%) | $38,951 |
Occupancy by Householder Income Bracket in Charlotte Harbor
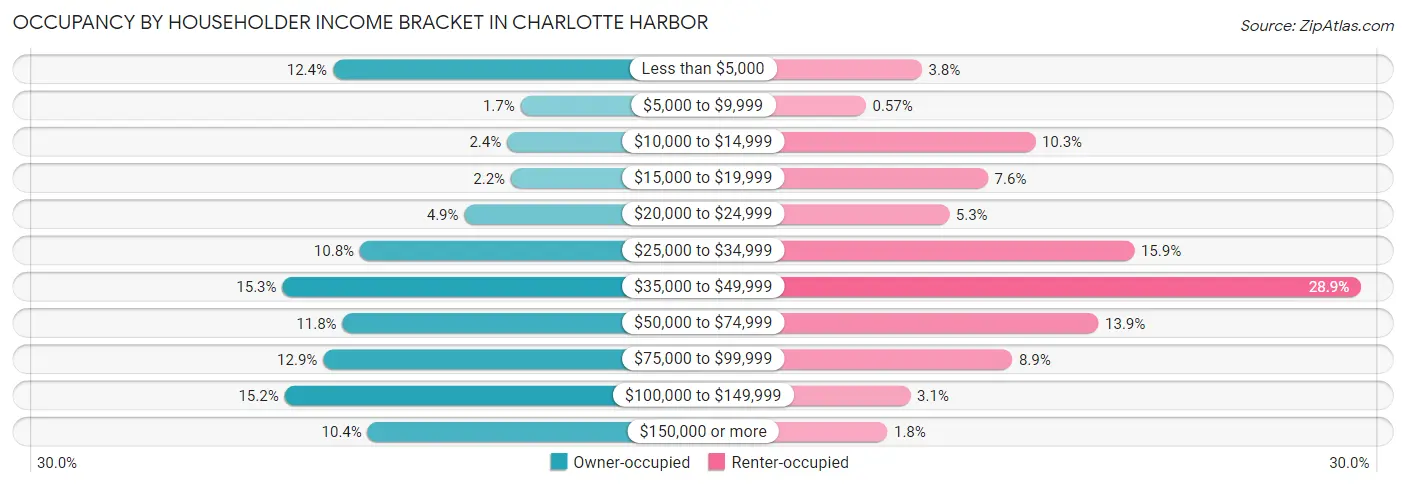
| Income Bracket | Owner-occupied | Renter-occupied |
| Less than $5,000 | 112 (12.4%) | 46 (3.8%) |
| $5,000 to $9,999 | 15 (1.7%) | 7 (0.6%) |
| $10,000 to $14,999 | 22 (2.4%) | 125 (10.2%) |
| $15,000 to $19,999 | 20 (2.2%) | 92 (7.5%) |
| $20,000 to $24,999 | 44 (4.9%) | 65 (5.3%) |
| $25,000 to $34,999 | 98 (10.8%) | 194 (15.9%) |
| $35,000 to $49,999 | 138 (15.3%) | 352 (28.9%) |
| $50,000 to $74,999 | 107 (11.8%) | 169 (13.9%) |
| $75,000 to $99,999 | 117 (12.9%) | 109 (8.9%) |
| $100,000 to $149,999 | 137 (15.1%) | 38 (3.1%) |
| $150,000 or more | 94 (10.4%) | 22 (1.8%) |
| Total | 904 (100.0%) | 1,219 (100.0%) |
Monthly Housing Cost Tiers in Charlotte Harbor
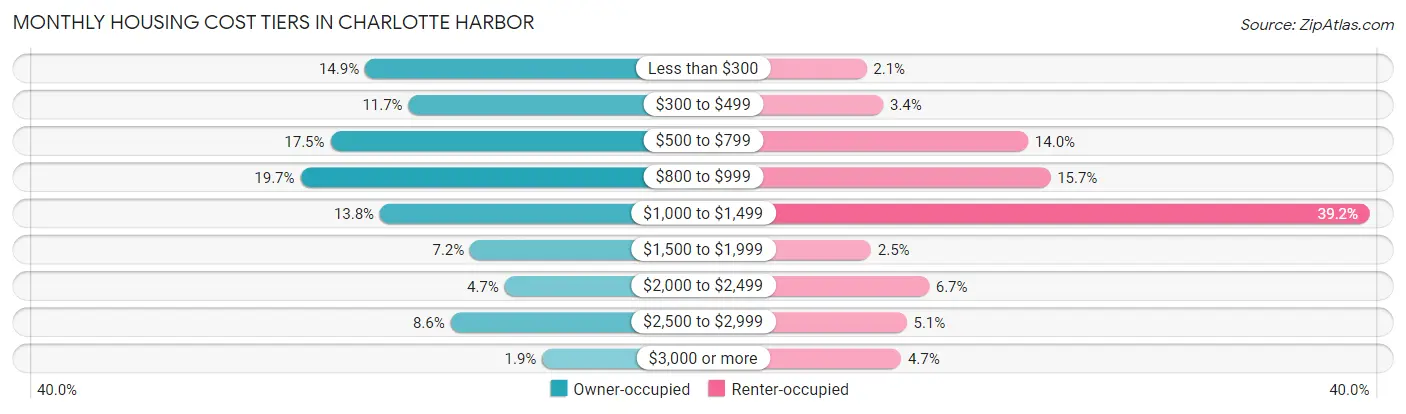
| Monthly Cost | Owner-occupied | Renter-occupied |
| Less than $300 | 135 (14.9%) | 26 (2.1%) |
| $300 to $499 | 106 (11.7%) | 41 (3.4%) |
| $500 to $799 | 158 (17.5%) | 171 (14.0%) |
| $800 to $999 | 178 (19.7%) | 191 (15.7%) |
| $1,000 to $1,499 | 125 (13.8%) | 478 (39.2%) |
| $1,500 to $1,999 | 65 (7.2%) | 30 (2.5%) |
| $2,000 to $2,499 | 42 (4.6%) | 82 (6.7%) |
| $2,500 to $2,999 | 78 (8.6%) | 62 (5.1%) |
| $3,000 or more | 17 (1.9%) | 57 (4.7%) |
| Total | 904 (100.0%) | 1,219 (100.0%) |
Physical Housing Characteristics in Charlotte Harbor
Housing Structures in Charlotte Harbor
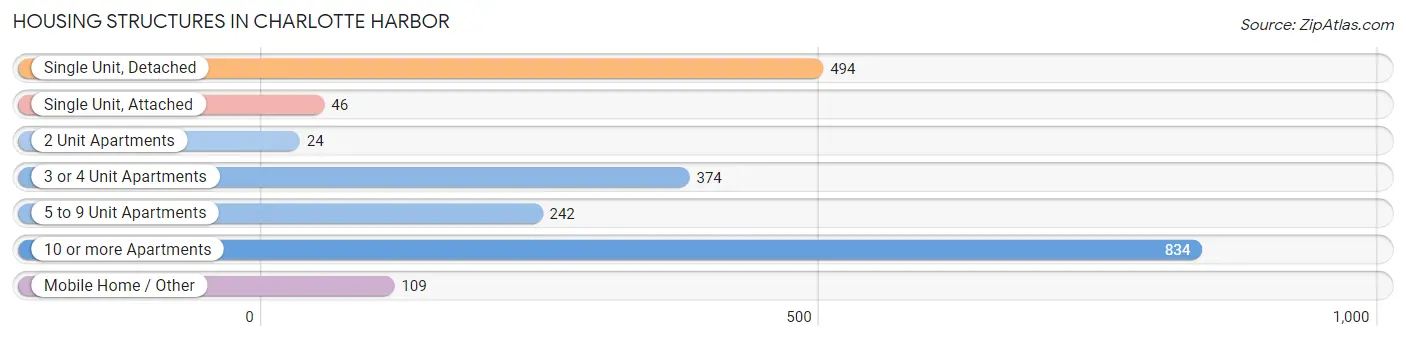
| Structure Type | # Housing Units | % Housing Units |
| Single Unit, Detached | 494 | 23.3% |
| Single Unit, Attached | 46 | 2.2% |
| 2 Unit Apartments | 24 | 1.1% |
| 3 or 4 Unit Apartments | 374 | 17.6% |
| 5 to 9 Unit Apartments | 242 | 11.4% |
| 10 or more Apartments | 834 | 39.3% |
| Mobile Home / Other | 109 | 5.1% |
| Total | 2,123 | 100.0% |
Housing Structures by Occupancy in Charlotte Harbor
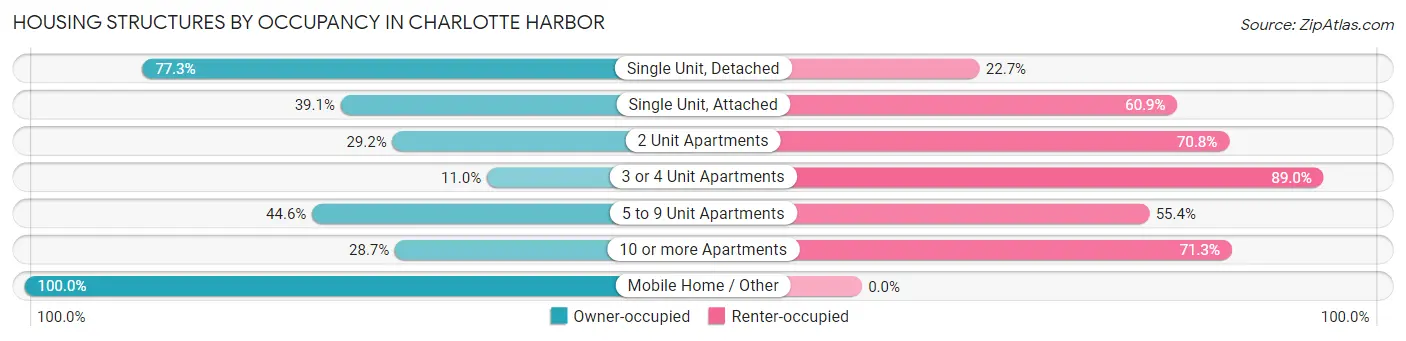
| Structure Type | Owner-occupied | Renter-occupied |
| Single Unit, Detached | 382 (77.3%) | 112 (22.7%) |
| Single Unit, Attached | 18 (39.1%) | 28 (60.9%) |
| 2 Unit Apartments | 7 (29.2%) | 17 (70.8%) |
| 3 or 4 Unit Apartments | 41 (11.0%) | 333 (89.0%) |
| 5 to 9 Unit Apartments | 108 (44.6%) | 134 (55.4%) |
| 10 or more Apartments | 239 (28.7%) | 595 (71.3%) |
| Mobile Home / Other | 109 (100.0%) | 0 (0.0%) |
| Total | 904 (42.6%) | 1,219 (57.4%) |
Housing Structures by Number of Rooms in Charlotte Harbor
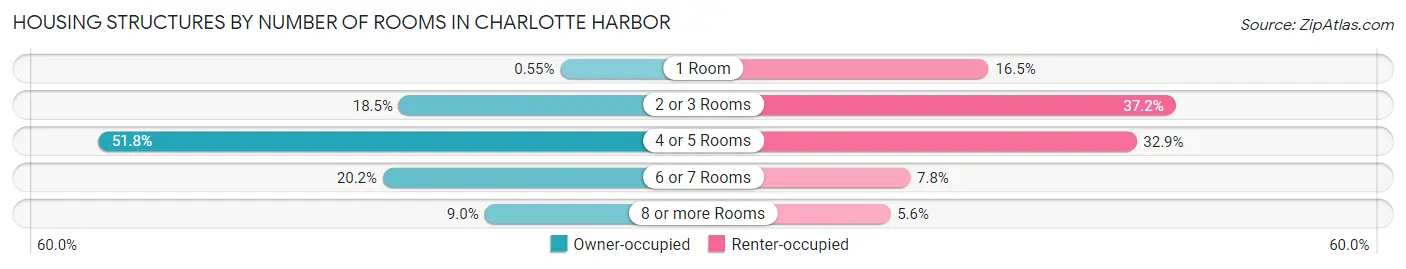
| Number of Rooms | Owner-occupied | Renter-occupied |
| 1 Room | 5 (0.5%) | 201 (16.5%) |
| 2 or 3 Rooms | 167 (18.5%) | 454 (37.2%) |
| 4 or 5 Rooms | 468 (51.8%) | 401 (32.9%) |
| 6 or 7 Rooms | 183 (20.2%) | 95 (7.8%) |
| 8 or more Rooms | 81 (9.0%) | 68 (5.6%) |
| Total | 904 (100.0%) | 1,219 (100.0%) |
Housing Structure by Heating Type in Charlotte Harbor
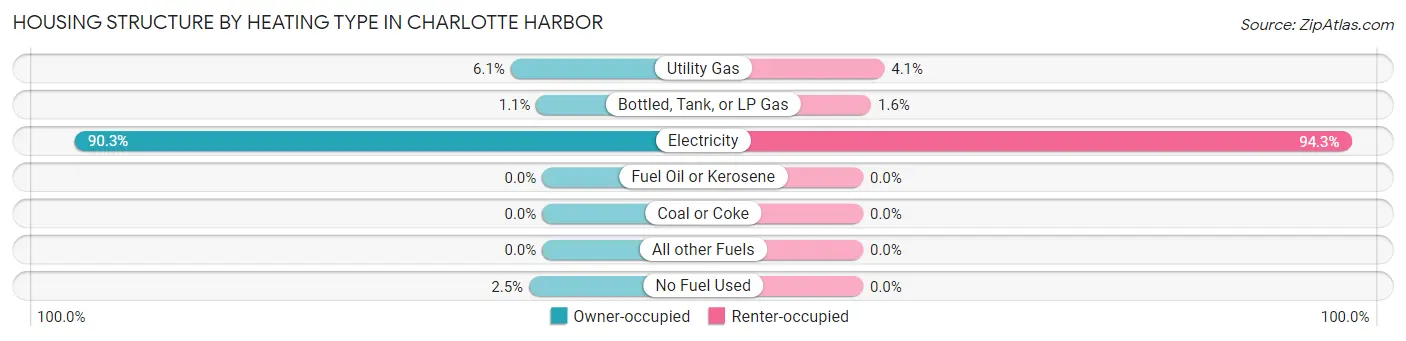
| Heating Type | Owner-occupied | Renter-occupied |
| Utility Gas | 55 (6.1%) | 50 (4.1%) |
| Bottled, Tank, or LP Gas | 10 (1.1%) | 19 (1.6%) |
| Electricity | 816 (90.3%) | 1,150 (94.3%) |
| Fuel Oil or Kerosene | 0 (0.0%) | 0 (0.0%) |
| Coal or Coke | 0 (0.0%) | 0 (0.0%) |
| All other Fuels | 0 (0.0%) | 0 (0.0%) |
| No Fuel Used | 23 (2.5%) | 0 (0.0%) |
| Total | 904 (100.0%) | 1,219 (100.0%) |
Household Vehicle Usage in Charlotte Harbor
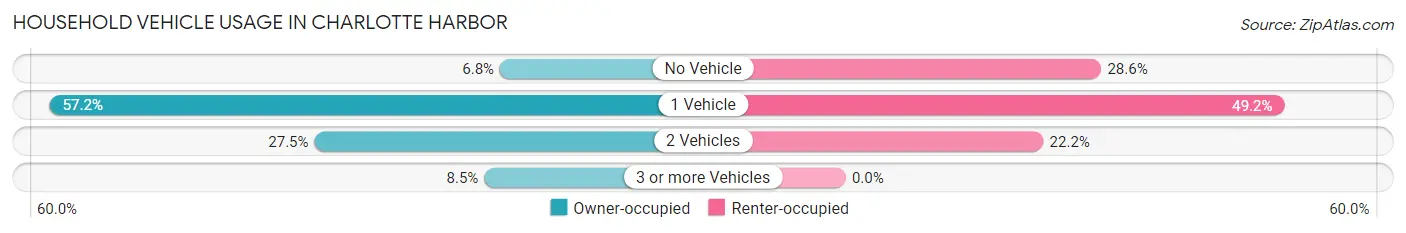
| Vehicles per Household | Owner-occupied | Renter-occupied |
| No Vehicle | 61 (6.8%) | 349 (28.6%) |
| 1 Vehicle | 517 (57.2%) | 600 (49.2%) |
| 2 Vehicles | 249 (27.5%) | 270 (22.2%) |
| 3 or more Vehicles | 77 (8.5%) | 0 (0.0%) |
| Total | 904 (100.0%) | 1,219 (100.0%) |
Real Estate & Mortgages in Charlotte Harbor
Real Estate and Mortgage Overview in Charlotte Harbor
| Characteristic | Without Mortgage | With Mortgage |
| Housing Units | 593 | 311 |
| Median Property Value | $123,700 | $226,300 |
| Median Household Income | $48,665 | $52 |
| Monthly Housing Costs | $596 | $17 |
| Real Estate Taxes | $1,758 | $0 |
Property Value by Mortgage Status in Charlotte Harbor
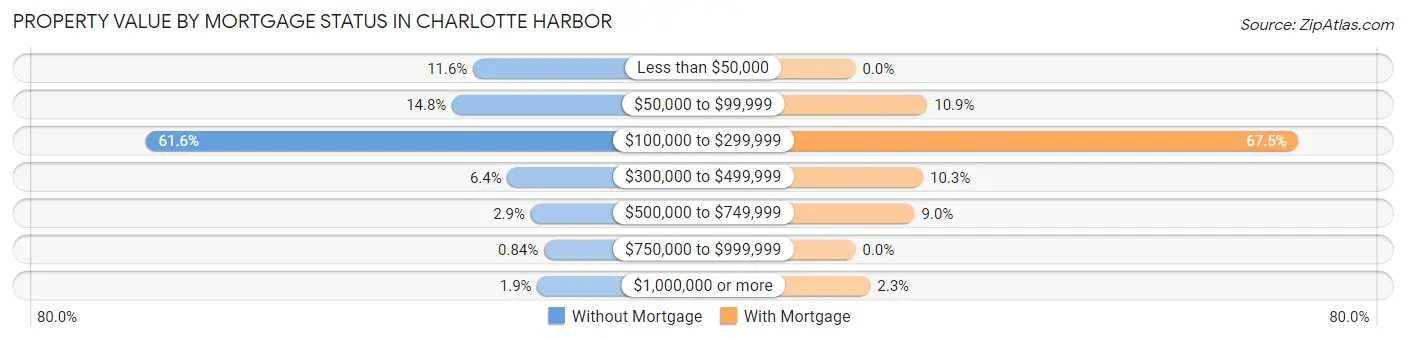
| Property Value | Without Mortgage | With Mortgage |
| Less than $50,000 | 69 (11.6%) | 0 (0.0%) |
| $50,000 to $99,999 | 88 (14.8%) | 34 (10.9%) |
| $100,000 to $299,999 | 365 (61.6%) | 210 (67.5%) |
| $300,000 to $499,999 | 38 (6.4%) | 32 (10.3%) |
| $500,000 to $749,999 | 17 (2.9%) | 28 (9.0%) |
| $750,000 to $999,999 | 5 (0.8%) | 0 (0.0%) |
| $1,000,000 or more | 11 (1.8%) | 7 (2.2%) |
| Total | 593 (100.0%) | 311 (100.0%) |
Household Income by Mortgage Status in Charlotte Harbor
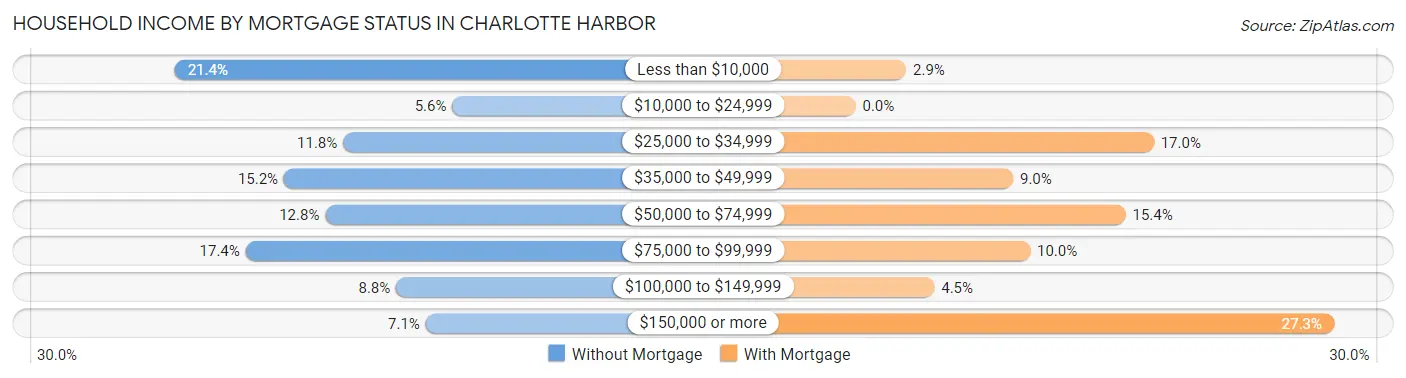
| Household Income | Without Mortgage | With Mortgage |
| Less than $10,000 | 127 (21.4%) | 9 (2.9%) |
| $10,000 to $24,999 | 33 (5.6%) | 0 (0.0%) |
| $25,000 to $34,999 | 70 (11.8%) | 53 (17.0%) |
| $35,000 to $49,999 | 90 (15.2%) | 28 (9.0%) |
| $50,000 to $74,999 | 76 (12.8%) | 48 (15.4%) |
| $75,000 to $99,999 | 103 (17.4%) | 31 (10.0%) |
| $100,000 to $149,999 | 52 (8.8%) | 14 (4.5%) |
| $150,000 or more | 42 (7.1%) | 85 (27.3%) |
| Total | 593 (100.0%) | 311 (100.0%) |
Property Value to Household Income Ratio in Charlotte Harbor
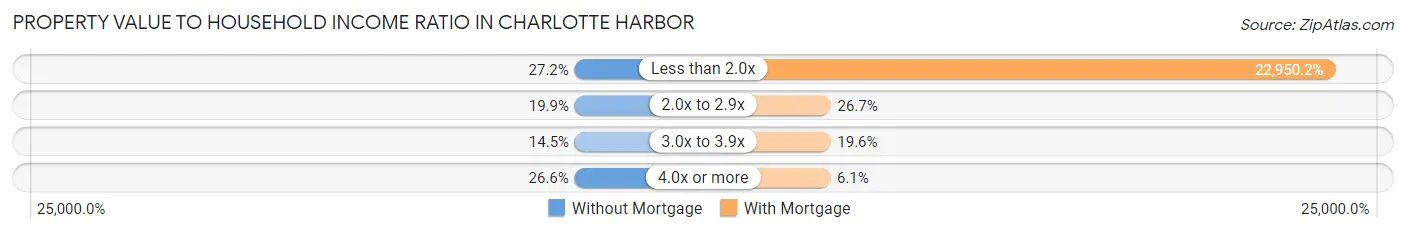
| Value-to-Income Ratio | Without Mortgage | With Mortgage |
| Less than 2.0x | 161 (27.2%) | 71,375 (22,950.2%) |
| 2.0x to 2.9x | 118 (19.9%) | 83 (26.7%) |
| 3.0x to 3.9x | 86 (14.5%) | 61 (19.6%) |
| 4.0x or more | 158 (26.6%) | 19 (6.1%) |
| Total | 593 (100.0%) | 311 (100.0%) |
Real Estate Taxes by Mortgage Status in Charlotte Harbor
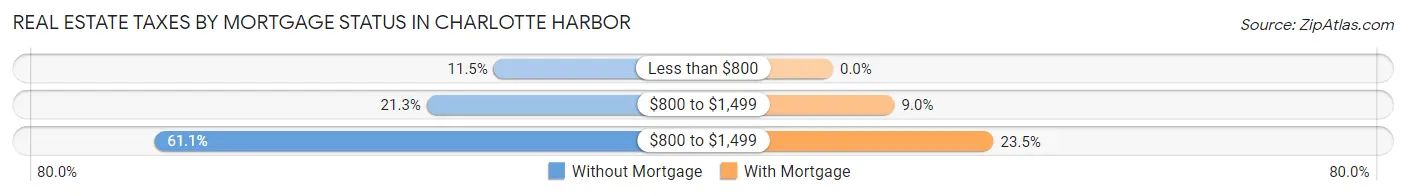
| Property Taxes | Without Mortgage | With Mortgage |
| Less than $800 | 68 (11.5%) | 0 (0.0%) |
| $800 to $1,499 | 126 (21.2%) | 28 (9.0%) |
| $800 to $1,499 | 362 (61.1%) | 73 (23.5%) |
| Total | 593 (100.0%) | 311 (100.0%) |
Health & Disability in Charlotte Harbor
Health Insurance Coverage by Age in Charlotte Harbor
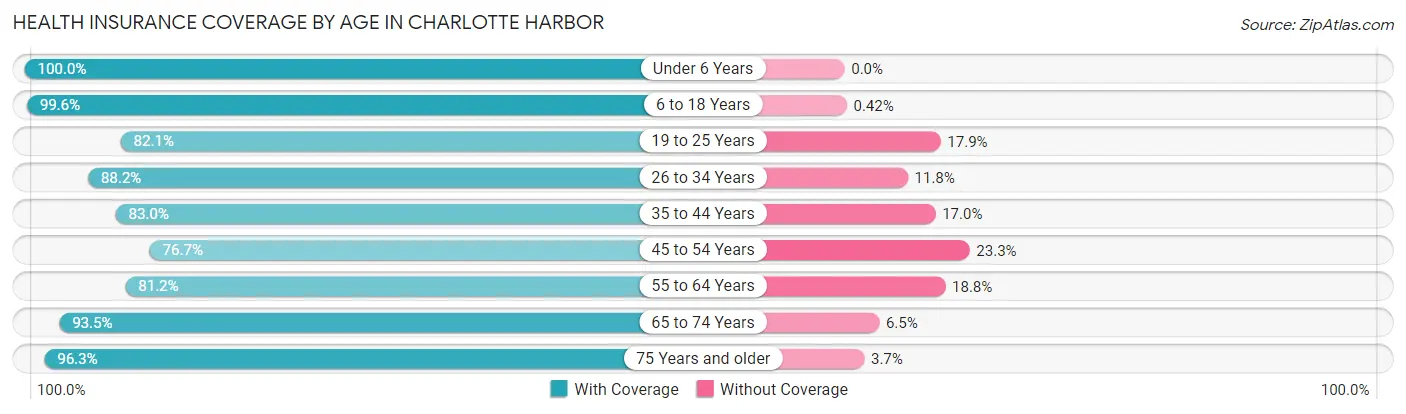
| Age Bracket | With Coverage | Without Coverage |
| Under 6 Years | 278 (100.0%) | 0 (0.0%) |
| 6 to 18 Years | 238 (99.6%) | 1 (0.4%) |
| 19 to 25 Years | 142 (82.1%) | 31 (17.9%) |
| 26 to 34 Years | 321 (88.2%) | 43 (11.8%) |
| 35 to 44 Years | 186 (83.0%) | 38 (17.0%) |
| 45 to 54 Years | 207 (76.7%) | 63 (23.3%) |
| 55 to 64 Years | 311 (81.2%) | 72 (18.8%) |
| 65 to 74 Years | 652 (93.5%) | 45 (6.5%) |
| 75 Years and older | 1,283 (96.3%) | 49 (3.7%) |
| Total | 3,618 (91.4%) | 342 (8.6%) |
Health Insurance Coverage by Citizenship Status in Charlotte Harbor
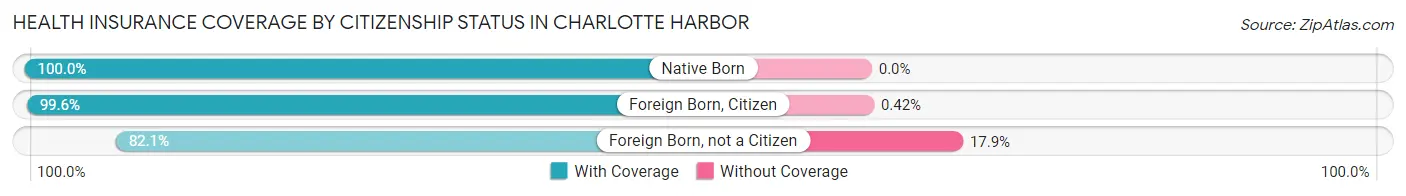
| Citizenship Status | With Coverage | Without Coverage |
| Native Born | 278 (100.0%) | 0 (0.0%) |
| Foreign Born, Citizen | 238 (99.6%) | 1 (0.4%) |
| Foreign Born, not a Citizen | 142 (82.1%) | 31 (17.9%) |
Health Insurance Coverage by Household Income in Charlotte Harbor
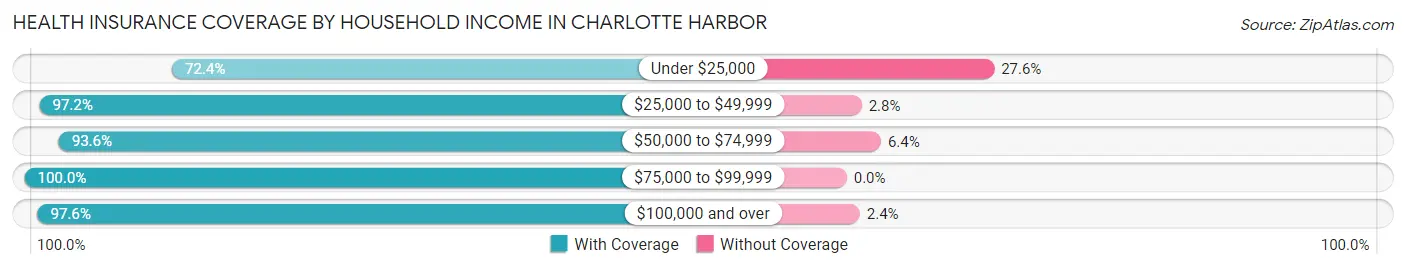
| Household Income | With Coverage | Without Coverage |
| Under $25,000 | 600 (72.4%) | 229 (27.6%) |
| $25,000 to $49,999 | 1,352 (97.2%) | 39 (2.8%) |
| $50,000 to $74,999 | 511 (93.6%) | 35 (6.4%) |
| $75,000 to $99,999 | 490 (100.0%) | 0 (0.0%) |
| $100,000 and over | 640 (97.6%) | 16 (2.4%) |
Public vs Private Health Insurance Coverage by Age in Charlotte Harbor
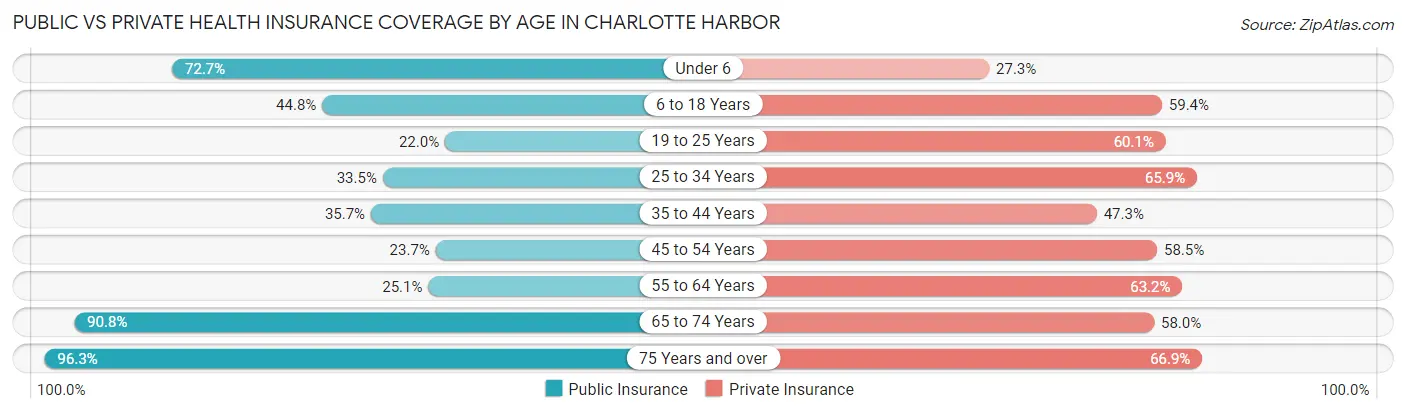
| Age Bracket | Public Insurance | Private Insurance |
| Under 6 | 202 (72.7%) | 76 (27.3%) |
| 6 to 18 Years | 107 (44.8%) | 142 (59.4%) |
| 19 to 25 Years | 38 (22.0%) | 104 (60.1%) |
| 25 to 34 Years | 122 (33.5%) | 240 (65.9%) |
| 35 to 44 Years | 80 (35.7%) | 106 (47.3%) |
| 45 to 54 Years | 64 (23.7%) | 158 (58.5%) |
| 55 to 64 Years | 96 (25.1%) | 242 (63.2%) |
| 65 to 74 Years | 633 (90.8%) | 404 (58.0%) |
| 75 Years and over | 1,283 (96.3%) | 891 (66.9%) |
| Total | 2,625 (66.3%) | 2,363 (59.7%) |
Disability Status by Sex by Age in Charlotte Harbor
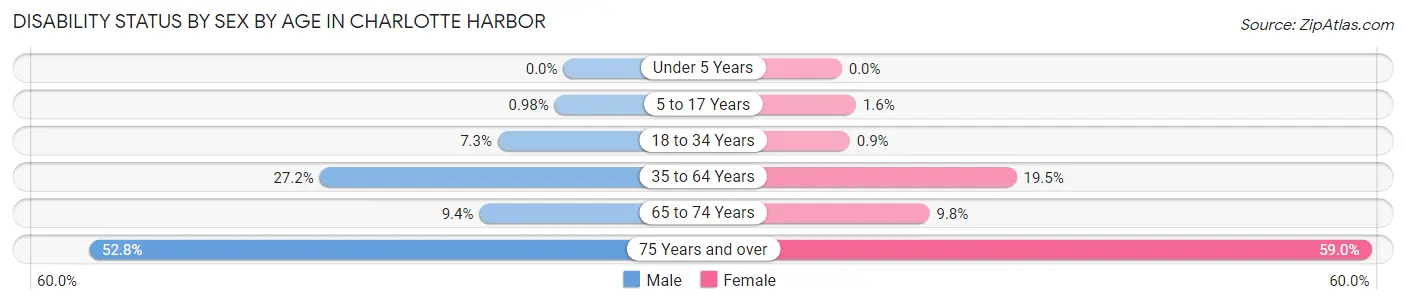
| Age Bracket | Male | Female |
| Under 5 Years | 0 (0.0%) | 0 (0.0%) |
| 5 to 17 Years | 1 (1.0%) | 3 (1.6%) |
| 18 to 34 Years | 23 (7.3%) | 2 (0.9%) |
| 35 to 64 Years | 107 (27.2%) | 94 (19.5%) |
| 65 to 74 Years | 25 (9.4%) | 42 (9.8%) |
| 75 Years and over | 329 (52.8%) | 418 (59.0%) |
Disability Class by Sex by Age in Charlotte Harbor
Disability Class: Hearing Difficulty
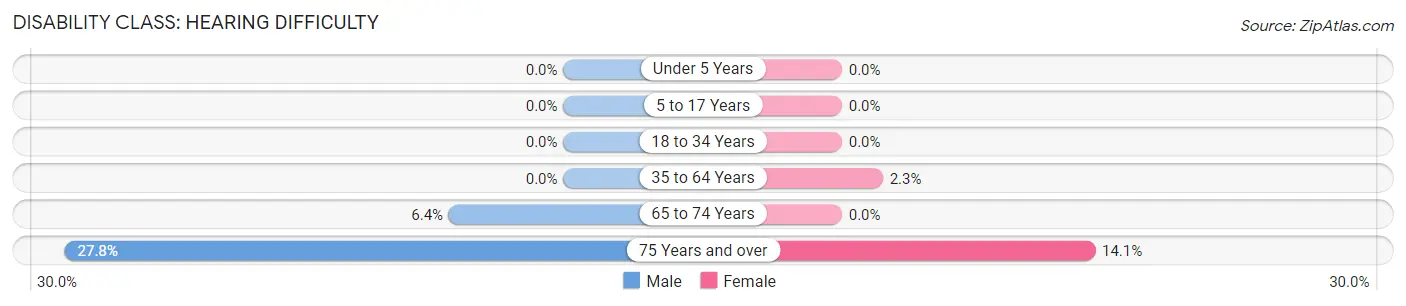
| Age Bracket | Male | Female |
| Under 5 Years | 0 (0.0%) | 0 (0.0%) |
| 5 to 17 Years | 0 (0.0%) | 0 (0.0%) |
| 18 to 34 Years | 0 (0.0%) | 0 (0.0%) |
| 35 to 64 Years | 0 (0.0%) | 11 (2.3%) |
| 65 to 74 Years | 17 (6.4%) | 0 (0.0%) |
| 75 Years and over | 173 (27.8%) | 100 (14.1%) |
Disability Class: Vision Difficulty
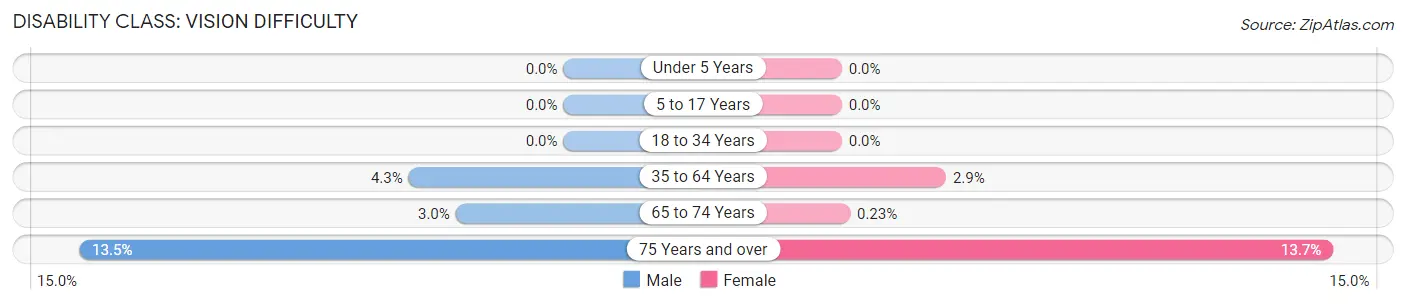
| Age Bracket | Male | Female |
| Under 5 Years | 0 (0.0%) | 0 (0.0%) |
| 5 to 17 Years | 0 (0.0%) | 0 (0.0%) |
| 18 to 34 Years | 0 (0.0%) | 0 (0.0%) |
| 35 to 64 Years | 17 (4.3%) | 14 (2.9%) |
| 65 to 74 Years | 8 (3.0%) | 1 (0.2%) |
| 75 Years and over | 84 (13.5%) | 97 (13.7%) |
Disability Class: Cognitive Difficulty
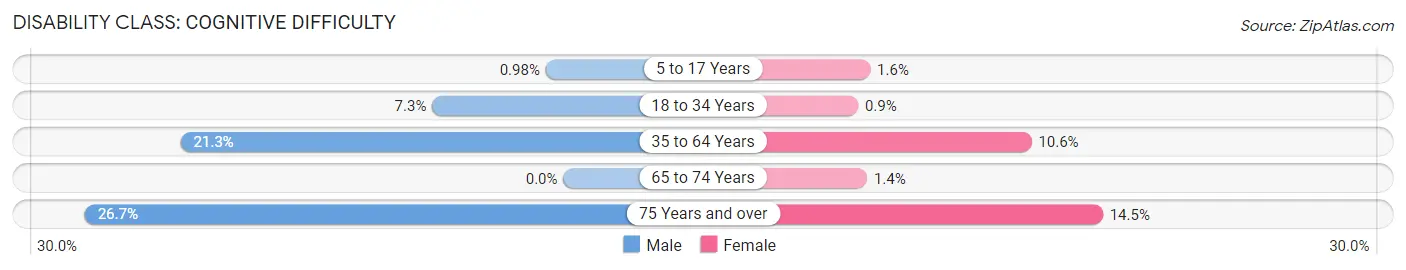
| Age Bracket | Male | Female |
| 5 to 17 Years | 1 (1.0%) | 3 (1.6%) |
| 18 to 34 Years | 23 (7.3%) | 2 (0.9%) |
| 35 to 64 Years | 84 (21.3%) | 51 (10.6%) |
| 65 to 74 Years | 0 (0.0%) | 6 (1.4%) |
| 75 Years and over | 166 (26.7%) | 103 (14.5%) |
Disability Class: Ambulatory Difficulty
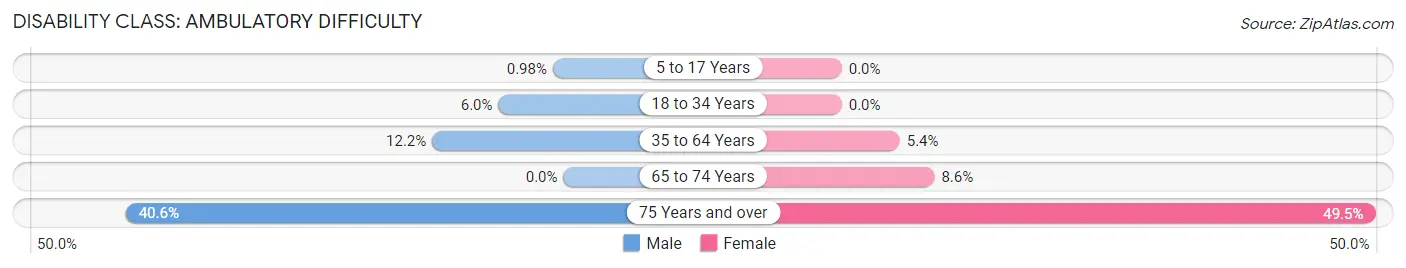
| Age Bracket | Male | Female |
| 5 to 17 Years | 1 (1.0%) | 0 (0.0%) |
| 18 to 34 Years | 19 (6.0%) | 0 (0.0%) |
| 35 to 64 Years | 48 (12.2%) | 26 (5.4%) |
| 65 to 74 Years | 0 (0.0%) | 37 (8.6%) |
| 75 Years and over | 253 (40.6%) | 351 (49.5%) |
Disability Class: Self-Care Difficulty
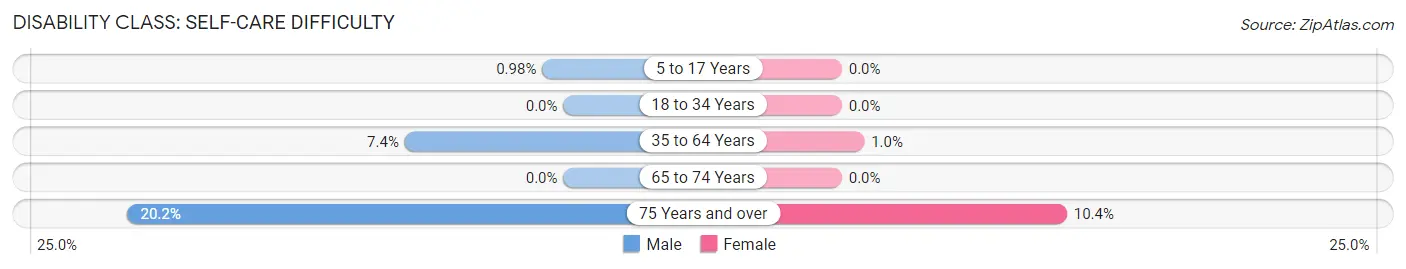
| Age Bracket | Male | Female |
| 5 to 17 Years | 1 (1.0%) | 0 (0.0%) |
| 18 to 34 Years | 0 (0.0%) | 0 (0.0%) |
| 35 to 64 Years | 29 (7.4%) | 5 (1.0%) |
| 65 to 74 Years | 0 (0.0%) | 0 (0.0%) |
| 75 Years and over | 126 (20.2%) | 74 (10.4%) |
Technology Access in Charlotte Harbor
Computing Device Access in Charlotte Harbor
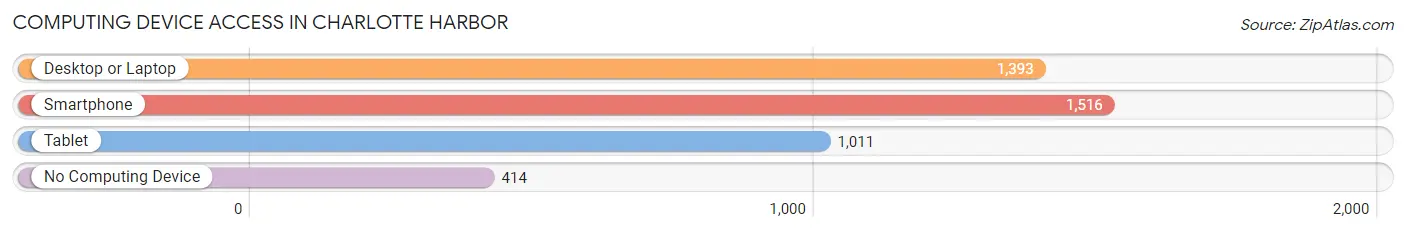
| Device Type | # Households | % Households |
| Desktop or Laptop | 1,393 | 65.6% |
| Smartphone | 1,516 | 71.4% |
| Tablet | 1,011 | 47.6% |
| No Computing Device | 414 | 19.5% |
| Total | 2,123 | 100.0% |
Internet Access in Charlotte Harbor
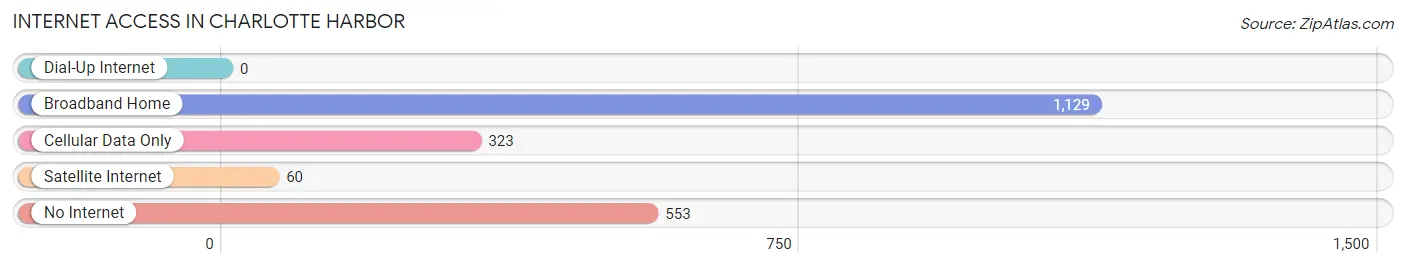
| Internet Type | # Households | % Households |
| Dial-Up Internet | 0 | 0.0% |
| Broadband Home | 1,129 | 53.2% |
| Cellular Data Only | 323 | 15.2% |
| Satellite Internet | 60 | 2.8% |
| No Internet | 553 | 26.1% |
| Total | 2,123 | 100.0% |
Charlotte Harbor Summary
Charlotte Harbor is a large estuary located in Southwest Florida, between Sarasota and Fort Myers. It is part of the Charlotte Harbor Estuary System, which includes the Peace River, Myakka River, and Caloosahatchee River. The estuary is fed by numerous freshwater tributaries, including the Peace River, Myakka River, and Caloosahatchee River. The estuary is also connected to the Gulf of Mexico via the Charlotte Harbor Pass.
Geography
Charlotte Harbor is located in Charlotte County, Florida, and is bordered by the cities of Punta Gorda, Port Charlotte, and Englewood. The estuary covers an area of approximately 1,400 square miles, making it the second largest estuary in the state of Florida. The estuary is divided into two main sections: the northern section, which is fed by the Peace River, and the southern section, which is fed by the Myakka River and Caloosahatchee River. The estuary is also connected to the Gulf of Mexico via the Charlotte Harbor Pass.
The estuary is home to a variety of habitats, including mangrove forests, seagrass beds, and salt marshes. The estuary is also home to a variety of wildlife, including manatees, dolphins, sea turtles, and a variety of fish species.
History
The area now known as Charlotte Harbor has been inhabited by humans for thousands of years. The first known inhabitants of the area were the Calusa Indians, who lived in the area for centuries before the arrival of Europeans. The first Europeans to explore the area were Spanish explorers, who arrived in the late 1500s.
In the late 1800s, the area was developed for agriculture and fishing. The area was also home to a number of small towns, including Punta Gorda, Port Charlotte, and Englewood.
In the early 1900s, the area began to attract tourists, and the area’s population began to grow. In the 1950s, the area was designated as a protected estuary, and the Charlotte Harbor Estuary System was established.
Economy
The economy of Charlotte Harbor is largely based on tourism, fishing, and agriculture. The area is home to a number of resorts, marinas, and other tourist attractions. The area is also home to a number of commercial fishing operations, and is a popular destination for recreational fishing.
Agriculture is also an important part of the local economy. The area is home to a number of citrus groves, as well as vegetable and dairy farms.
Demographics
As of the 2010 census, the population of Charlotte Harbor was 159,978. The population is largely white (83.3%), with smaller percentages of African American (7.7%), Hispanic (6.2%), and Asian (2.8%) residents. The median household income in the area is $45,837, and the median age is 44.
Conclusion
Charlotte Harbor is a large estuary located in Southwest Florida, between Sarasota and Fort Myers. The estuary is home to a variety of habitats, including mangrove forests, seagrass beds, and salt marshes. The area has a long history of human habitation, and the economy is largely based on tourism, fishing, and agriculture. The population of Charlotte Harbor is largely white, with smaller percentages of African American, Hispanic, and Asian residents.
Common Questions
What is Per Capita Income in Charlotte Harbor?
Per Capita income in Charlotte Harbor is $29,174.
What is the Median Family Income in Charlotte Harbor?
Median Family Income in Charlotte Harbor is $55,484.
What is the Median Household income in Charlotte Harbor?
Median Household Income in Charlotte Harbor is $38,951.
What is Income or Wage Gap in Charlotte Harbor?
Income or Wage Gap in Charlotte Harbor is 6.9%.
Women in Charlotte Harbor earn 93.1 cents for every dollar earned by a man.
What is Inequality or Gini Index in Charlotte Harbor?
Inequality or Gini Index in Charlotte Harbor is 0.44.
What is the Total Population of Charlotte Harbor?
Total Population of Charlotte Harbor is 4,516.
What is the Total Male Population of Charlotte Harbor?
Total Male Population of Charlotte Harbor is 2,111.
What is the Total Female Population of Charlotte Harbor?
Total Female Population of Charlotte Harbor is 2,405.
What is the Ratio of Males per 100 Females in Charlotte Harbor?
There are 87.78 Males per 100 Females in Charlotte Harbor.
What is the Ratio of Females per 100 Males in Charlotte Harbor?
There are 113.93 Females per 100 Males in Charlotte Harbor.
What is the Median Population Age in Charlotte Harbor?
Median Population Age in Charlotte Harbor is 67.4 Years.
What is the Average Family Size in Charlotte Harbor
Average Family Size in Charlotte Harbor is 2.5 People.
What is the Average Household Size in Charlotte Harbor
Average Household Size in Charlotte Harbor is 1.8 People.
How Large is the Labor Force in Charlotte Harbor?
There are 1,172 People in the Labor Forcein in Charlotte Harbor.
What is the Percentage of People in the Labor Force in Charlotte Harbor?
29.3% of People are in the Labor Force in Charlotte Harbor.
What is the Unemployment Rate in Charlotte Harbor?
Unemployment Rate in Charlotte Harbor is 2.6%.