Harold, FL Map & Demographics
Harold Map
Harold Overview
$41,275
PER CAPITA INCOME
$108,947
AVG FAMILY INCOME
11.0%
WAGE / INCOME GAP [ % ]
89.0¢/ $1
WAGE / INCOME GAP [ $ ]
0.44
INEQUALITY / GINI INDEX
863
TOTAL POPULATION
424
MALE POPULATION
439
FEMALE POPULATION
96.58
MALES / 100 FEMALES
103.54
FEMALES / 100 MALES
32.6
MEDIAN AGE
4.2
AVG FAMILY SIZE
3.5
AVG HOUSEHOLD SIZE
449
LABOR FORCE [ PEOPLE ]
66.7%
PERCENT IN LABOR FORCE
12.9%
UNEMPLOYMENT RATE
Income in Harold
Income Overview in Harold
| Characteristic | Number | Measure |
| Per Capita Income | 863 | $41,275 |
| Median Family Income | 196 | $108,947 |
| Mean Family Income | 196 | $153,984 |
| Median Household Income | 243 | $0 |
| Mean Household Income | 243 | $132,822 |
| Income Deficit | 196 | $0 |
| Wage / Income Gap (%) | 863 | 11.04% |
| Wage / Income Gap ($) | 863 | 88.96¢ per $1 |
| Gini / Inequality Index | 863 | 0.44 |
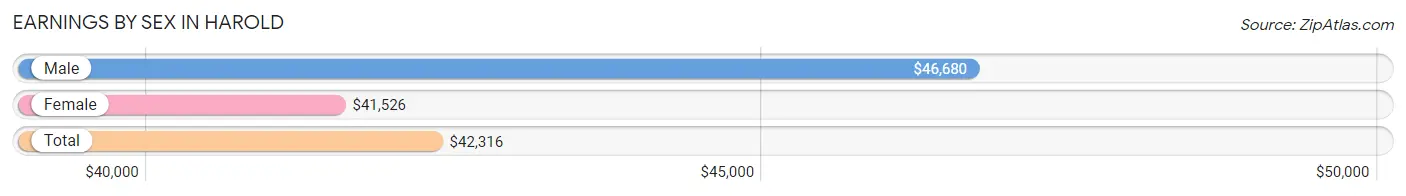
Earnings by Sex in Harold
Average Earnings in Harold are $42,316, $46,680 for men and $41,526 for women, a difference of 11.0%.
| Sex | Number | Average Earnings |
| Male | 307 (65.3%) | $46,680 |
| Female | 163 (34.7%) | $41,526 |
| Total | 470 (100.0%) | $42,316 |
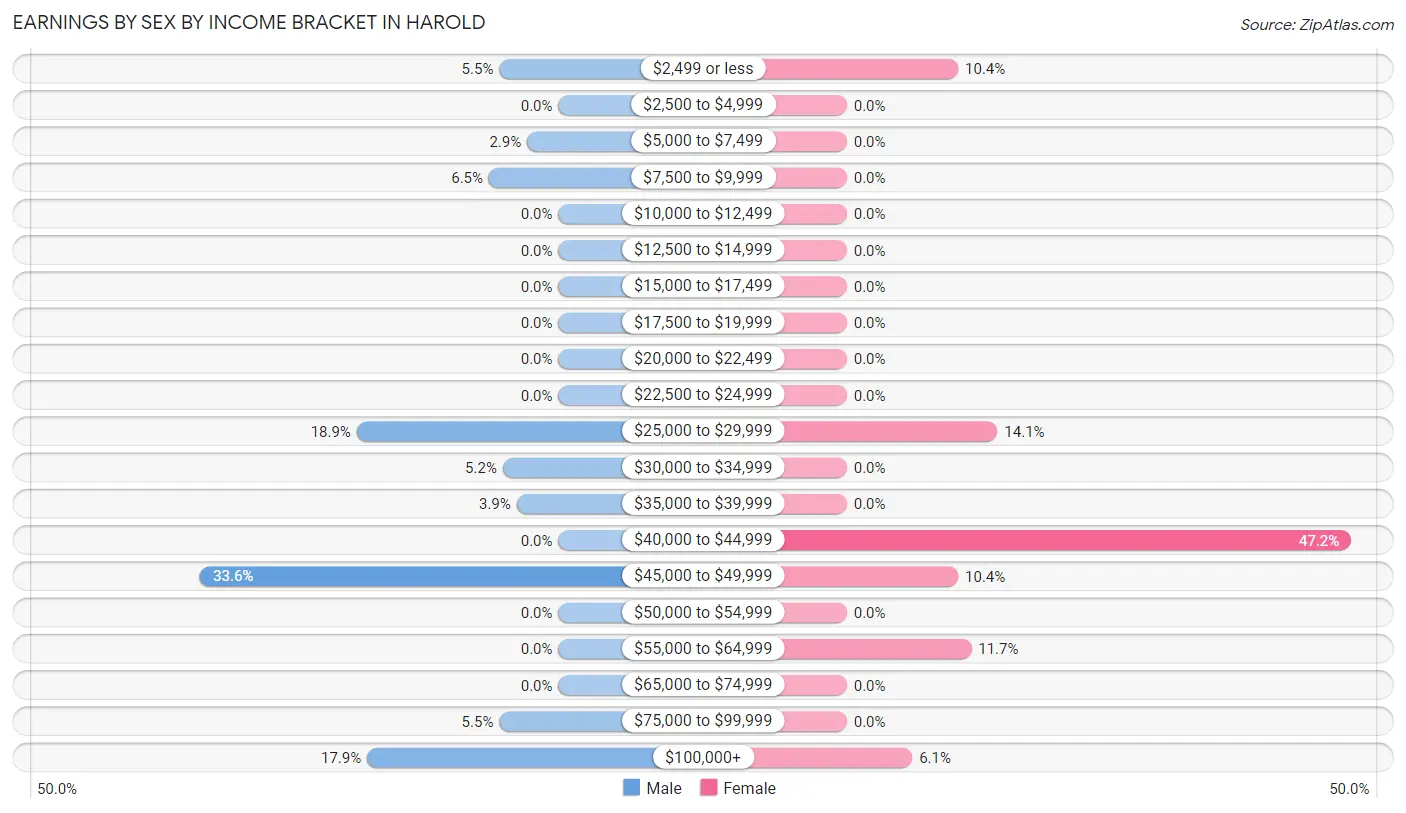
Earnings by Sex by Income Bracket in Harold
The most common earnings brackets in Harold are $45,000 to $49,999 for men (103 | 33.6%) and $40,000 to $44,999 for women (77 | 47.2%).
| Income | Male | Female |
| $2,499 or less | 17 (5.5%) | 17 (10.4%) |
| $2,500 to $4,999 | 0 (0.0%) | 0 (0.0%) |
| $5,000 to $7,499 | 9 (2.9%) | 0 (0.0%) |
| $7,500 to $9,999 | 20 (6.5%) | 0 (0.0%) |
| $10,000 to $12,499 | 0 (0.0%) | 0 (0.0%) |
| $12,500 to $14,999 | 0 (0.0%) | 0 (0.0%) |
| $15,000 to $17,499 | 0 (0.0%) | 0 (0.0%) |
| $17,500 to $19,999 | 0 (0.0%) | 0 (0.0%) |
| $20,000 to $22,499 | 0 (0.0%) | 0 (0.0%) |
| $22,500 to $24,999 | 0 (0.0%) | 0 (0.0%) |
| $25,000 to $29,999 | 58 (18.9%) | 23 (14.1%) |
| $30,000 to $34,999 | 16 (5.2%) | 0 (0.0%) |
| $35,000 to $39,999 | 12 (3.9%) | 0 (0.0%) |
| $40,000 to $44,999 | 0 (0.0%) | 77 (47.2%) |
| $45,000 to $49,999 | 103 (33.6%) | 17 (10.4%) |
| $50,000 to $54,999 | 0 (0.0%) | 0 (0.0%) |
| $55,000 to $64,999 | 0 (0.0%) | 19 (11.7%) |
| $65,000 to $74,999 | 0 (0.0%) | 0 (0.0%) |
| $75,000 to $99,999 | 17 (5.5%) | 0 (0.0%) |
| $100,000+ | 55 (17.9%) | 10 (6.1%) |
| Total | 307 (100.0%) | 163 (100.0%) |
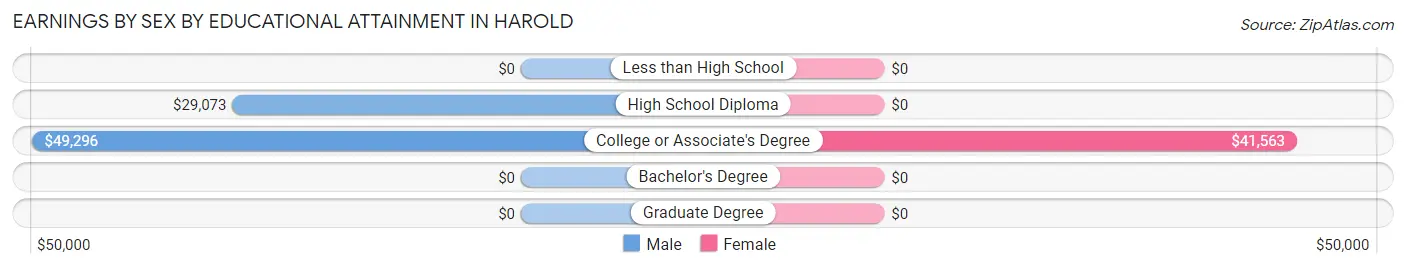
Earnings by Sex by Educational Attainment in Harold
Average earnings in Harold are $46,680 for men and $41,838 for women, a difference of 10.4%. Men with an educational attainment of college or associate's degree enjoy the highest average annual earnings of $49,296, while those with high school diploma education earn the least with $29,073. Women with an educational attainment of college or associate's degree earn the most with the average annual earnings of $41,563, while those with college or associate's degree education have the smallest earnings of $41,563.
| Educational Attainment | Male Income | Female Income |
| Less than High School | - | - |
| High School Diploma | $29,073 | $0 |
| College or Associate's Degree | $49,296 | $41,563 |
| Bachelor's Degree | - | - |
| Graduate Degree | - | - |
| Total | $46,680 | $41,838 |
Family Income in Harold
Family Income Brackets in Harold
According to the Harold family income data, there are 63 families falling into the $200,000+ income range, which is the most common income bracket and makes up 32.1% of all families.
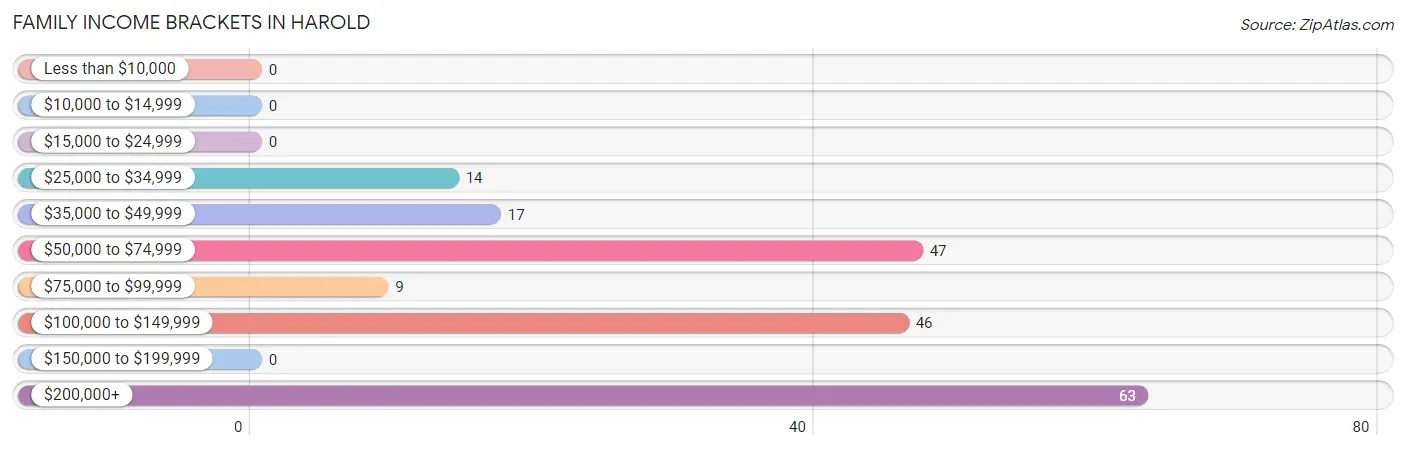
| Income Bracket | # Families | % Families |
| Less than $10,000 | 0 | 0.0% |
| $10,000 to $14,999 | 0 | 0.0% |
| $15,000 to $24,999 | 0 | 0.0% |
| $25,000 to $34,999 | 14 | 7.1% |
| $35,000 to $49,999 | 17 | 8.7% |
| $50,000 to $74,999 | 47 | 24.0% |
| $75,000 to $99,999 | 9 | 4.6% |
| $100,000 to $149,999 | 46 | 23.5% |
| $150,000 to $199,999 | 0 | 0.0% |
| $200,000+ | 63 | 32.1% |
Family Income by Famaliy Size in Harold
2-person families (92 | 46.9%) account for the highest median family income in Harold with $64,286 per family, while 2-person families (92 | 46.9%) have the highest median income of $32,143 per family member.
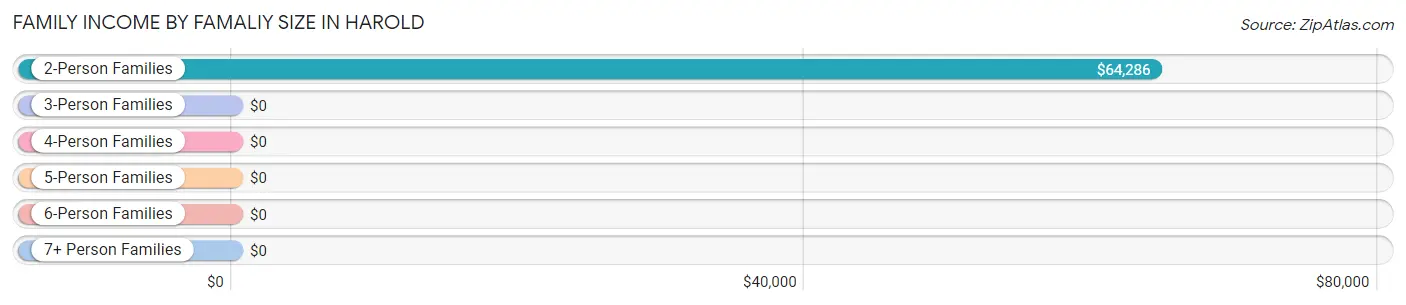
| Income Bracket | # Families | Median Income |
| 2-Person Families | 92 (46.9%) | $64,286 |
| 3-Person Families | 19 (9.7%) | $0 |
| 4-Person Families | 14 (7.1%) | $0 |
| 5-Person Families | 55 (28.1%) | $0 |
| 6-Person Families | 16 (8.2%) | $0 |
| 7+ Person Families | 0 (0.0%) | $0 |
| Total | 196 (100.0%) | $108,947 |
Family Income by Number of Earners in Harold
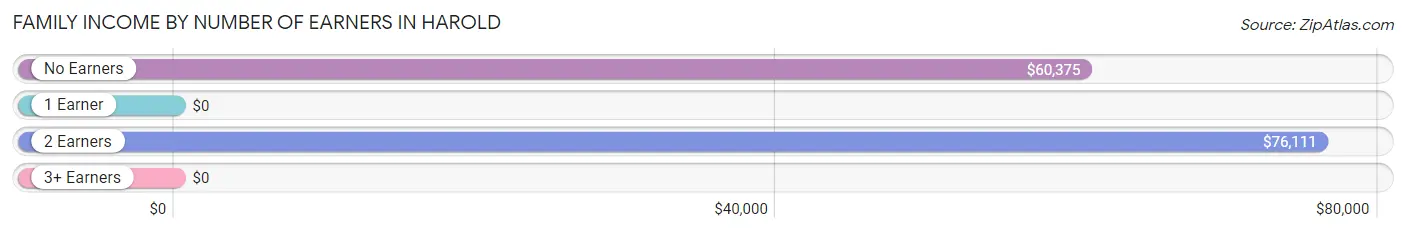
| Number of Earners | # Families | Median Income |
| No Earners | 31 (15.8%) | $60,375 |
| 1 Earner | 8 (4.1%) | $0 |
| 2 Earners | 102 (52.0%) | $76,111 |
| 3+ Earners | 55 (28.1%) | $0 |
| Total | 196 (100.0%) | $108,947 |
Household Income in Harold
Household Income Brackets in Harold
With 69 households falling in the category, the $50,000 to $74,999 income range is the most frequent in Harold, accounting for 28.4% of all households.
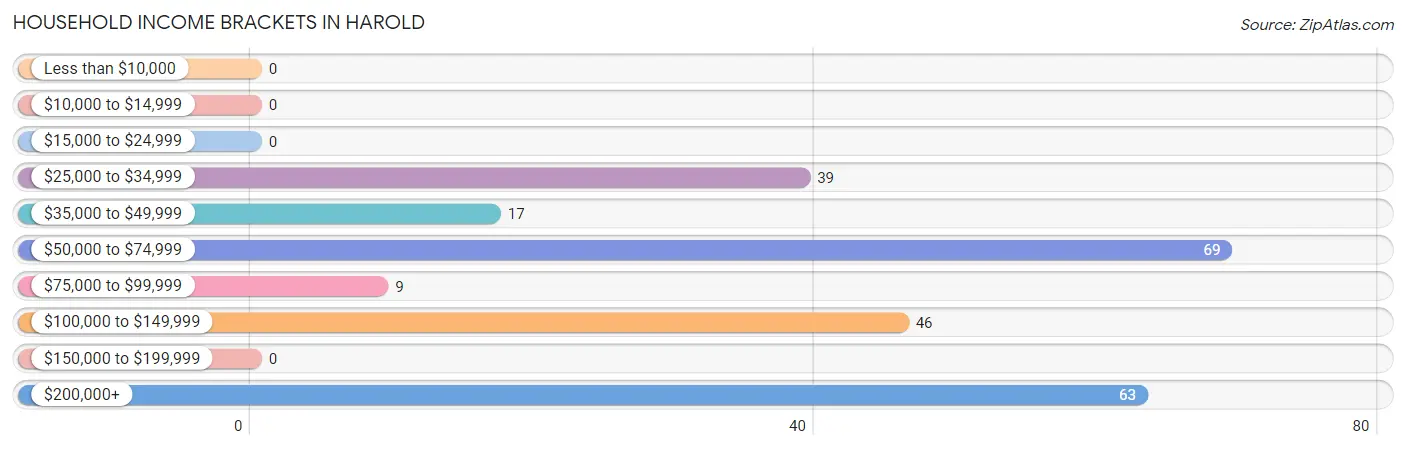
| Income Bracket | # Households | % Households |
| Less than $10,000 | 0 | 0.0% |
| $10,000 to $14,999 | 0 | 0.0% |
| $15,000 to $24,999 | 0 | 0.0% |
| $25,000 to $34,999 | 39 | 16.0% |
| $35,000 to $49,999 | 17 | 7.0% |
| $50,000 to $74,999 | 69 | 28.4% |
| $75,000 to $99,999 | 9 | 3.7% |
| $100,000 to $149,999 | 46 | 18.9% |
| $150,000 to $199,999 | 0 | 0.0% |
| $200,000+ | 63 | 25.9% |
Household Income by Householder Age in Harold
The median household income in Harold is $0, with the highest median household income of $108,487 found in the 25 to 44 years age bracket for the primary householder. A total of 43 households (17.7%) fall into this category.
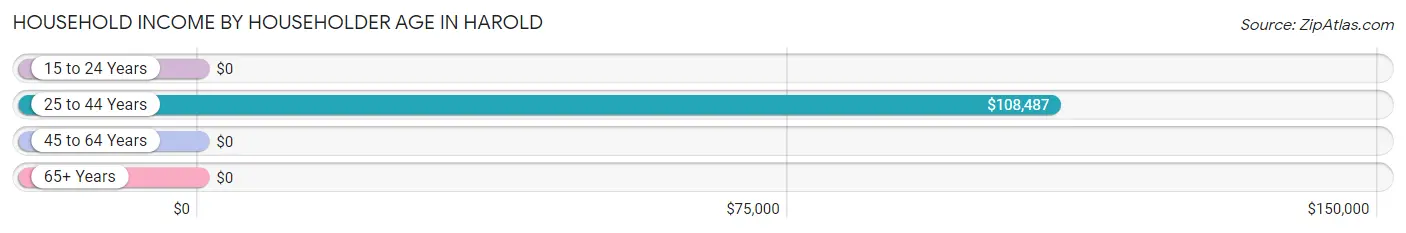
| Income Bracket | # Households | Median Income |
| 15 to 24 Years | 0 (0.0%) | $0 |
| 25 to 44 Years | 43 (17.7%) | $108,487 |
| 45 to 64 Years | 117 (48.1%) | $0 |
| 65+ Years | 83 (34.2%) | $0 |
| Total | 243 (100.0%) | $0 |
Poverty in Harold
Income Below Poverty by Sex and Age in Harold
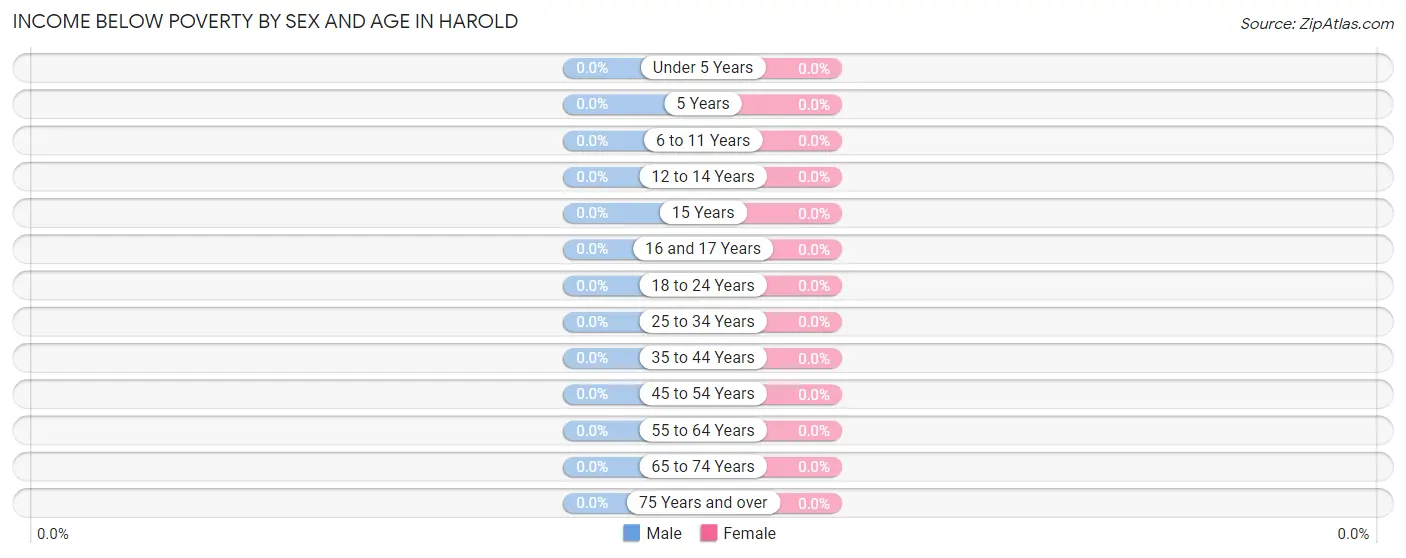
| Age Bracket | Male | Female |
| Under 5 Years | 0 (0.0%) | 0 (0.0%) |
| 5 Years | 0 (0.0%) | 0 (0.0%) |
| 6 to 11 Years | 0 (0.0%) | 0 (0.0%) |
| 12 to 14 Years | 0 (0.0%) | 0 (0.0%) |
| 15 Years | 0 (0.0%) | 0 (0.0%) |
| 16 and 17 Years | 0 (0.0%) | 0 (0.0%) |
| 18 to 24 Years | 0 (0.0%) | 0 (0.0%) |
| 25 to 34 Years | 0 (0.0%) | 0 (0.0%) |
| 35 to 44 Years | 0 (0.0%) | 0 (0.0%) |
| 45 to 54 Years | 0 (0.0%) | 0 (0.0%) |
| 55 to 64 Years | 0 (0.0%) | 0 (0.0%) |
| 65 to 74 Years | 0 (0.0%) | 0 (0.0%) |
| 75 Years and over | 0 (0.0%) | 0 (0.0%) |
| Total | 0 (0.0%) | 0 (0.0%) |
Income Above Poverty by Sex and Age in Harold
According to the poverty statistics in Harold, males aged 6 to 11 years and females aged under 5 years are the age groups that are most secure financially, with 100.0% of males and 100.0% of females in these age groups living above the poverty line.
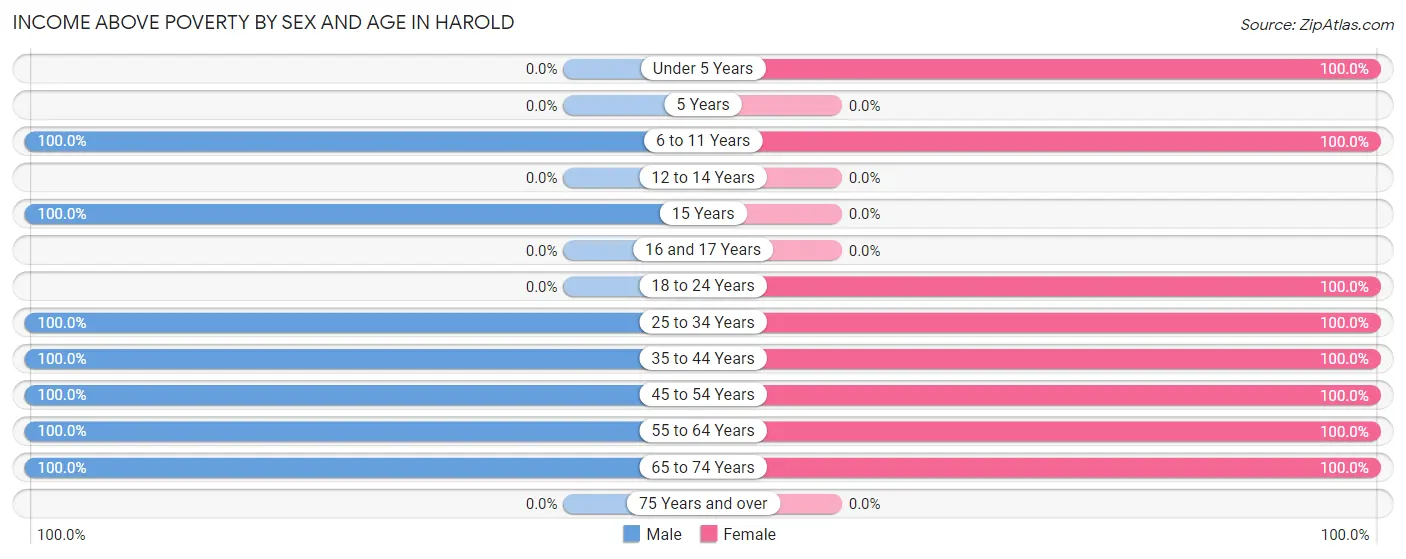
| Age Bracket | Male | Female |
| Under 5 Years | 0 (0.0%) | 90 (100.0%) |
| 5 Years | 0 (0.0%) | 0 (0.0%) |
| 6 to 11 Years | 16 (100.0%) | 39 (100.0%) |
| 12 to 14 Years | 0 (0.0%) | 0 (0.0%) |
| 15 Years | 45 (100.0%) | 0 (0.0%) |
| 16 and 17 Years | 0 (0.0%) | 0 (0.0%) |
| 18 to 24 Years | 0 (0.0%) | 17 (100.0%) |
| 25 to 34 Years | 140 (100.0%) | 117 (100.0%) |
| 35 to 44 Years | 58 (100.0%) | 14 (100.0%) |
| 45 to 54 Years | 71 (100.0%) | 71 (100.0%) |
| 55 to 64 Years | 22 (100.0%) | 24 (100.0%) |
| 65 to 74 Years | 72 (100.0%) | 67 (100.0%) |
| 75 Years and over | 0 (0.0%) | 0 (0.0%) |
| Total | 424 (100.0%) | 439 (100.0%) |
Income Below Poverty Among Married-Couple Families in Harold
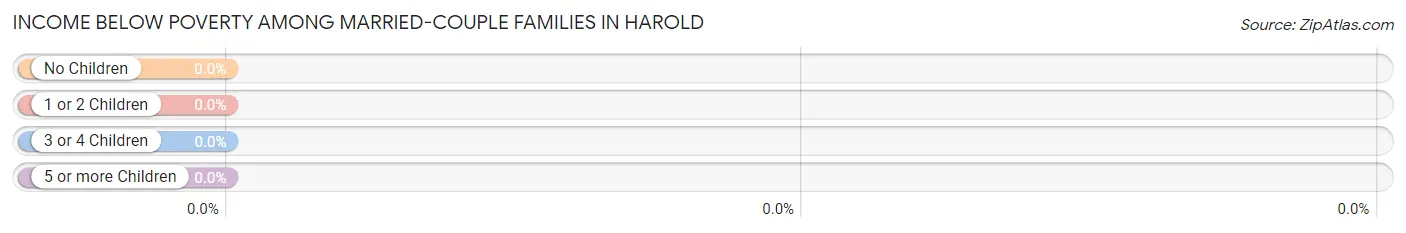
| Children | Above Poverty | Below Poverty |
| No Children | 50 (100.0%) | 0 (0.0%) |
| 1 or 2 Children | 104 (100.0%) | 0 (0.0%) |
| 3 or 4 Children | 0 (0.0%) | 0 (0.0%) |
| 5 or more Children | 0 (0.0%) | 0 (0.0%) |
| Total | 154 (100.0%) | 0 (0.0%) |
Income Below Poverty Among Single-Parent Households in Harold
| Children | Single Father | Single Mother |
| No Children | 0 (0.0%) | 0 (0.0%) |
| 1 or 2 Children | 0 (0.0%) | 0 (0.0%) |
| 3 or 4 Children | 0 (0.0%) | 0 (0.0%) |
| 5 or more Children | 0 (0.0%) | 0 (0.0%) |
| Total | 0 (0.0%) | 0 (0.0%) |
Income Below Poverty Among Married-Couple vs Single-Parent Households in Harold
| Children | Married-Couple Families | Single-Parent Households |
| No Children | 0 (0.0%) | 0 (0.0%) |
| 1 or 2 Children | 0 (0.0%) | 0 (0.0%) |
| 3 or 4 Children | 0 (0.0%) | 0 (0.0%) |
| 5 or more Children | 0 (0.0%) | 0 (0.0%) |
| Total | 0 (0.0%) | 0 (0.0%) |
Race in Harold
The most populous races in Harold are White / Caucasian (669 | 77.5%), Two or more Races (156 | 18.1%), and Hispanic or Latino (142 | 16.5%).
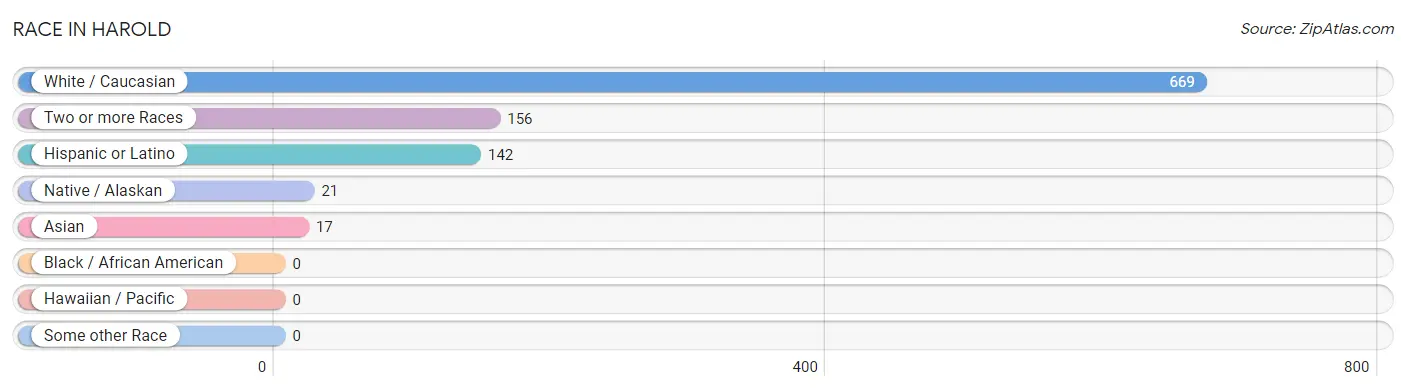
| Race | # Population | % Population |
| Asian | 17 | 2.0% |
| Black / African American | 0 | 0.0% |
| Hawaiian / Pacific | 0 | 0.0% |
| Hispanic or Latino | 142 | 16.5% |
| Native / Alaskan | 21 | 2.4% |
| White / Caucasian | 669 | 77.5% |
| Two or more Races | 156 | 18.1% |
| Some other Race | 0 | 0.0% |
| Total | 863 | 100.0% |
Ancestry in Harold
The most populous ancestries reported in Harold are English (316 | 36.6%), Apache (142 | 16.5%), Mexican (142 | 16.5%), Scottish (123 | 14.2%), and Cherokee (112 | 13.0%), together accounting for 96.8% of all Harold residents.
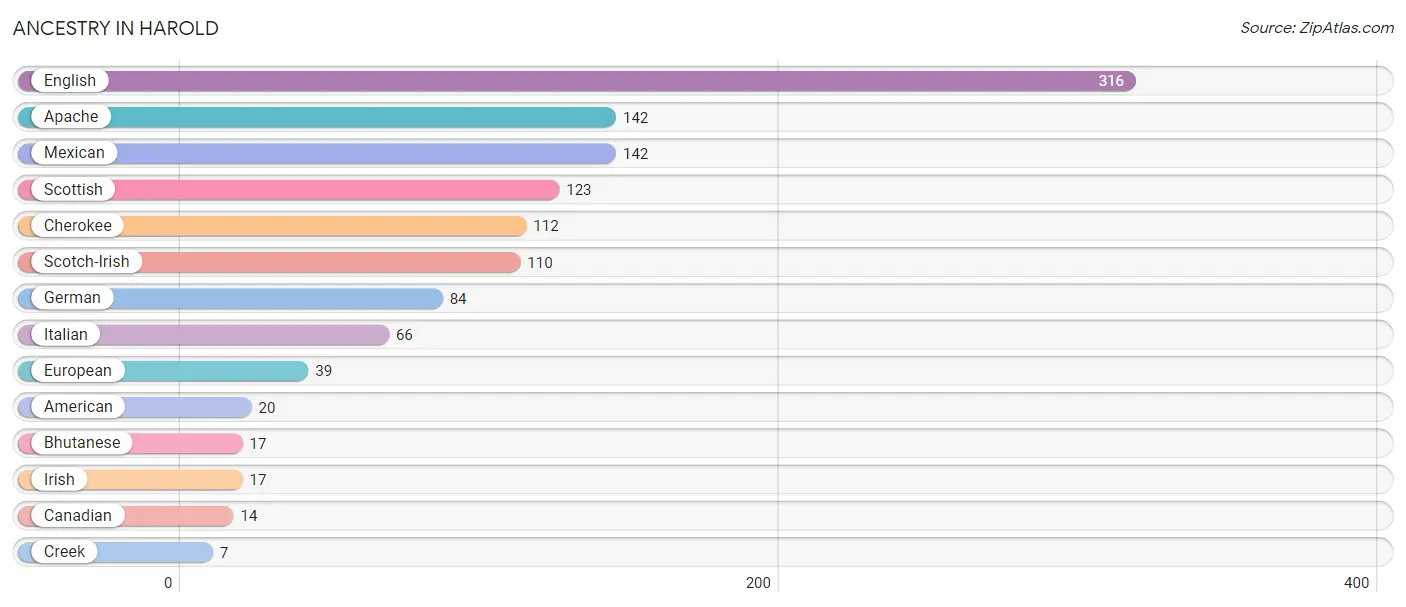
| Ancestry | # Population | % Population |
| American | 20 | 2.3% |
| Apache | 142 | 16.5% |
| Bhutanese | 17 | 2.0% |
| Canadian | 14 | 1.6% |
| Cherokee | 112 | 13.0% |
| Creek | 7 | 0.8% |
| English | 316 | 36.6% |
| European | 39 | 4.5% |
| German | 84 | 9.7% |
| Irish | 17 | 2.0% |
| Italian | 66 | 7.6% |
| Mexican | 142 | 16.5% |
| Scotch-Irish | 110 | 12.8% |
| Scottish | 123 | 14.2% | View All 14 Rows |
Immigrants in Harold
The most numerous immigrant groups reported in Harold came from , and Canada (14 | 1.6%), together accounting for 1.6% of all Harold residents.

| Immigration Origin | # Population | % Population |
| Canada | 14 | 1.6% | View All 1 Rows |
Sex and Age in Harold
Sex and Age in Harold
The most populous age groups in Harold are 25 to 29 Years (102 | 24.1%) for men and 25 to 29 Years (98 | 22.3%) for women.
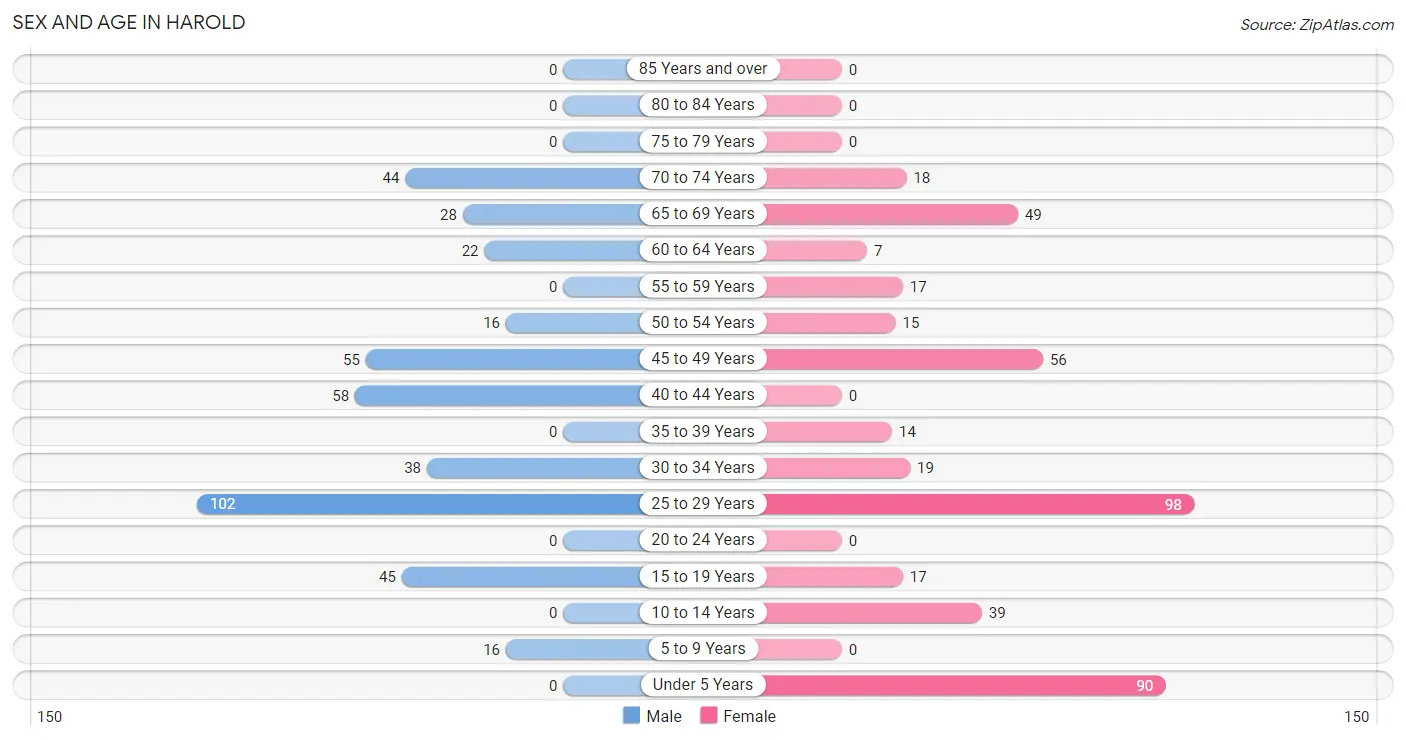
| Age Bracket | Male | Female |
| Under 5 Years | 0 (0.0%) | 90 (20.5%) |
| 5 to 9 Years | 16 (3.8%) | 0 (0.0%) |
| 10 to 14 Years | 0 (0.0%) | 39 (8.9%) |
| 15 to 19 Years | 45 (10.6%) | 17 (3.9%) |
| 20 to 24 Years | 0 (0.0%) | 0 (0.0%) |
| 25 to 29 Years | 102 (24.1%) | 98 (22.3%) |
| 30 to 34 Years | 38 (9.0%) | 19 (4.3%) |
| 35 to 39 Years | 0 (0.0%) | 14 (3.2%) |
| 40 to 44 Years | 58 (13.7%) | 0 (0.0%) |
| 45 to 49 Years | 55 (13.0%) | 56 (12.8%) |
| 50 to 54 Years | 16 (3.8%) | 15 (3.4%) |
| 55 to 59 Years | 0 (0.0%) | 17 (3.9%) |
| 60 to 64 Years | 22 (5.2%) | 7 (1.6%) |
| 65 to 69 Years | 28 (6.6%) | 49 (11.2%) |
| 70 to 74 Years | 44 (10.4%) | 18 (4.1%) |
| 75 to 79 Years | 0 (0.0%) | 0 (0.0%) |
| 80 to 84 Years | 0 (0.0%) | 0 (0.0%) |
| 85 Years and over | 0 (0.0%) | 0 (0.0%) |
| Total | 424 (100.0%) | 439 (100.0%) |
Families and Households in Harold
Median Family Size in Harold
The median family size in Harold is 4.16 persons per family, with married-couple families (154 | 78.6%) accounting for the largest median family size of 4.75 persons per family. On the other hand, single female/mother families (17 | 8.7%) represent the smallest median family size with 2.00 persons per family.
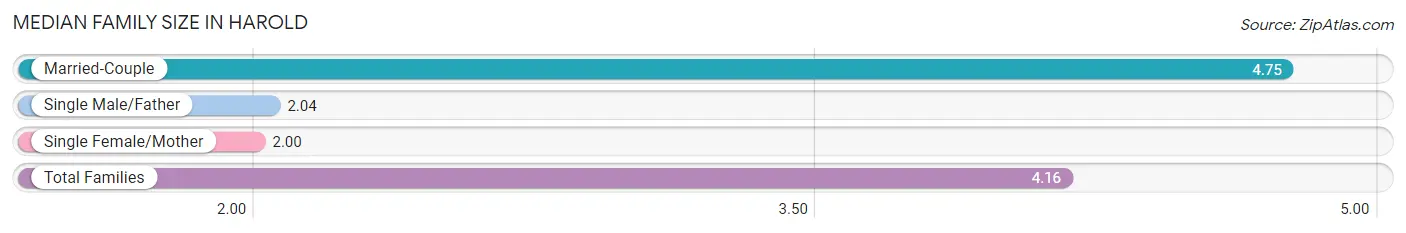
| Family Type | # Families | Family Size |
| Married-Couple | 154 (78.6%) | 4.75 |
| Single Male/Father | 25 (12.8%) | 2.04 |
| Single Female/Mother | 17 (8.7%) | 2.00 |
| Total Families | 196 (100.0%) | 4.16 |
Median Household Size in Harold
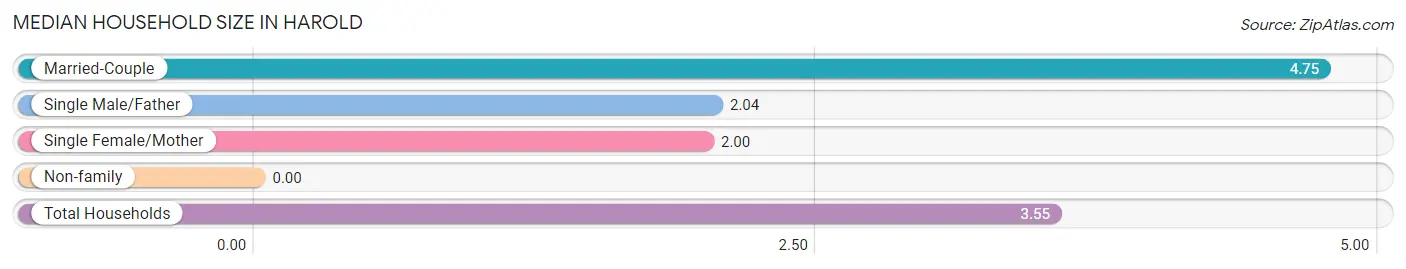
| Household Type | # Households | Household Size |
| Married-Couple | 154 (63.4%) | 4.75 |
| Single Male/Father | 25 (10.3%) | 2.04 |
| Single Female/Mother | 17 (7.0%) | 2.00 |
| Non-family | 47 (19.3%) | - |
| Total Households | 243 (100.0%) | 3.55 |
Household Size by Marriage Status in Harold
Out of a total of 243 households in Harold, 196 (80.7%) are family households, while 47 (19.3%) are nonfamily households. The most numerous type of family households are 2-person households, comprising 92, and the most common type of nonfamily households are 1-person households, comprising 47.
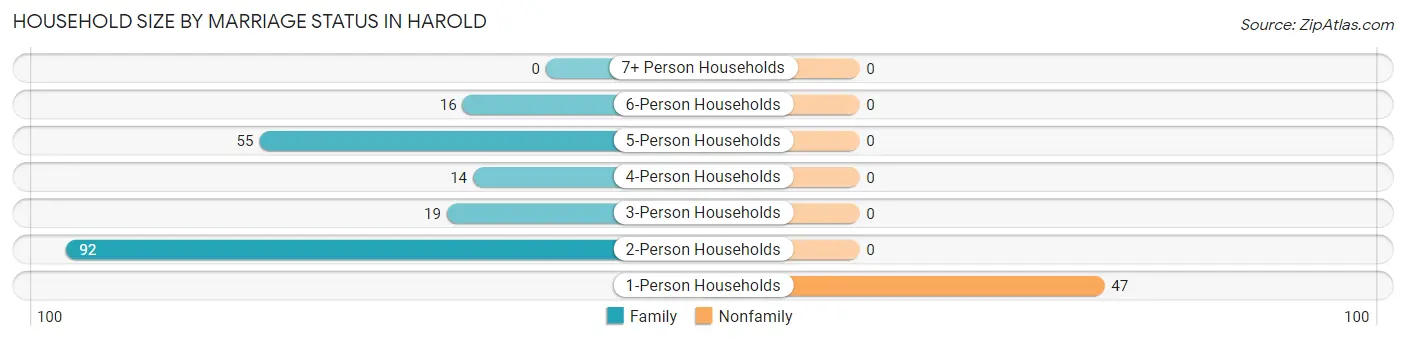
| Household Size | Family Households | Nonfamily Households |
| 1-Person Households | - | 47 (19.3%) |
| 2-Person Households | 92 (37.9%) | 0 (0.0%) |
| 3-Person Households | 19 (7.8%) | 0 (0.0%) |
| 4-Person Households | 14 (5.8%) | 0 (0.0%) |
| 5-Person Households | 55 (22.6%) | 0 (0.0%) |
| 6-Person Households | 16 (6.6%) | 0 (0.0%) |
| 7+ Person Households | 0 (0.0%) | 0 (0.0%) |
| Total | 196 (80.7%) | 47 (19.3%) |
Female Fertility in Harold
Fertility by Age in Harold
Average fertility rate in Harold is 333.0 births per 1,000 women. Women in the age bracket of 20 to 34 years have the highest fertility rate with 581.0 births per 1,000 women. Women in the age bracket of 20 to 34 years acount for 100.0% of all women with births.
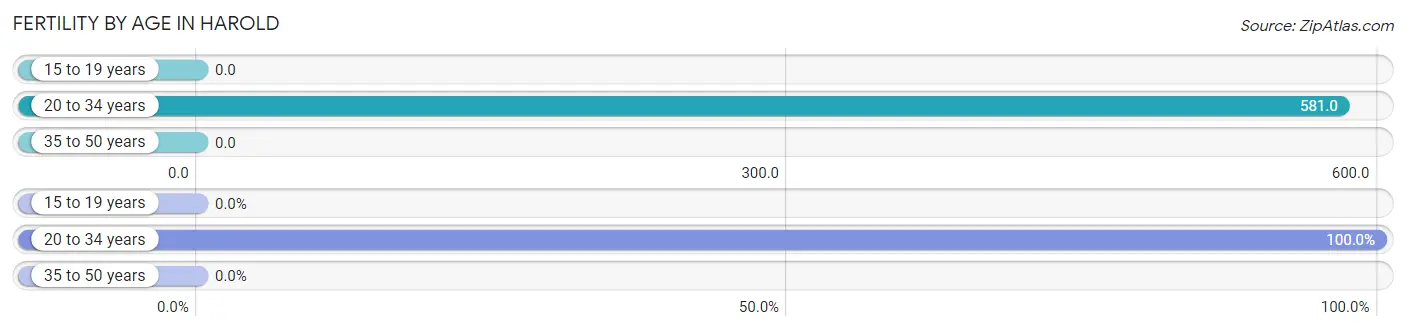
| Age Bracket | Women with Births | Births / 1,000 Women |
| 15 to 19 years | 0 (0.0%) | 0.0 |
| 20 to 34 years | 68 (100.0%) | 581.0 |
| 35 to 50 years | 0 (0.0%) | 0.0 |
| Total | 68 (100.0%) | 333.0 |
Fertility by Age by Marriage Status in Harold
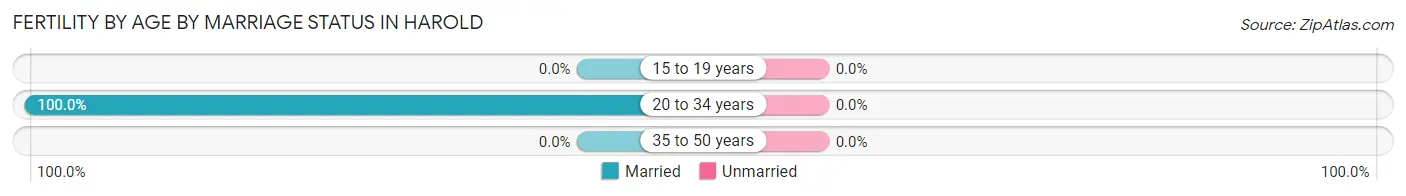
| Age Bracket | Married | Unmarried |
| 15 to 19 years | 0 (0.0%) | 0 (0.0%) |
| 20 to 34 years | 68 (100.0%) | 0 (0.0%) |
| 35 to 50 years | 0 (0.0%) | 0 (0.0%) |
| Total | 68 (100.0%) | 0 (0.0%) |
Fertility by Education in Harold
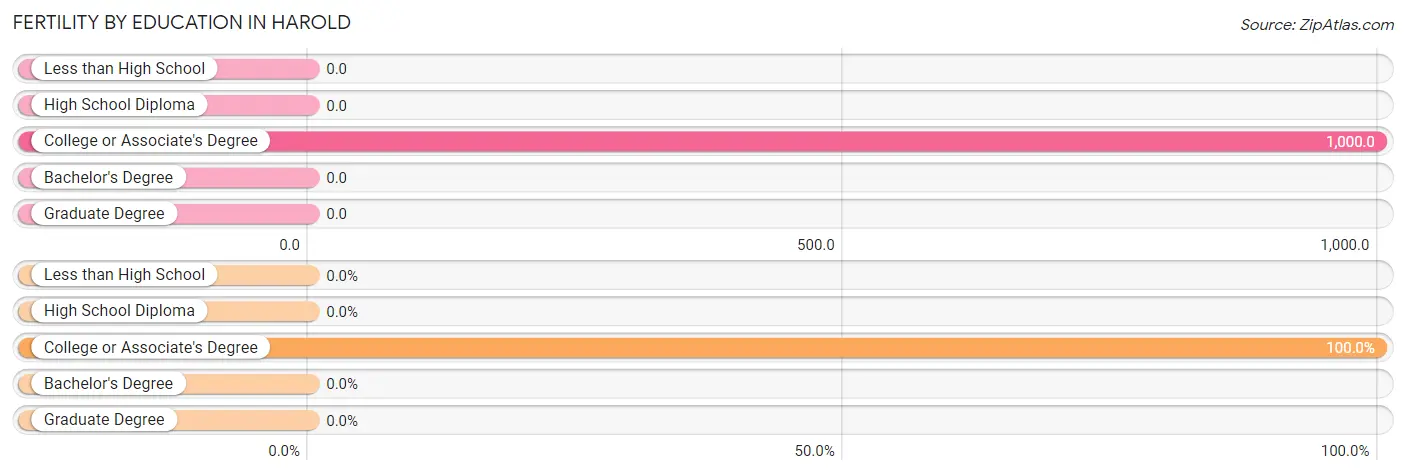
| Educational Attainment | Women with Births | Births / 1,000 Women |
| Less than High School | 0 (0.0%) | 0.0 |
| High School Diploma | 0 (0.0%) | 0.0 |
| College or Associate's Degree | 68 (100.0%) | 1,000.0 |
| Bachelor's Degree | 0 (0.0%) | 0.0 |
| Graduate Degree | 0 (0.0%) | 0.0 |
| Total | 68 (100.0%) | 333.0 |
Fertility by Education by Marriage Status in Harold
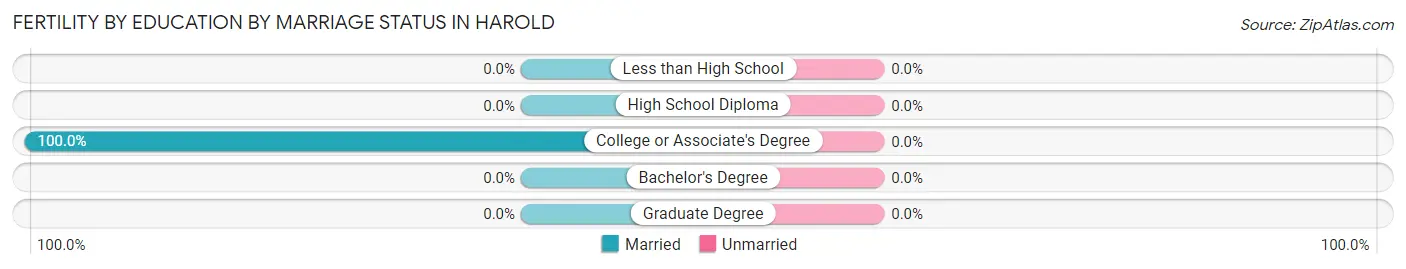
| Educational Attainment | Married | Unmarried |
| Less than High School | 0 (0.0%) | 0 (0.0%) |
| High School Diploma | 0 (0.0%) | 0 (0.0%) |
| College or Associate's Degree | 68 (100.0%) | 0 (0.0%) |
| Bachelor's Degree | 0 (0.0%) | 0 (0.0%) |
| Graduate Degree | 0 (0.0%) | 0 (0.0%) |
| Total | 68 (100.0%) | 0 (0.0%) |
Employment Characteristics in Harold
Employment by Class of Employer in Harold
Among the 252 employed individuals in Harold, private company employees (141 | 55.9%), self-employed (incorporated) (72 | 28.6%), and not-for-profit organizations (27 | 10.7%) make up the most common classes of employment.
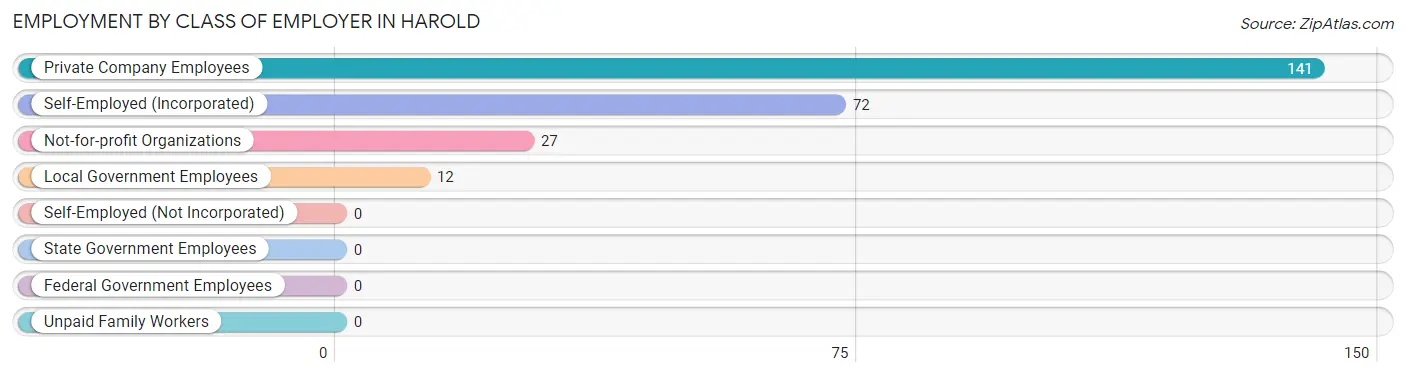
| Employer Class | # Employees | % Employees |
| Private Company Employees | 141 | 55.9% |
| Self-Employed (Incorporated) | 72 | 28.6% |
| Self-Employed (Not Incorporated) | 0 | 0.0% |
| Not-for-profit Organizations | 27 | 10.7% |
| Local Government Employees | 12 | 4.8% |
| State Government Employees | 0 | 0.0% |
| Federal Government Employees | 0 | 0.0% |
| Unpaid Family Workers | 0 | 0.0% |
| Total | 252 | 100.0% |
Employment Status by Age in Harold
According to the labor force statistics for Harold, out of the total population over 16 years of age (673), 66.7% or 449 individuals are in the labor force, with 12.9% or 58 of them unemployed. The age group with the highest labor force participation rate is 16 to 19 years, with 100.0% or 17 individuals in the labor force. Within the labor force, the 35 to 44 years age range has the highest percentage of unemployed individuals, with 80.6% or 58 of them being unemployed.
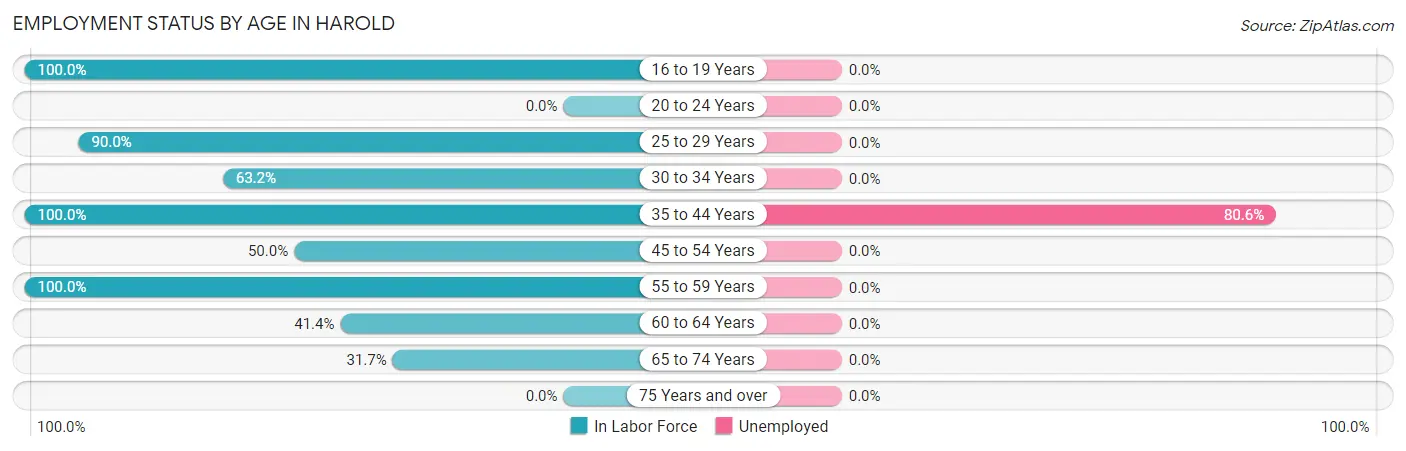
| Age Bracket | In Labor Force | Unemployed |
| 16 to 19 Years | 17 (100.0%) | 0 (0.0%) |
| 20 to 24 Years | 0 (0.0%) | 0 (0.0%) |
| 25 to 29 Years | 180 (90.0%) | 0 (0.0%) |
| 30 to 34 Years | 36 (63.2%) | 0 (0.0%) |
| 35 to 44 Years | 72 (100.0%) | 58 (80.6%) |
| 45 to 54 Years | 71 (50.0%) | 0 (0.0%) |
| 55 to 59 Years | 17 (100.0%) | 0 (0.0%) |
| 60 to 64 Years | 12 (41.4%) | 0 (0.0%) |
| 65 to 74 Years | 44 (31.7%) | 0 (0.0%) |
| 75 Years and over | 0 (0.0%) | 0 (0.0%) |
| Total | 449 (66.7%) | 58 (12.9%) |
Employment Status by Educational Attainment in Harold
According to labor force statistics for Harold, 75.0% of individuals (388) out of the total population between 25 and 64 years of age (517) are in the labor force, with 14.9% or 58 of them being unemployed. The group with the highest labor force participation rate are those with the educational attainment of college / associate degree, with 96.0% or 243 individuals in the labor force. Within the labor force, individuals with high school diploma education have the highest percentage of unemployment, with 58.0% or 58 of them being unemployed.
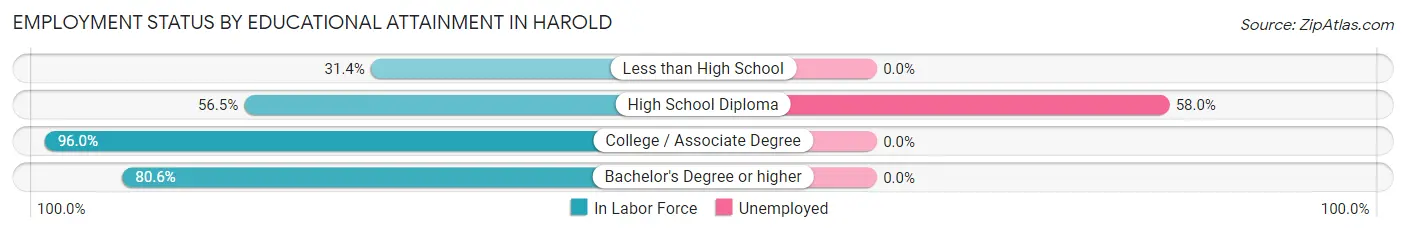
| Educational Attainment | In Labor Force | Unemployed |
| Less than High School | 16 (31.4%) | 0 (0.0%) |
| High School Diploma | 100 (56.5%) | 103 (58.0%) |
| College / Associate Degree | 243 (96.0%) | 0 (0.0%) |
| Bachelor's Degree or higher | 29 (80.6%) | 0 (0.0%) |
| Total | 388 (75.0%) | 77 (14.9%) |
Employment Occupations by Sex in Harold
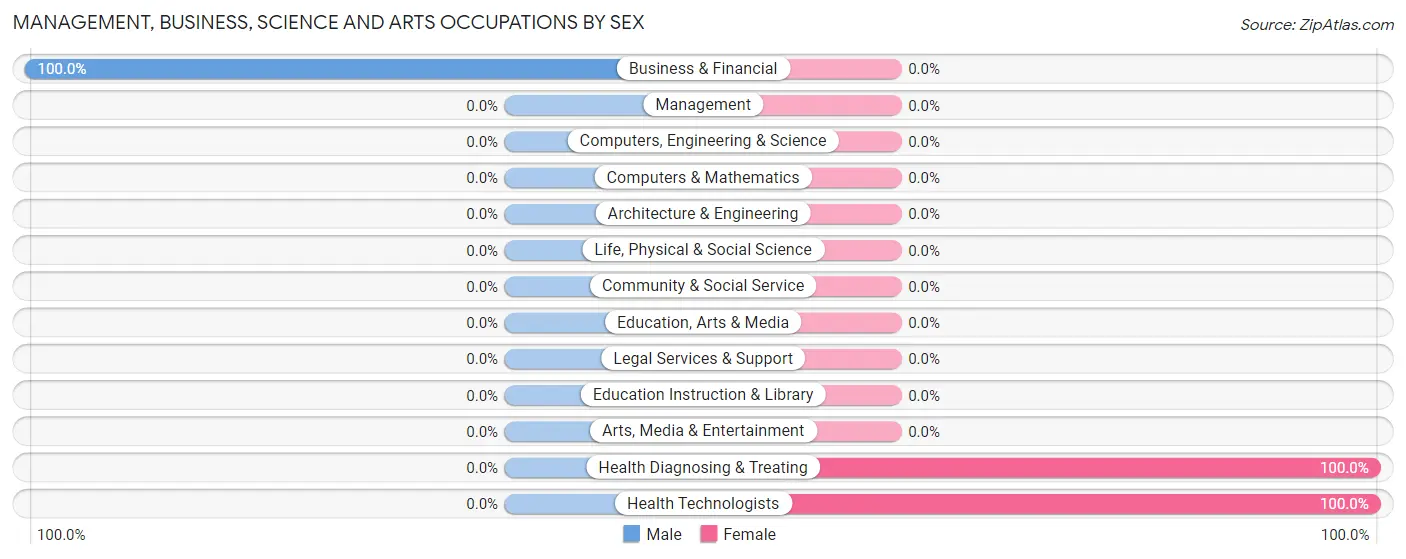
Management, Business, Science and Arts Occupations
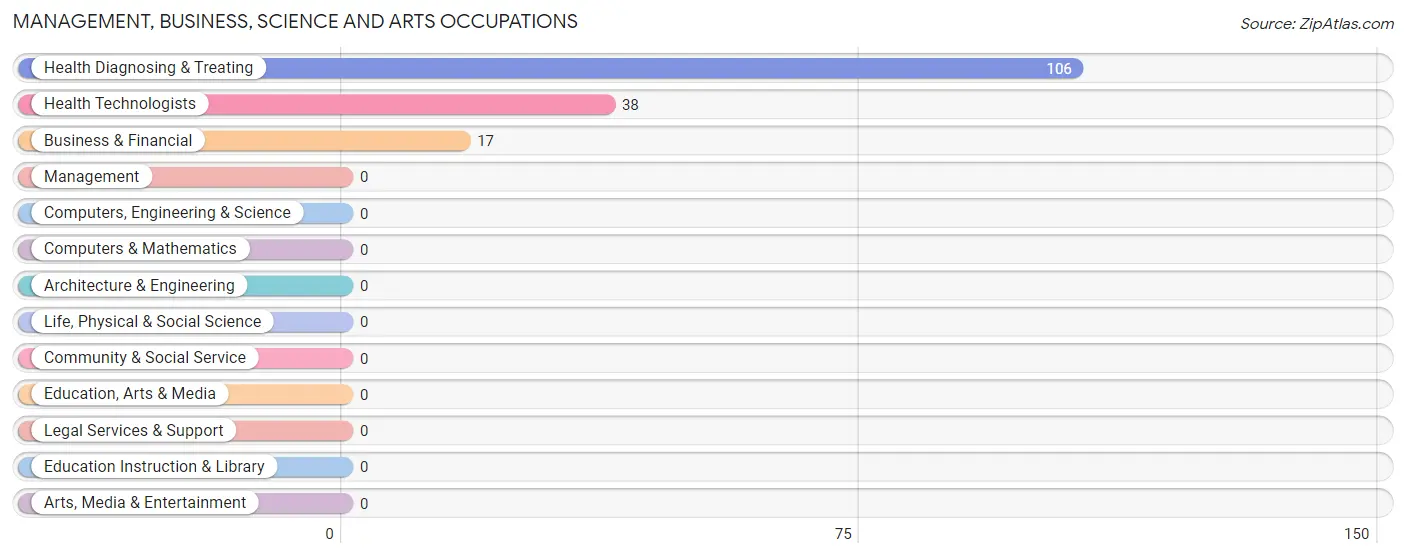
The most common Management, Business, Science and Arts occupations in Harold are Health Diagnosing & Treating (106 | 27.1%), Health Technologists (38 | 9.7%), and Business & Financial (17 | 4.3%).
Management, Business, Science and Arts Occupations by Sex
| Occupation | Male | Female |
| Management | 0 (0.0%) | 0 (0.0%) |
| Business & Financial | 17 (100.0%) | 0 (0.0%) |
| Computers, Engineering & Science | 0 (0.0%) | 0 (0.0%) |
| Computers & Mathematics | 0 (0.0%) | 0 (0.0%) |
| Architecture & Engineering | 0 (0.0%) | 0 (0.0%) |
| Life, Physical & Social Science | 0 (0.0%) | 0 (0.0%) |
| Community & Social Service | 0 (0.0%) | 0 (0.0%) |
| Education, Arts & Media | 0 (0.0%) | 0 (0.0%) |
| Legal Services & Support | 0 (0.0%) | 0 (0.0%) |
| Education Instruction & Library | 0 (0.0%) | 0 (0.0%) |
| Arts, Media & Entertainment | 0 (0.0%) | 0 (0.0%) |
| Health Diagnosing & Treating | 0 (0.0%) | 106 (100.0%) |
| Health Technologists | 0 (0.0%) | 38 (100.0%) |
| Total (Category) | 17 (13.8%) | 106 (86.2%) |
| Total (Overall) | 228 (58.3%) | 163 (41.7%) |
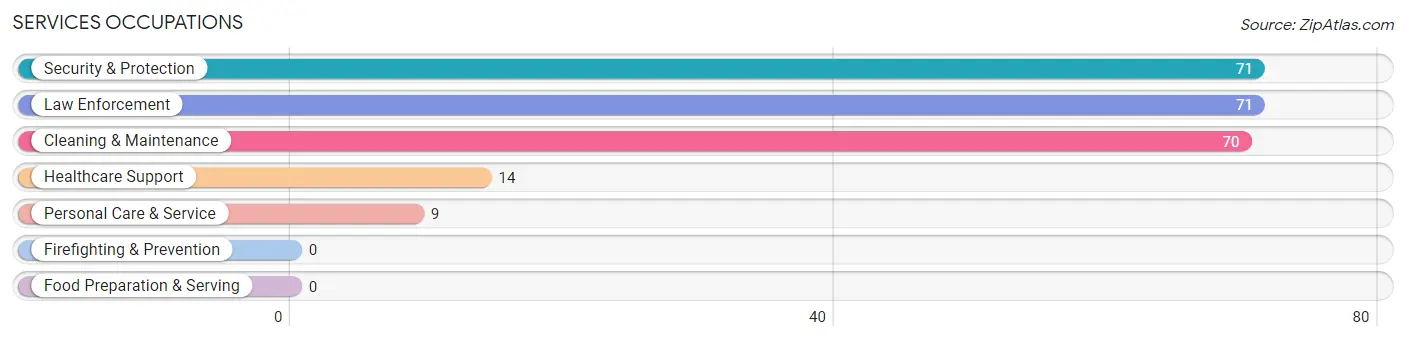
Services Occupations
The most common Services occupations in Harold are Security & Protection (71 | 18.2%), Law Enforcement (71 | 18.2%), Cleaning & Maintenance (70 | 17.9%), Healthcare Support (14 | 3.6%), and Personal Care & Service (9 | 2.3%).
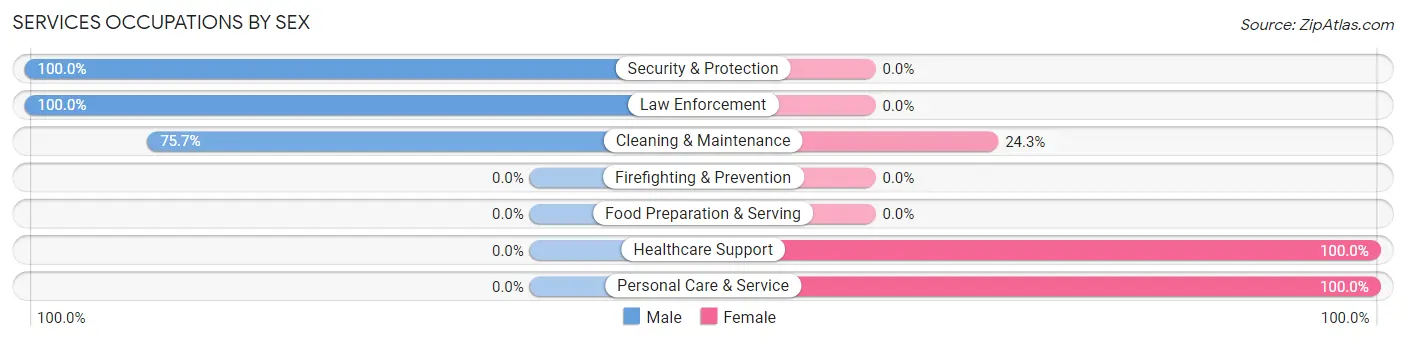
Services Occupations by Sex
Within the Services occupations in Harold, the most male-oriented occupations are Security & Protection (100.0%), Law Enforcement (100.0%), and Cleaning & Maintenance (75.7%), while the most female-oriented occupations are Healthcare Support (100.0%), Personal Care & Service (100.0%), and Cleaning & Maintenance (24.3%).
| Occupation | Male | Female |
| Healthcare Support | 0 (0.0%) | 14 (100.0%) |
| Security & Protection | 71 (100.0%) | 0 (0.0%) |
| Firefighting & Prevention | 0 (0.0%) | 0 (0.0%) |
| Law Enforcement | 71 (100.0%) | 0 (0.0%) |
| Food Preparation & Serving | 0 (0.0%) | 0 (0.0%) |
| Cleaning & Maintenance | 53 (75.7%) | 17 (24.3%) |
| Personal Care & Service | 0 (0.0%) | 9 (100.0%) |
| Total (Category) | 124 (75.6%) | 40 (24.4%) |
| Total (Overall) | 228 (58.3%) | 163 (41.7%) |
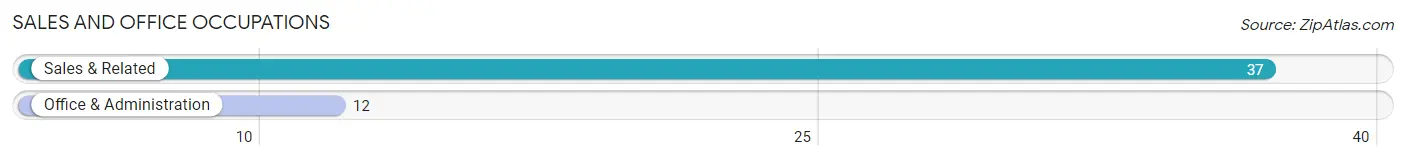
Sales and Office Occupations
The most common Sales and Office occupations in Harold are Sales & Related (37 | 9.5%), and Office & Administration (12 | 3.1%).
Sales and Office Occupations by Sex
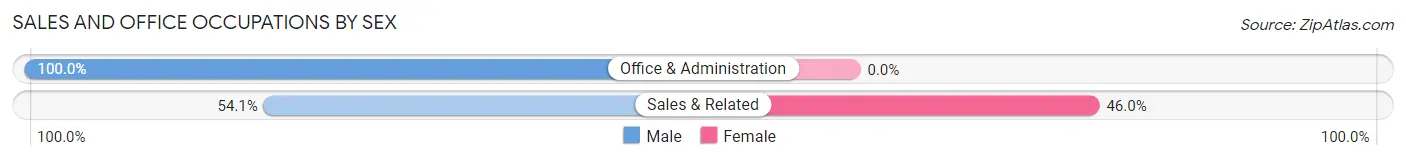
| Occupation | Male | Female |
| Sales & Related | 20 (54.0%) | 17 (46.0%) |
| Office & Administration | 12 (100.0%) | 0 (0.0%) |
| Total (Category) | 32 (65.3%) | 17 (34.7%) |
| Total (Overall) | 228 (58.3%) | 163 (41.7%) |
Natural Resources, Construction and Maintenance Occupations
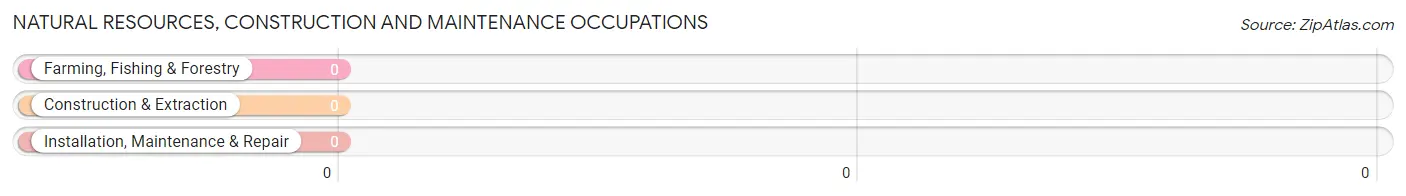
Natural Resources, Construction and Maintenance Occupations by Sex
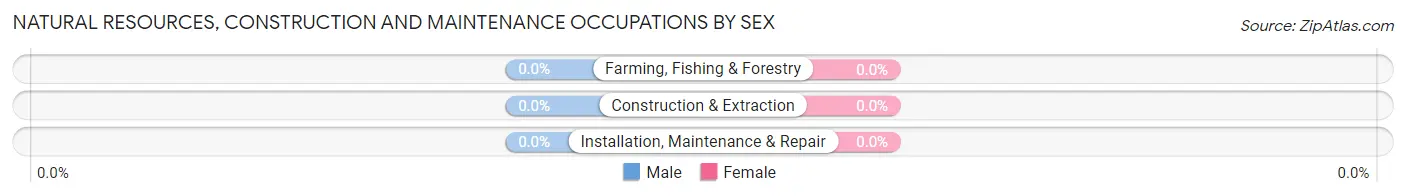
| Occupation | Male | Female |
| Farming, Fishing & Forestry | 0 (0.0%) | 0 (0.0%) |
| Construction & Extraction | 0 (0.0%) | 0 (0.0%) |
| Installation, Maintenance & Repair | 0 (0.0%) | 0 (0.0%) |
| Total (Category) | 0 (0.0%) | 0 (0.0%) |
| Total (Overall) | 228 (58.3%) | 163 (41.7%) |
Production, Transportation and Moving Occupations
The most common Production, Transportation and Moving occupations in Harold are , and Transportation (55 | 14.1%).
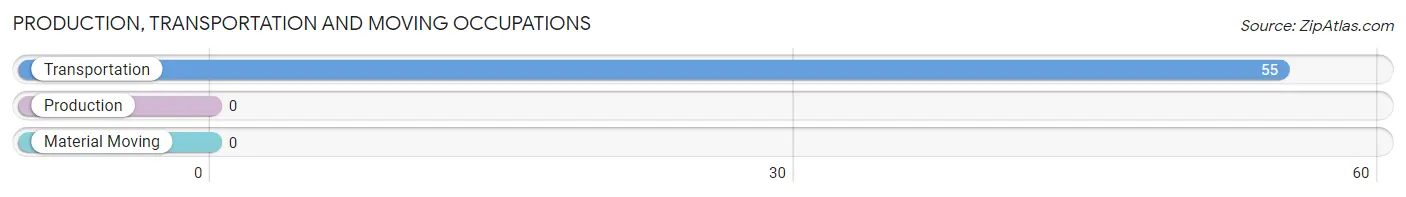
Production, Transportation and Moving Occupations by Sex
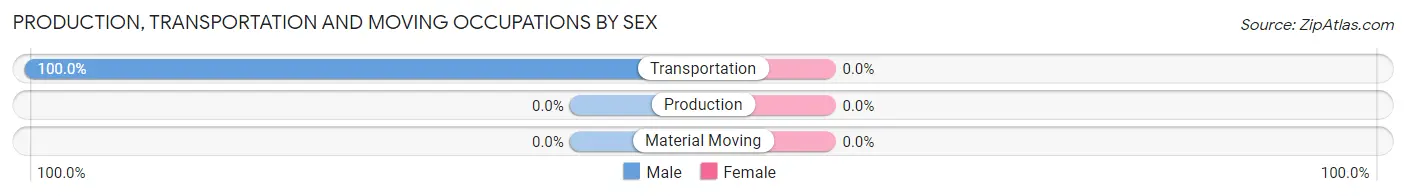
| Occupation | Male | Female |
| Production | 0 (0.0%) | 0 (0.0%) |
| Transportation | 55 (100.0%) | 0 (0.0%) |
| Material Moving | 0 (0.0%) | 0 (0.0%) |
| Total (Category) | 55 (100.0%) | 0 (0.0%) |
| Total (Overall) | 228 (58.3%) | 163 (41.7%) |
Employment Industries by Sex in Harold
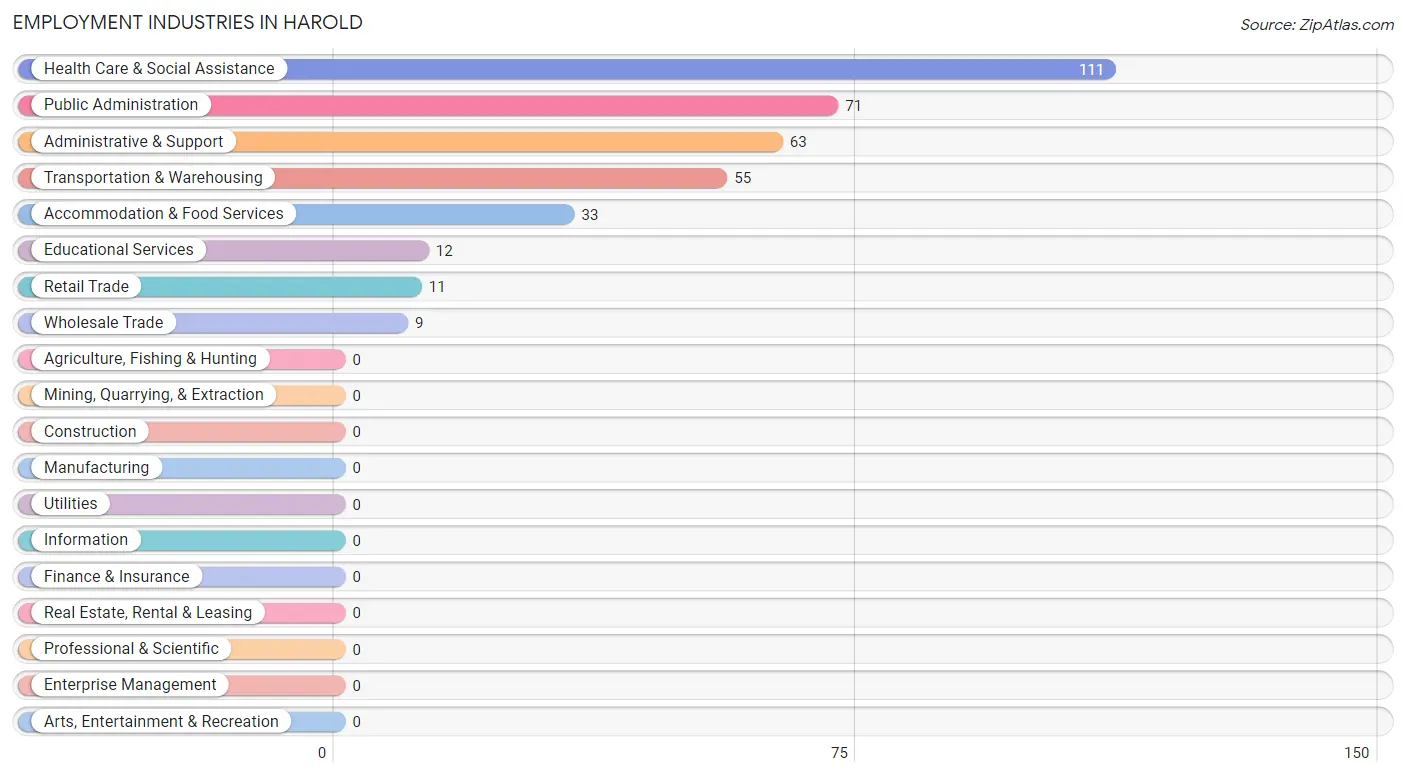
Employment Industries in Harold
The major employment industries in Harold include Health Care & Social Assistance (111 | 28.4%), Public Administration (71 | 18.2%), Administrative & Support (63 | 16.1%), Transportation & Warehousing (55 | 14.1%), and Accommodation & Food Services (33 | 8.4%).
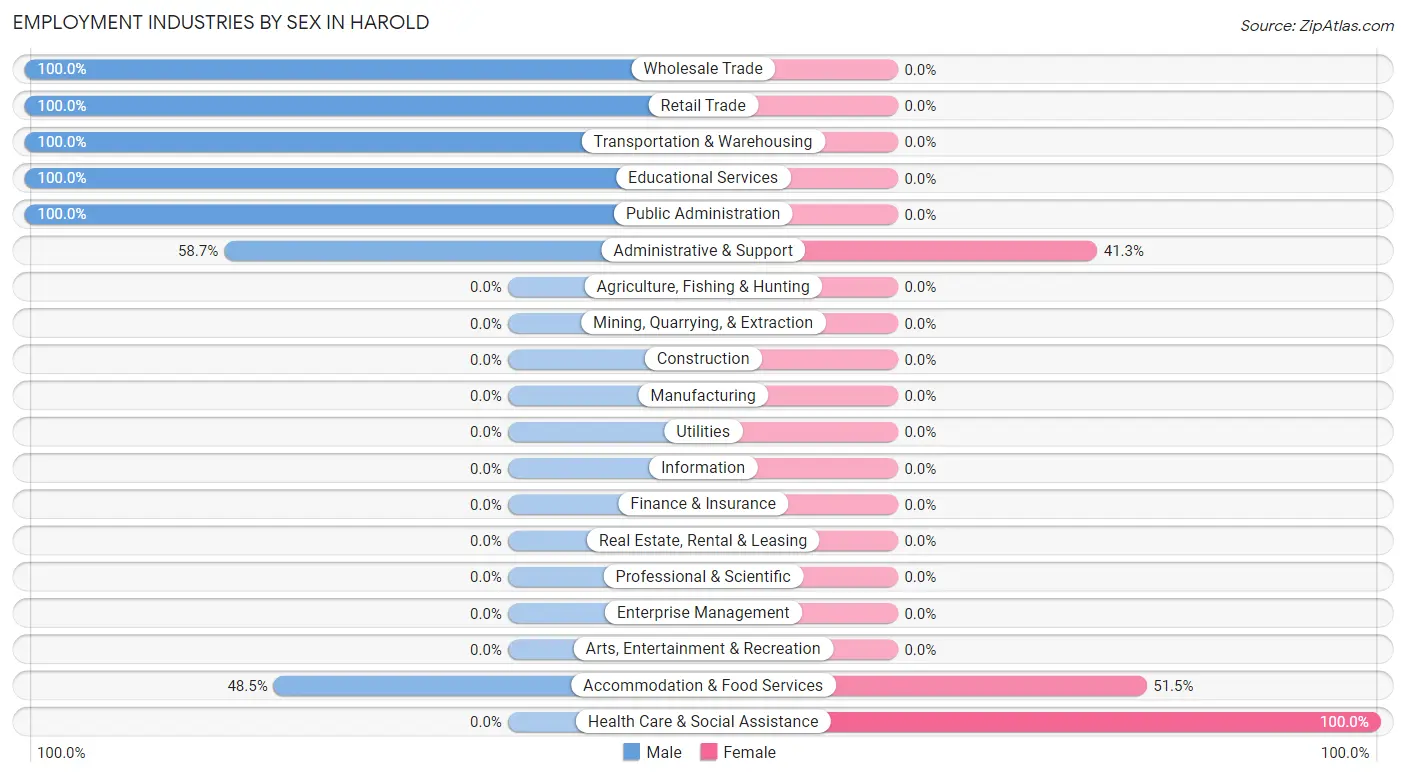
Employment Industries by Sex in Harold
The Harold industries that see more men than women are Wholesale Trade (100.0%), Retail Trade (100.0%), and Transportation & Warehousing (100.0%), whereas the industries that tend to have a higher number of women are Health Care & Social Assistance (100.0%), Accommodation & Food Services (51.5%), and Administrative & Support (41.3%).
| Industry | Male | Female |
| Agriculture, Fishing & Hunting | 0 (0.0%) | 0 (0.0%) |
| Mining, Quarrying, & Extraction | 0 (0.0%) | 0 (0.0%) |
| Construction | 0 (0.0%) | 0 (0.0%) |
| Manufacturing | 0 (0.0%) | 0 (0.0%) |
| Wholesale Trade | 9 (100.0%) | 0 (0.0%) |
| Retail Trade | 11 (100.0%) | 0 (0.0%) |
| Transportation & Warehousing | 55 (100.0%) | 0 (0.0%) |
| Utilities | 0 (0.0%) | 0 (0.0%) |
| Information | 0 (0.0%) | 0 (0.0%) |
| Finance & Insurance | 0 (0.0%) | 0 (0.0%) |
| Real Estate, Rental & Leasing | 0 (0.0%) | 0 (0.0%) |
| Professional & Scientific | 0 (0.0%) | 0 (0.0%) |
| Enterprise Management | 0 (0.0%) | 0 (0.0%) |
| Administrative & Support | 37 (58.7%) | 26 (41.3%) |
| Educational Services | 12 (100.0%) | 0 (0.0%) |
| Health Care & Social Assistance | 0 (0.0%) | 111 (100.0%) |
| Arts, Entertainment & Recreation | 0 (0.0%) | 0 (0.0%) |
| Accommodation & Food Services | 16 (48.5%) | 17 (51.5%) |
| Public Administration | 71 (100.0%) | 0 (0.0%) |
| Total | 228 (58.3%) | 163 (41.7%) |
Education in Harold
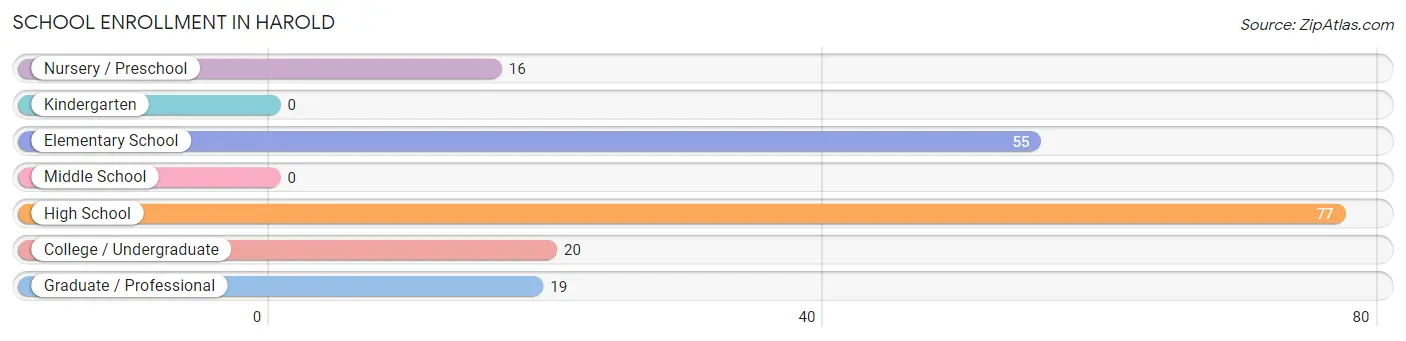
School Enrollment in Harold
The most common levels of schooling among the 187 students in Harold are high school (77 | 41.2%), elementary school (55 | 29.4%), and college / undergraduate (20 | 10.7%).
| School Level | # Students | % Students |
| Nursery / Preschool | 16 | 8.6% |
| Kindergarten | 0 | 0.0% |
| Elementary School | 55 | 29.4% |
| Middle School | 0 | 0.0% |
| High School | 77 | 41.2% |
| College / Undergraduate | 20 | 10.7% |
| Graduate / Professional | 19 | 10.2% |
| Total | 187 | 100.0% |
School Enrollment by Age by Funding Source in Harold
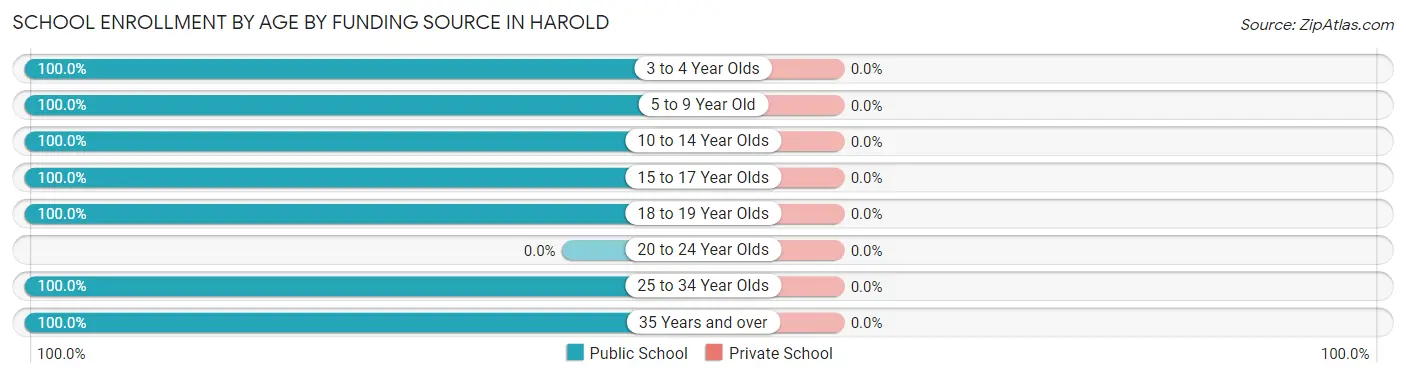
| Age Bracket | Public School | Private School |
| 3 to 4 Year Olds | 16 (100.0%) | 0 (0.0%) |
| 5 to 9 Year Old | 16 (100.0%) | 0 (0.0%) |
| 10 to 14 Year Olds | 39 (100.0%) | 0 (0.0%) |
| 15 to 17 Year Olds | 45 (100.0%) | 0 (0.0%) |
| 18 to 19 Year Olds | 17 (100.0%) | 0 (0.0%) |
| 20 to 24 Year Olds | 0 (0.0%) | 0 (0.0%) |
| 25 to 34 Year Olds | 39 (100.0%) | 0 (0.0%) |
| 35 Years and over | 15 (100.0%) | 0 (0.0%) |
| Total | 187 (100.0%) | 0 (0.0%) |
Educational Attainment by Field of Study in Harold
Education (29 | 37.7%), bio, nature & agricultural (19 | 24.7%), science & technology (19 | 24.7%), and arts & humanities (10 | 13.0%) are the most common fields of study among 77 individuals in Harold who have obtained a bachelor's degree or higher.
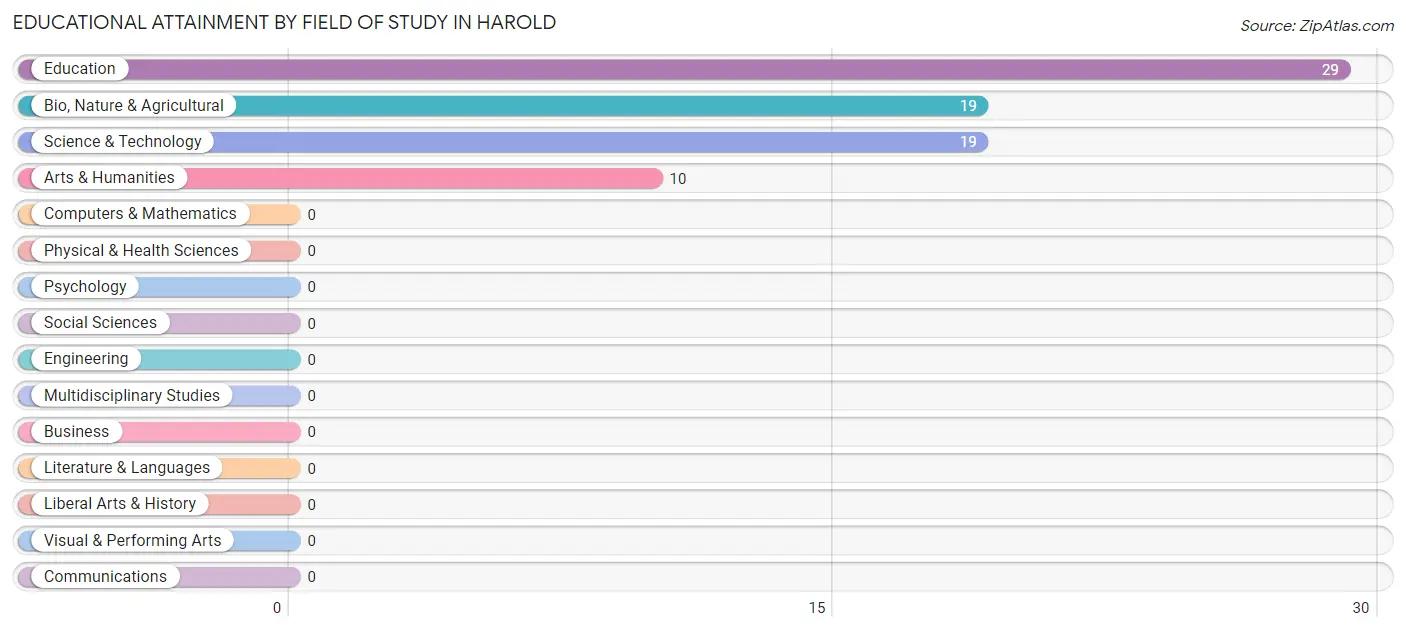
| Field of Study | # Graduates | % Graduates |
| Computers & Mathematics | 0 | 0.0% |
| Bio, Nature & Agricultural | 19 | 24.7% |
| Physical & Health Sciences | 0 | 0.0% |
| Psychology | 0 | 0.0% |
| Social Sciences | 0 | 0.0% |
| Engineering | 0 | 0.0% |
| Multidisciplinary Studies | 0 | 0.0% |
| Science & Technology | 19 | 24.7% |
| Business | 0 | 0.0% |
| Education | 29 | 37.7% |
| Literature & Languages | 0 | 0.0% |
| Liberal Arts & History | 0 | 0.0% |
| Visual & Performing Arts | 0 | 0.0% |
| Communications | 0 | 0.0% |
| Arts & Humanities | 10 | 13.0% |
| Total | 77 | 100.0% |
Transportation & Commute in Harold
Vehicle Availability by Sex in Harold
The most prevalent vehicle ownership categories in Harold are males with 4 vehicles (72, accounting for 45.9%) and females with 4 vehicles (17, making up 75.8%).
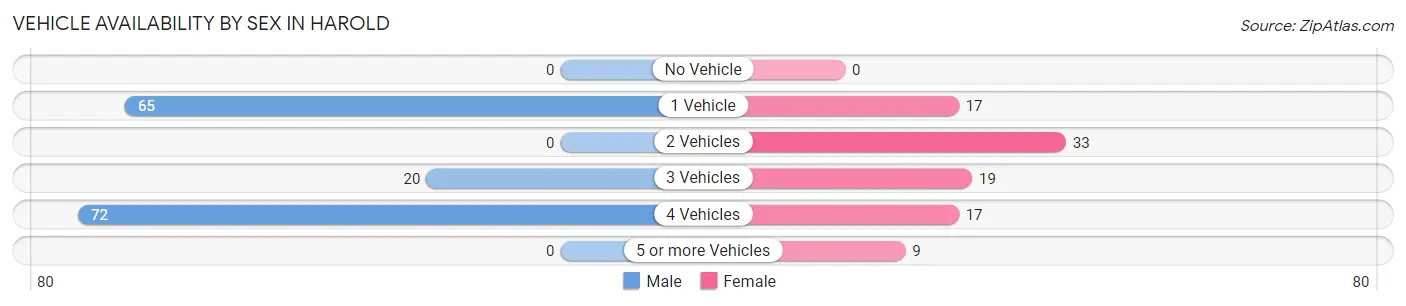
| Vehicles Available | Male | Female |
| No Vehicle | 0 (0.0%) | 0 (0.0%) |
| 1 Vehicle | 65 (41.4%) | 17 (17.9%) |
| 2 Vehicles | 0 (0.0%) | 33 (34.7%) |
| 3 Vehicles | 20 (12.7%) | 19 (20.0%) |
| 4 Vehicles | 72 (45.9%) | 17 (17.9%) |
| 5 or more Vehicles | 0 (0.0%) | 9 (9.5%) |
| Total | 157 (100.0%) | 95 (100.0%) |
Commute Time in Harold
The most frequently occuring commute durations in Harold are 60 to 89 minutes (82 commuters, 32.5%), 90 or more minutes (55 commuters, 21.8%), and 30 to 34 minutes (50 commuters, 19.8%).
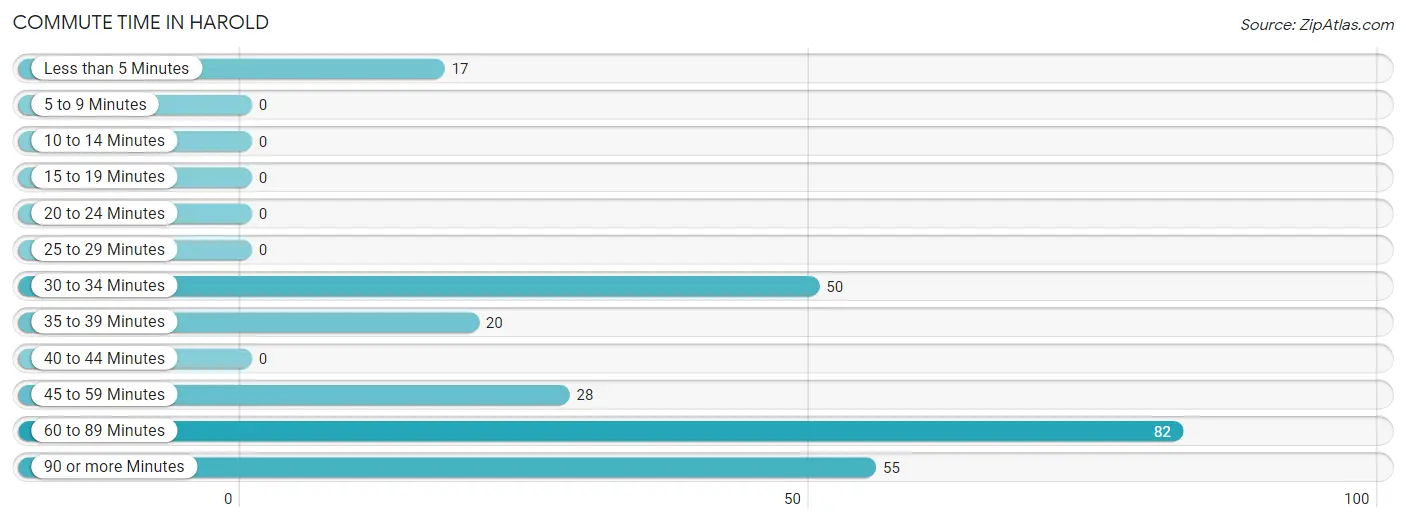
| Commute Time | # Commuters | % Commuters |
| Less than 5 Minutes | 17 | 6.8% |
| 5 to 9 Minutes | 0 | 0.0% |
| 10 to 14 Minutes | 0 | 0.0% |
| 15 to 19 Minutes | 0 | 0.0% |
| 20 to 24 Minutes | 0 | 0.0% |
| 25 to 29 Minutes | 0 | 0.0% |
| 30 to 34 Minutes | 50 | 19.8% |
| 35 to 39 Minutes | 20 | 7.9% |
| 40 to 44 Minutes | 0 | 0.0% |
| 45 to 59 Minutes | 28 | 11.1% |
| 60 to 89 Minutes | 82 | 32.5% |
| 90 or more Minutes | 55 | 21.8% |
Commute Time by Sex in Harold
The most common commute times in Harold are 60 to 89 minutes (56 commuters, 35.7%) for males and 30 to 34 minutes (50 commuters, 52.6%) for females.
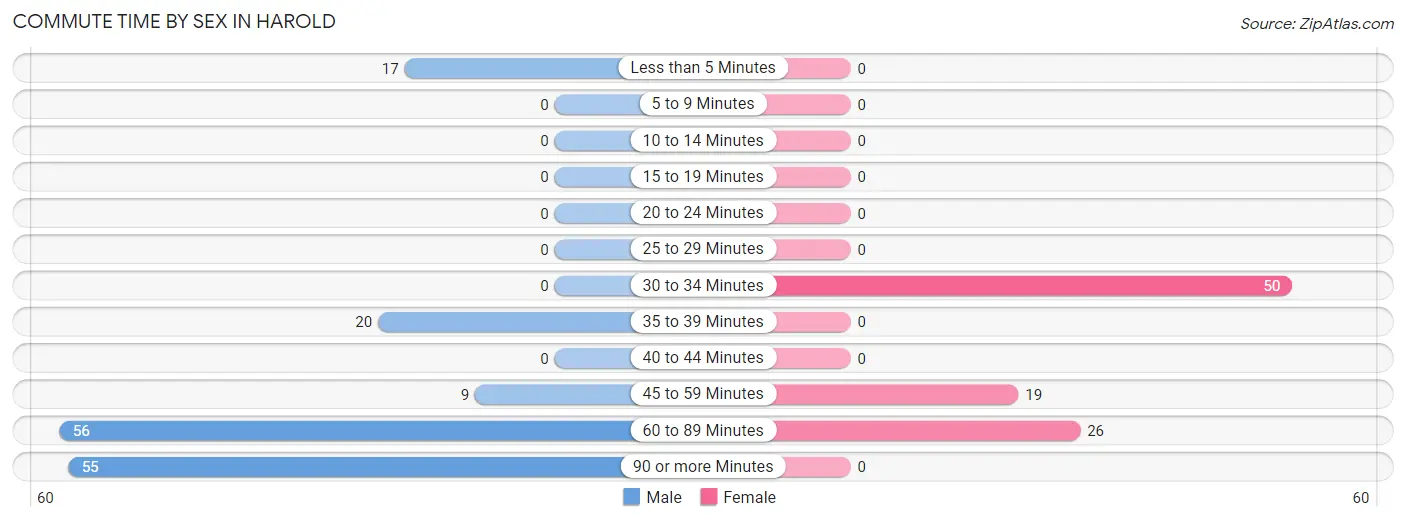
| Commute Time | Male | Female |
| Less than 5 Minutes | 17 (10.8%) | 0 (0.0%) |
| 5 to 9 Minutes | 0 (0.0%) | 0 (0.0%) |
| 10 to 14 Minutes | 0 (0.0%) | 0 (0.0%) |
| 15 to 19 Minutes | 0 (0.0%) | 0 (0.0%) |
| 20 to 24 Minutes | 0 (0.0%) | 0 (0.0%) |
| 25 to 29 Minutes | 0 (0.0%) | 0 (0.0%) |
| 30 to 34 Minutes | 0 (0.0%) | 50 (52.6%) |
| 35 to 39 Minutes | 20 (12.7%) | 0 (0.0%) |
| 40 to 44 Minutes | 0 (0.0%) | 0 (0.0%) |
| 45 to 59 Minutes | 9 (5.7%) | 19 (20.0%) |
| 60 to 89 Minutes | 56 (35.7%) | 26 (27.4%) |
| 90 or more Minutes | 55 (35.0%) | 0 (0.0%) |
Time of Departure to Work by Sex in Harold
The most frequent times of departure to work in Harold are 6:00 AM to 6:29 AM (55, 35.0%) for males and 4:00 PM to 11:59 PM (29, 30.5%) for females.
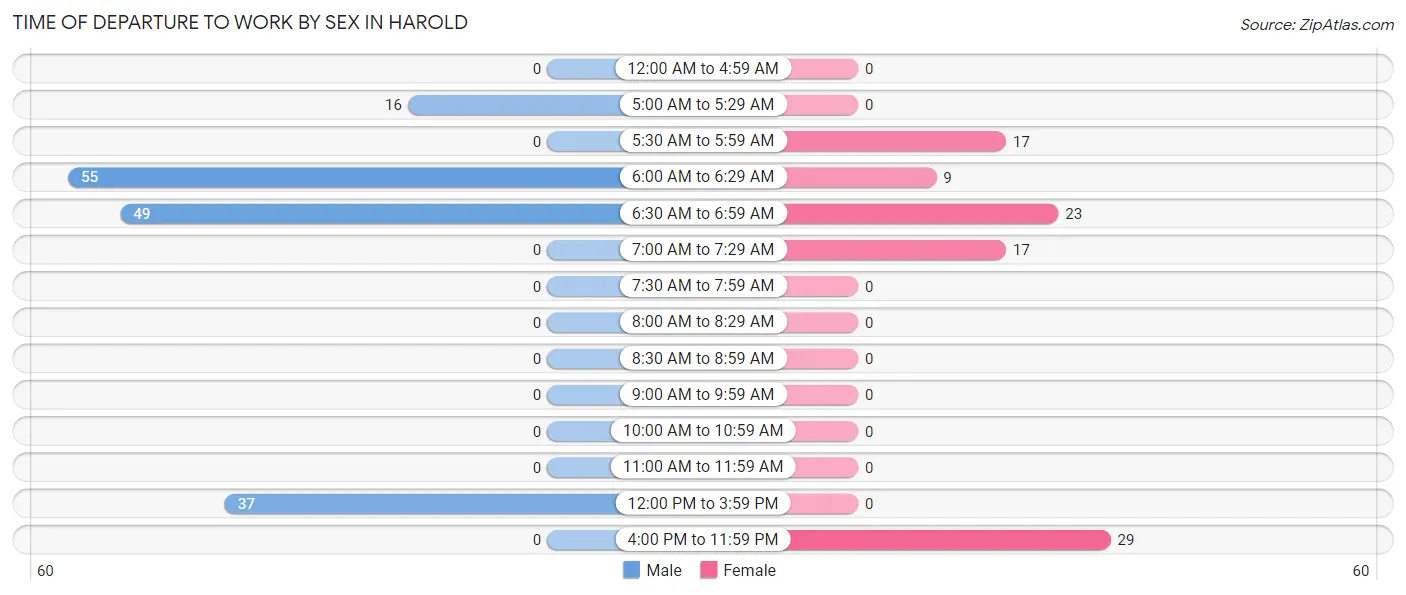
| Time of Departure | Male | Female |
| 12:00 AM to 4:59 AM | 0 (0.0%) | 0 (0.0%) |
| 5:00 AM to 5:29 AM | 16 (10.2%) | 0 (0.0%) |
| 5:30 AM to 5:59 AM | 0 (0.0%) | 17 (17.9%) |
| 6:00 AM to 6:29 AM | 55 (35.0%) | 9 (9.5%) |
| 6:30 AM to 6:59 AM | 49 (31.2%) | 23 (24.2%) |
| 7:00 AM to 7:29 AM | 0 (0.0%) | 17 (17.9%) |
| 7:30 AM to 7:59 AM | 0 (0.0%) | 0 (0.0%) |
| 8:00 AM to 8:29 AM | 0 (0.0%) | 0 (0.0%) |
| 8:30 AM to 8:59 AM | 0 (0.0%) | 0 (0.0%) |
| 9:00 AM to 9:59 AM | 0 (0.0%) | 0 (0.0%) |
| 10:00 AM to 10:59 AM | 0 (0.0%) | 0 (0.0%) |
| 11:00 AM to 11:59 AM | 0 (0.0%) | 0 (0.0%) |
| 12:00 PM to 3:59 PM | 37 (23.6%) | 0 (0.0%) |
| 4:00 PM to 11:59 PM | 0 (0.0%) | 29 (30.5%) |
| Total | 157 (100.0%) | 95 (100.0%) |
Housing Occupancy in Harold
Occupancy by Ownership in Harold
Of the total 243 dwellings in Harold, owner-occupied units account for 204 (84.0%), while renter-occupied units make up 39 (16.1%).
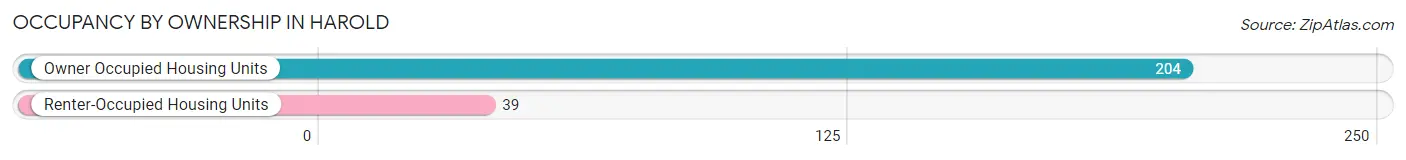
| Occupancy | # Housing Units | % Housing Units |
| Owner Occupied Housing Units | 204 | 84.0% |
| Renter-Occupied Housing Units | 39 | 16.1% |
| Total Occupied Housing Units | 243 | 100.0% |
Occupancy by Household Size in Harold
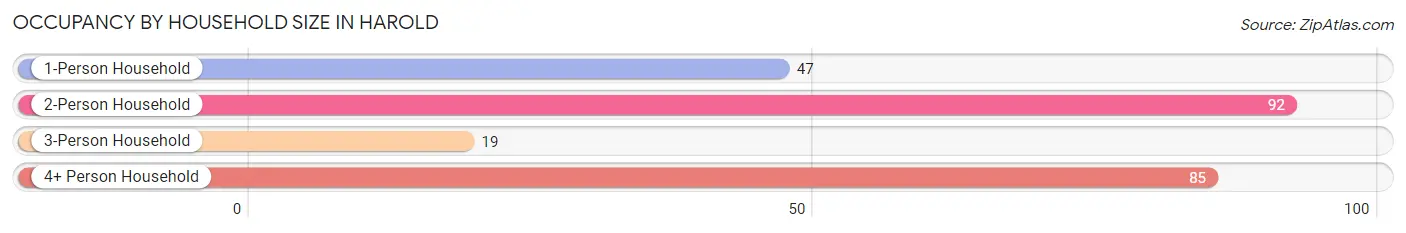
| Household Size | # Housing Units | % Housing Units |
| 1-Person Household | 47 | 19.3% |
| 2-Person Household | 92 | 37.9% |
| 3-Person Household | 19 | 7.8% |
| 4+ Person Household | 85 | 35.0% |
| Total Housing Units | 243 | 100.0% |
Occupancy by Ownership by Household Size in Harold
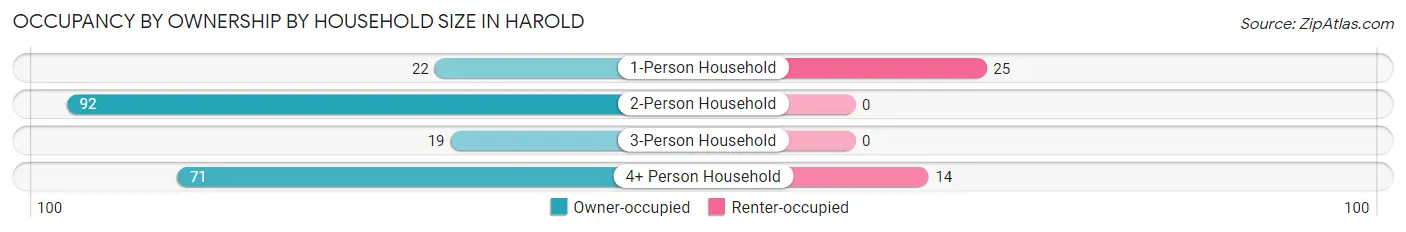
| Household Size | Owner-occupied | Renter-occupied |
| 1-Person Household | 22 (46.8%) | 25 (53.2%) |
| 2-Person Household | 92 (100.0%) | 0 (0.0%) |
| 3-Person Household | 19 (100.0%) | 0 (0.0%) |
| 4+ Person Household | 71 (83.5%) | 14 (16.5%) |
| Total Housing Units | 204 (84.0%) | 39 (16.1%) |
Occupancy by Educational Attainment in Harold
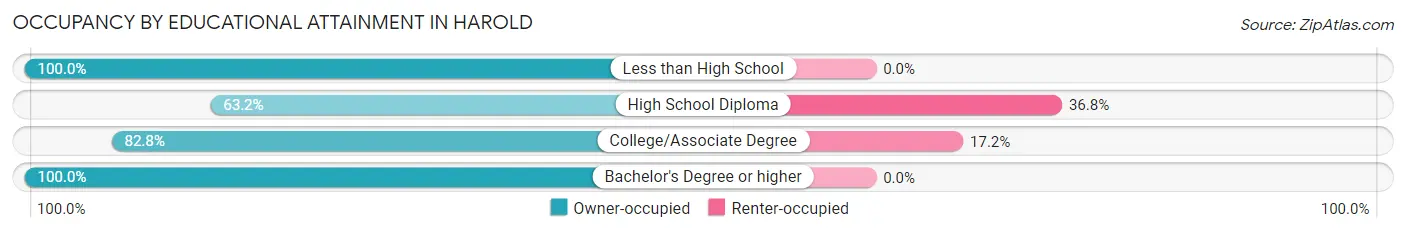
| Household Size | Owner-occupied | Renter-occupied |
| Less than High School | 16 (100.0%) | 0 (0.0%) |
| High School Diploma | 24 (63.2%) | 14 (36.8%) |
| College/Associate Degree | 120 (82.8%) | 25 (17.2%) |
| Bachelor's Degree or higher | 44 (100.0%) | 0 (0.0%) |
Occupancy by Age of Householder in Harold
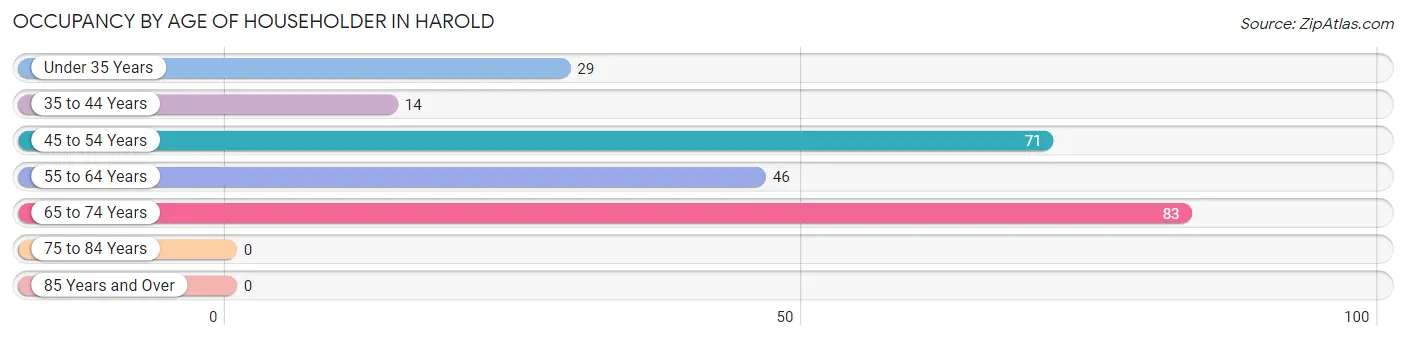
| Age Bracket | # Households | % Households |
| Under 35 Years | 29 | 11.9% |
| 35 to 44 Years | 14 | 5.8% |
| 45 to 54 Years | 71 | 29.2% |
| 55 to 64 Years | 46 | 18.9% |
| 65 to 74 Years | 83 | 34.2% |
| 75 to 84 Years | 0 | 0.0% |
| 85 Years and Over | 0 | 0.0% |
| Total | 243 | 100.0% |
Housing Finances in Harold
Median Income by Occupancy in Harold
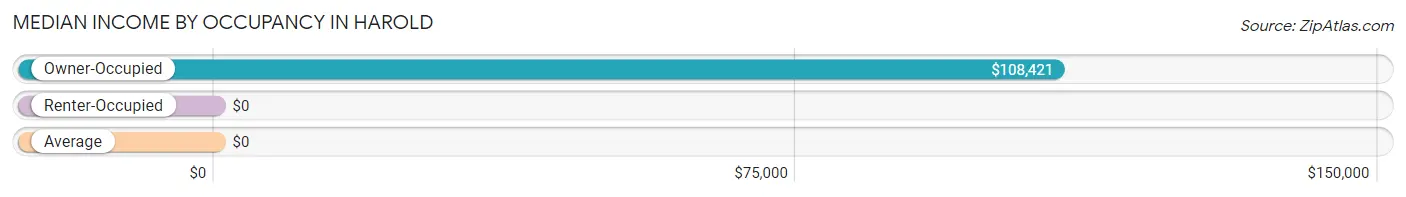
| Occupancy Type | # Households | Median Income |
| Owner-Occupied | 204 (84.0%) | $108,421 |
| Renter-Occupied | 39 (16.1%) | $0 |
| Average | 243 (100.0%) | $0 |
Occupancy by Householder Income Bracket in Harold
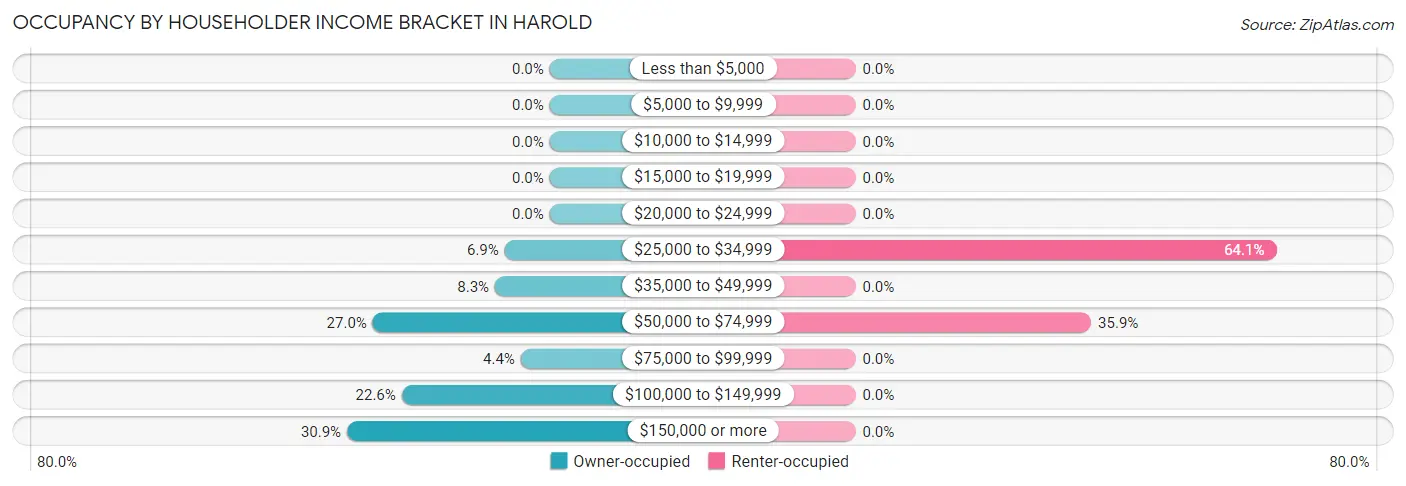
| Income Bracket | Owner-occupied | Renter-occupied |
| Less than $5,000 | 0 (0.0%) | 0 (0.0%) |
| $5,000 to $9,999 | 0 (0.0%) | 0 (0.0%) |
| $10,000 to $14,999 | 0 (0.0%) | 0 (0.0%) |
| $15,000 to $19,999 | 0 (0.0%) | 0 (0.0%) |
| $20,000 to $24,999 | 0 (0.0%) | 0 (0.0%) |
| $25,000 to $34,999 | 14 (6.9%) | 25 (64.1%) |
| $35,000 to $49,999 | 17 (8.3%) | 0 (0.0%) |
| $50,000 to $74,999 | 55 (27.0%) | 14 (35.9%) |
| $75,000 to $99,999 | 9 (4.4%) | 0 (0.0%) |
| $100,000 to $149,999 | 46 (22.6%) | 0 (0.0%) |
| $150,000 or more | 63 (30.9%) | 0 (0.0%) |
| Total | 204 (100.0%) | 39 (100.0%) |
Monthly Housing Cost Tiers in Harold
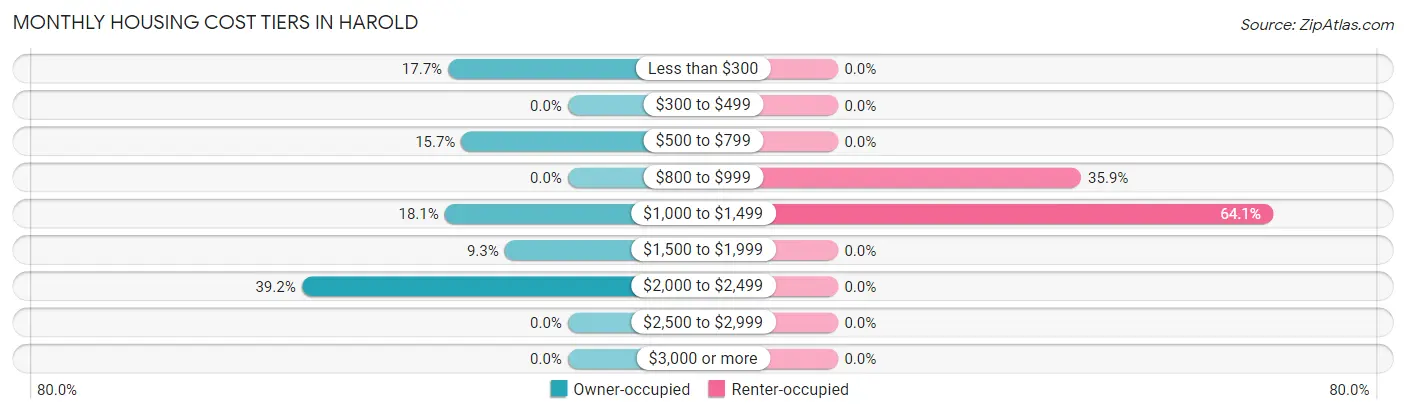
| Monthly Cost | Owner-occupied | Renter-occupied |
| Less than $300 | 36 (17.6%) | 0 (0.0%) |
| $300 to $499 | 0 (0.0%) | 0 (0.0%) |
| $500 to $799 | 32 (15.7%) | 0 (0.0%) |
| $800 to $999 | 0 (0.0%) | 14 (35.9%) |
| $1,000 to $1,499 | 37 (18.1%) | 25 (64.1%) |
| $1,500 to $1,999 | 19 (9.3%) | 0 (0.0%) |
| $2,000 to $2,499 | 80 (39.2%) | 0 (0.0%) |
| $2,500 to $2,999 | 0 (0.0%) | 0 (0.0%) |
| $3,000 or more | 0 (0.0%) | 0 (0.0%) |
| Total | 204 (100.0%) | 39 (100.0%) |
Physical Housing Characteristics in Harold
Housing Structures in Harold
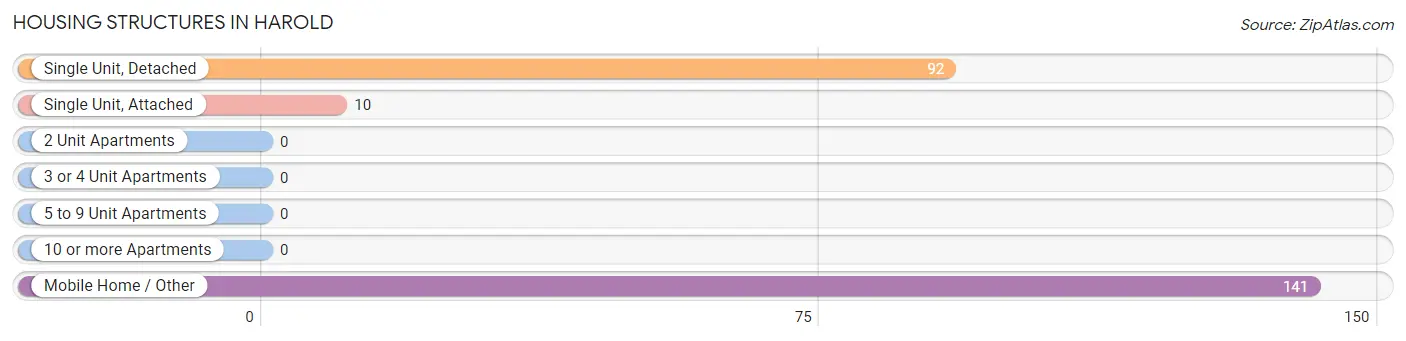
| Structure Type | # Housing Units | % Housing Units |
| Single Unit, Detached | 92 | 37.9% |
| Single Unit, Attached | 10 | 4.1% |
| 2 Unit Apartments | 0 | 0.0% |
| 3 or 4 Unit Apartments | 0 | 0.0% |
| 5 to 9 Unit Apartments | 0 | 0.0% |
| 10 or more Apartments | 0 | 0.0% |
| Mobile Home / Other | 141 | 58.0% |
| Total | 243 | 100.0% |
Housing Structures by Occupancy in Harold
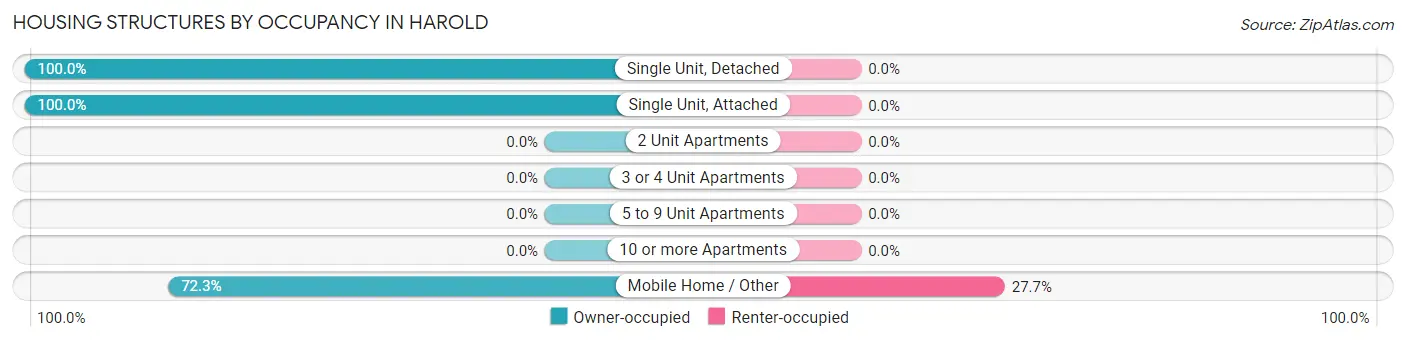
| Structure Type | Owner-occupied | Renter-occupied |
| Single Unit, Detached | 92 (100.0%) | 0 (0.0%) |
| Single Unit, Attached | 10 (100.0%) | 0 (0.0%) |
| 2 Unit Apartments | 0 (0.0%) | 0 (0.0%) |
| 3 or 4 Unit Apartments | 0 (0.0%) | 0 (0.0%) |
| 5 to 9 Unit Apartments | 0 (0.0%) | 0 (0.0%) |
| 10 or more Apartments | 0 (0.0%) | 0 (0.0%) |
| Mobile Home / Other | 102 (72.3%) | 39 (27.7%) |
| Total | 204 (84.0%) | 39 (16.1%) |
Housing Structures by Number of Rooms in Harold
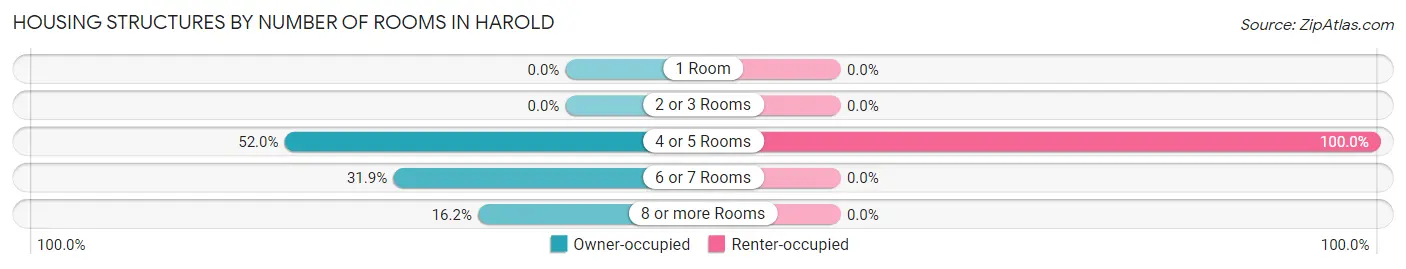
| Number of Rooms | Owner-occupied | Renter-occupied |
| 1 Room | 0 (0.0%) | 0 (0.0%) |
| 2 or 3 Rooms | 0 (0.0%) | 0 (0.0%) |
| 4 or 5 Rooms | 106 (52.0%) | 39 (100.0%) |
| 6 or 7 Rooms | 65 (31.9%) | 0 (0.0%) |
| 8 or more Rooms | 33 (16.2%) | 0 (0.0%) |
| Total | 204 (100.0%) | 39 (100.0%) |
Housing Structure by Heating Type in Harold
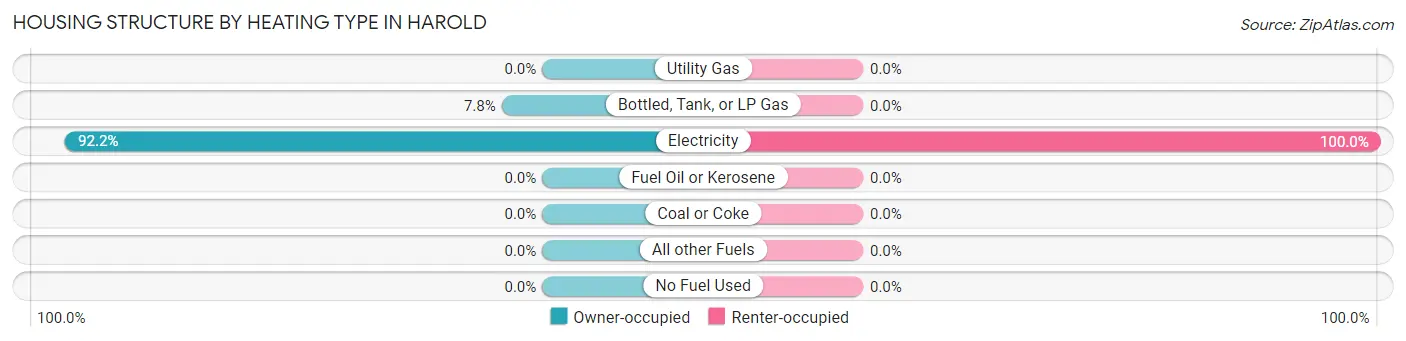
| Heating Type | Owner-occupied | Renter-occupied |
| Utility Gas | 0 (0.0%) | 0 (0.0%) |
| Bottled, Tank, or LP Gas | 16 (7.8%) | 0 (0.0%) |
| Electricity | 188 (92.2%) | 39 (100.0%) |
| Fuel Oil or Kerosene | 0 (0.0%) | 0 (0.0%) |
| Coal or Coke | 0 (0.0%) | 0 (0.0%) |
| All other Fuels | 0 (0.0%) | 0 (0.0%) |
| No Fuel Used | 0 (0.0%) | 0 (0.0%) |
| Total | 204 (100.0%) | 39 (100.0%) |
Household Vehicle Usage in Harold
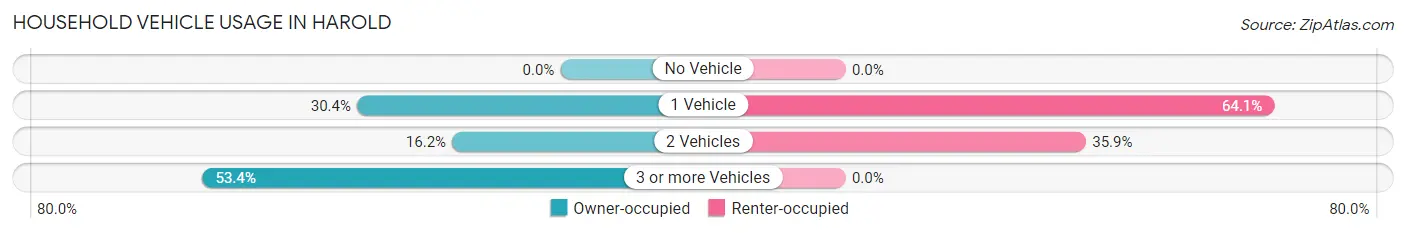
| Vehicles per Household | Owner-occupied | Renter-occupied |
| No Vehicle | 0 (0.0%) | 0 (0.0%) |
| 1 Vehicle | 62 (30.4%) | 25 (64.1%) |
| 2 Vehicles | 33 (16.2%) | 14 (35.9%) |
| 3 or more Vehicles | 109 (53.4%) | 0 (0.0%) |
| Total | 204 (100.0%) | 39 (100.0%) |
Real Estate & Mortgages in Harold
Real Estate and Mortgage Overview in Harold
| Characteristic | Without Mortgage | With Mortgage |
| Housing Units | 88 | 116 |
| Median Property Value | - | - |
| Median Household Income | $52,031 | $63 |
| Monthly Housing Costs | - | - |
| Real Estate Taxes | $199 | $0 |
Property Value by Mortgage Status in Harold
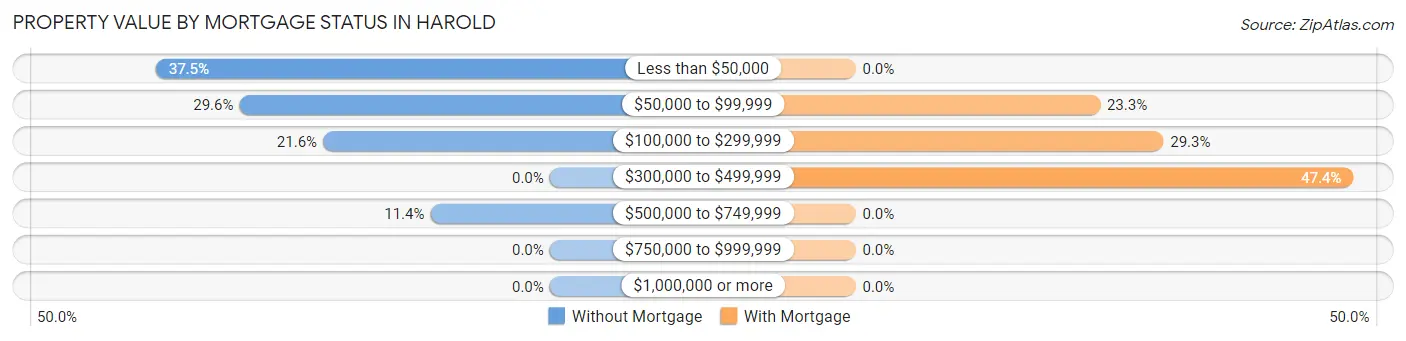
| Property Value | Without Mortgage | With Mortgage |
| Less than $50,000 | 33 (37.5%) | 0 (0.0%) |
| $50,000 to $99,999 | 26 (29.5%) | 27 (23.3%) |
| $100,000 to $299,999 | 19 (21.6%) | 34 (29.3%) |
| $300,000 to $499,999 | 0 (0.0%) | 55 (47.4%) |
| $500,000 to $749,999 | 10 (11.4%) | 0 (0.0%) |
| $750,000 to $999,999 | 0 (0.0%) | 0 (0.0%) |
| $1,000,000 or more | 0 (0.0%) | 0 (0.0%) |
| Total | 88 (100.0%) | 116 (100.0%) |
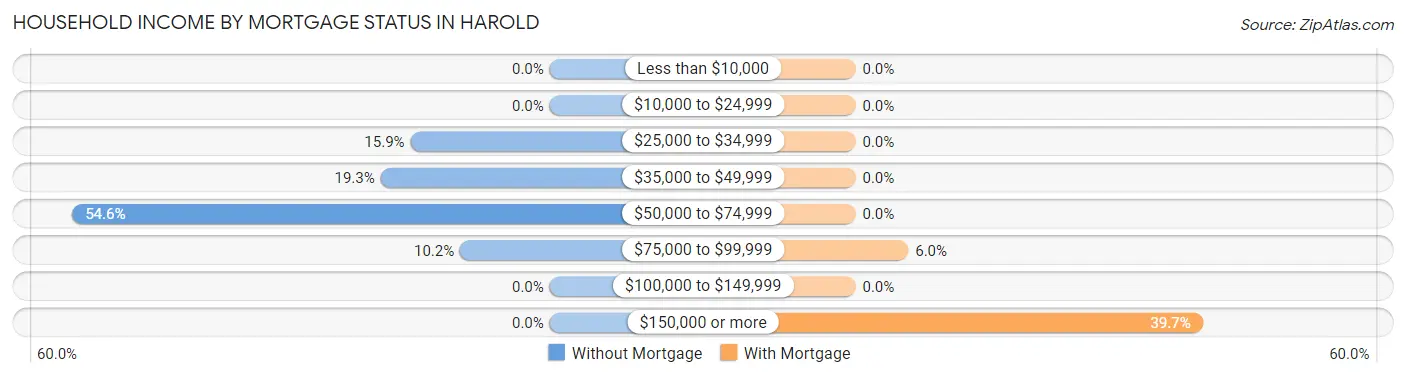
Household Income by Mortgage Status in Harold
| Household Income | Without Mortgage | With Mortgage |
| Less than $10,000 | 0 (0.0%) | 0 (0.0%) |
| $10,000 to $24,999 | 0 (0.0%) | 0 (0.0%) |
| $25,000 to $34,999 | 14 (15.9%) | 0 (0.0%) |
| $35,000 to $49,999 | 17 (19.3%) | 0 (0.0%) |
| $50,000 to $74,999 | 48 (54.5%) | 0 (0.0%) |
| $75,000 to $99,999 | 9 (10.2%) | 7 (6.0%) |
| $100,000 to $149,999 | 0 (0.0%) | 0 (0.0%) |
| $150,000 or more | 0 (0.0%) | 46 (39.7%) |
| Total | 88 (100.0%) | 116 (100.0%) |
Property Value to Household Income Ratio in Harold
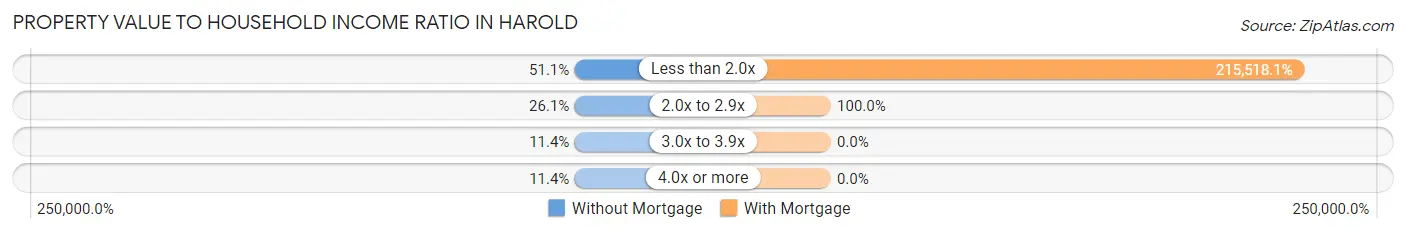
| Value-to-Income Ratio | Without Mortgage | With Mortgage |
| Less than 2.0x | 45 (51.1%) | 250,001 (215,518.1%) |
| 2.0x to 2.9x | 23 (26.1%) | 116 (100.0%) |
| 3.0x to 3.9x | 10 (11.4%) | 0 (0.0%) |
| 4.0x or more | 10 (11.4%) | 0 (0.0%) |
| Total | 88 (100.0%) | 116 (100.0%) |
Real Estate Taxes by Mortgage Status in Harold
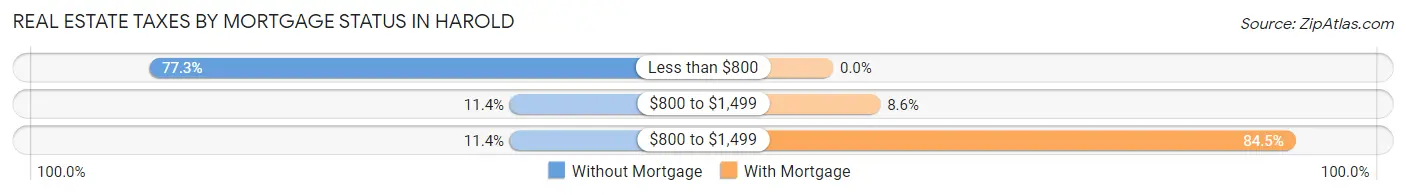
| Property Taxes | Without Mortgage | With Mortgage |
| Less than $800 | 68 (77.3%) | 0 (0.0%) |
| $800 to $1,499 | 10 (11.4%) | 10 (8.6%) |
| $800 to $1,499 | 10 (11.4%) | 98 (84.5%) |
| Total | 88 (100.0%) | 116 (100.0%) |
Health & Disability in Harold
Health Insurance Coverage by Age in Harold
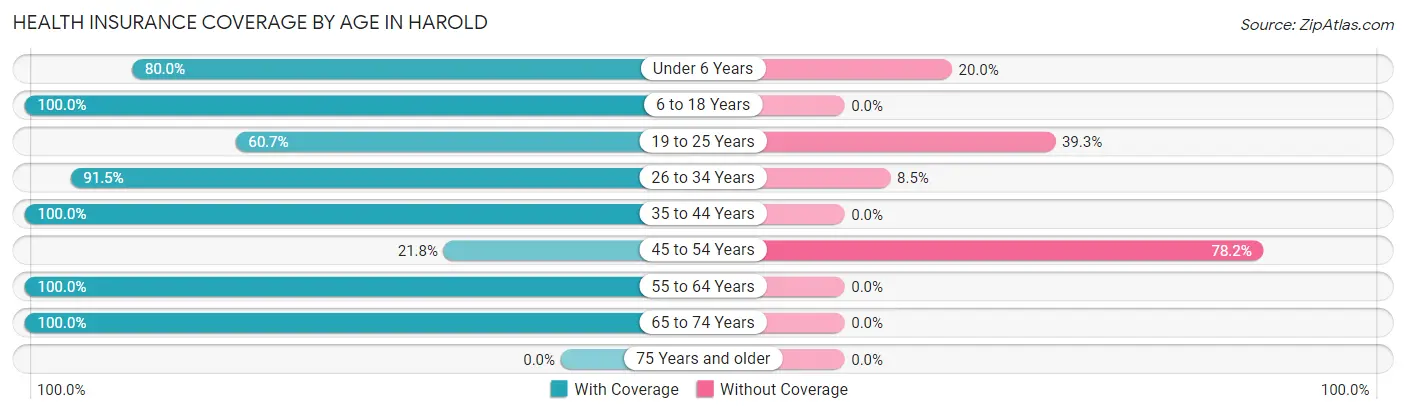
| Age Bracket | With Coverage | Without Coverage |
| Under 6 Years | 72 (80.0%) | 18 (20.0%) |
| 6 to 18 Years | 100 (100.0%) | 0 (0.0%) |
| 19 to 25 Years | 17 (60.7%) | 11 (39.3%) |
| 26 to 34 Years | 225 (91.5%) | 21 (8.5%) |
| 35 to 44 Years | 72 (100.0%) | 0 (0.0%) |
| 45 to 54 Years | 31 (21.8%) | 111 (78.2%) |
| 55 to 64 Years | 46 (100.0%) | 0 (0.0%) |
| 65 to 74 Years | 139 (100.0%) | 0 (0.0%) |
| 75 Years and older | 0 (0.0%) | 0 (0.0%) |
| Total | 702 (81.3%) | 161 (18.7%) |
Health Insurance Coverage by Citizenship Status in Harold
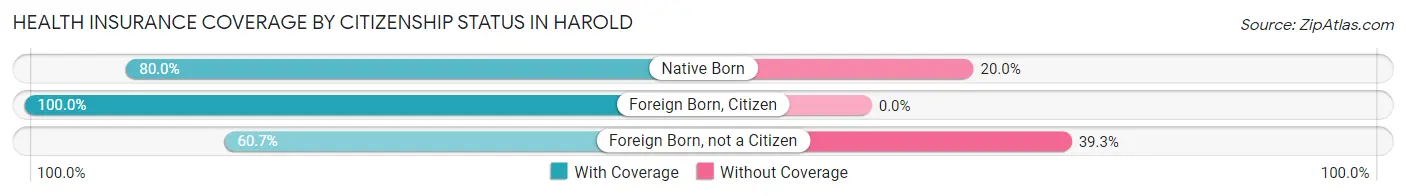
| Citizenship Status | With Coverage | Without Coverage |
| Native Born | 72 (80.0%) | 18 (20.0%) |
| Foreign Born, Citizen | 100 (100.0%) | 0 (0.0%) |
| Foreign Born, not a Citizen | 17 (60.7%) | 11 (39.3%) |
Health Insurance Coverage by Household Income in Harold
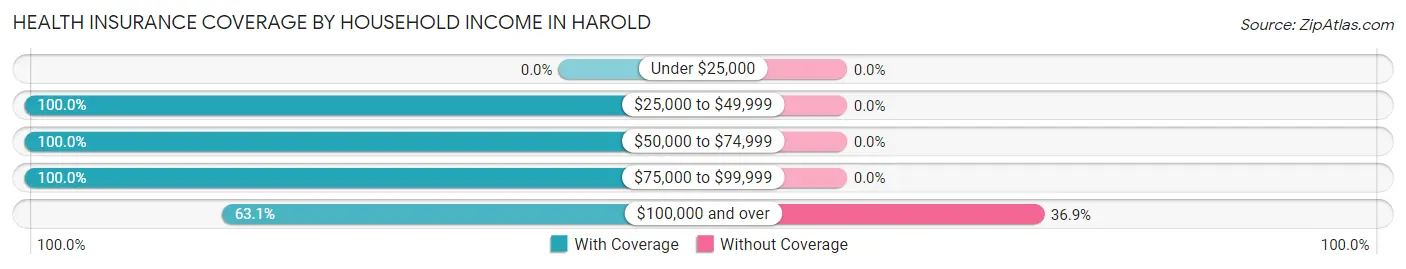
| Household Income | With Coverage | Without Coverage |
| Under $25,000 | 0 (0.0%) | 0 (0.0%) |
| $25,000 to $49,999 | 87 (100.0%) | 0 (0.0%) |
| $50,000 to $74,999 | 322 (100.0%) | 0 (0.0%) |
| $75,000 to $99,999 | 18 (100.0%) | 0 (0.0%) |
| $100,000 and over | 275 (63.1%) | 161 (36.9%) |
Public vs Private Health Insurance Coverage by Age in Harold
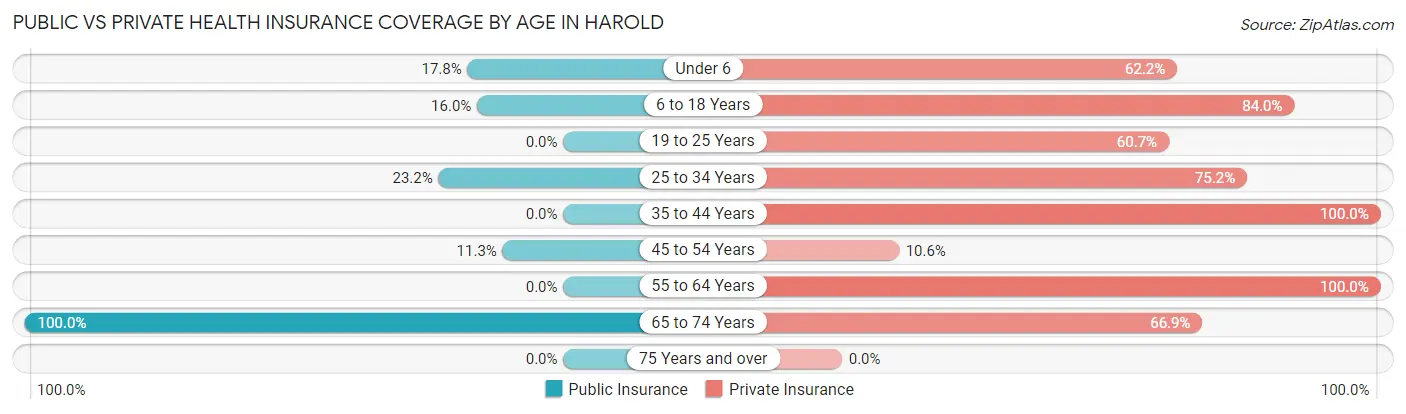
| Age Bracket | Public Insurance | Private Insurance |
| Under 6 | 16 (17.8%) | 56 (62.2%) |
| 6 to 18 Years | 16 (16.0%) | 84 (84.0%) |
| 19 to 25 Years | 0 (0.0%) | 17 (60.7%) |
| 25 to 34 Years | 57 (23.2%) | 185 (75.2%) |
| 35 to 44 Years | 0 (0.0%) | 72 (100.0%) |
| 45 to 54 Years | 16 (11.3%) | 15 (10.6%) |
| 55 to 64 Years | 0 (0.0%) | 46 (100.0%) |
| 65 to 74 Years | 139 (100.0%) | 93 (66.9%) |
| 75 Years and over | 0 (0.0%) | 0 (0.0%) |
| Total | 244 (28.3%) | 568 (65.8%) |
Disability Status by Sex by Age in Harold
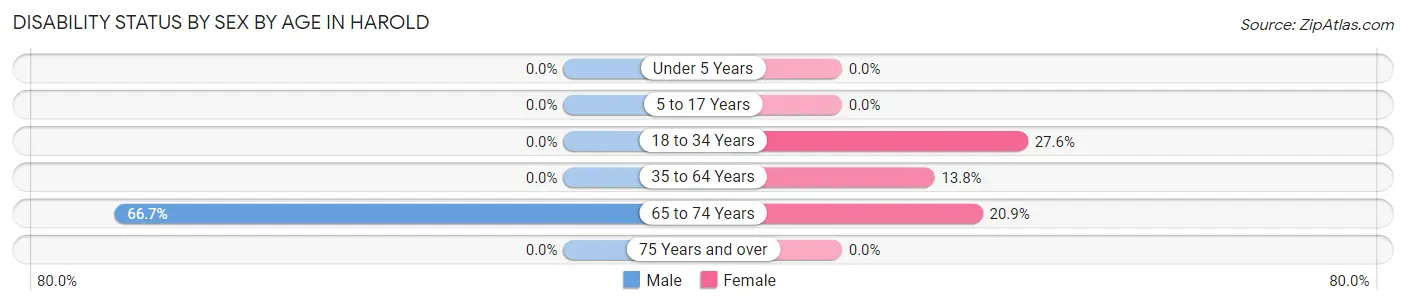
| Age Bracket | Male | Female |
| Under 5 Years | 0 (0.0%) | 0 (0.0%) |
| 5 to 17 Years | 0 (0.0%) | 0 (0.0%) |
| 18 to 34 Years | 0 (0.0%) | 37 (27.6%) |
| 35 to 64 Years | 0 (0.0%) | 15 (13.8%) |
| 65 to 74 Years | 48 (66.7%) | 14 (20.9%) |
| 75 Years and over | 0 (0.0%) | 0 (0.0%) |
Disability Class by Sex by Age in Harold
Disability Class: Hearing Difficulty
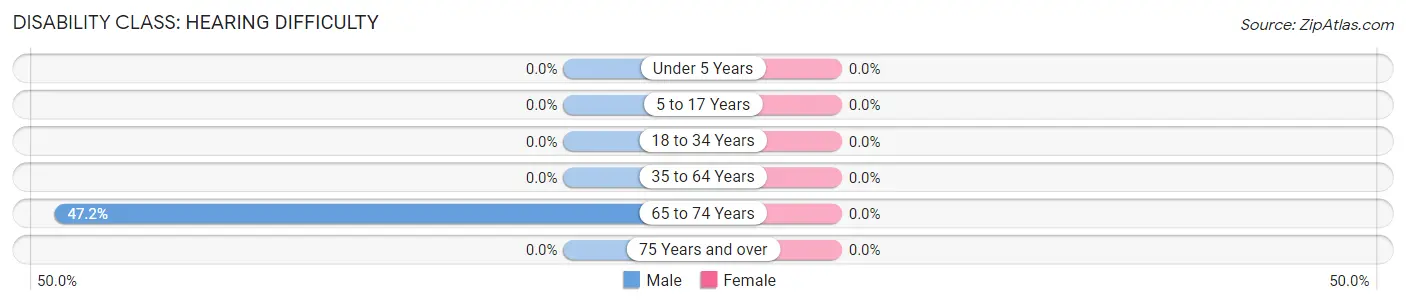
| Age Bracket | Male | Female |
| Under 5 Years | 0 (0.0%) | 0 (0.0%) |
| 5 to 17 Years | 0 (0.0%) | 0 (0.0%) |
| 18 to 34 Years | 0 (0.0%) | 0 (0.0%) |
| 35 to 64 Years | 0 (0.0%) | 0 (0.0%) |
| 65 to 74 Years | 34 (47.2%) | 0 (0.0%) |
| 75 Years and over | 0 (0.0%) | 0 (0.0%) |
Disability Class: Vision Difficulty
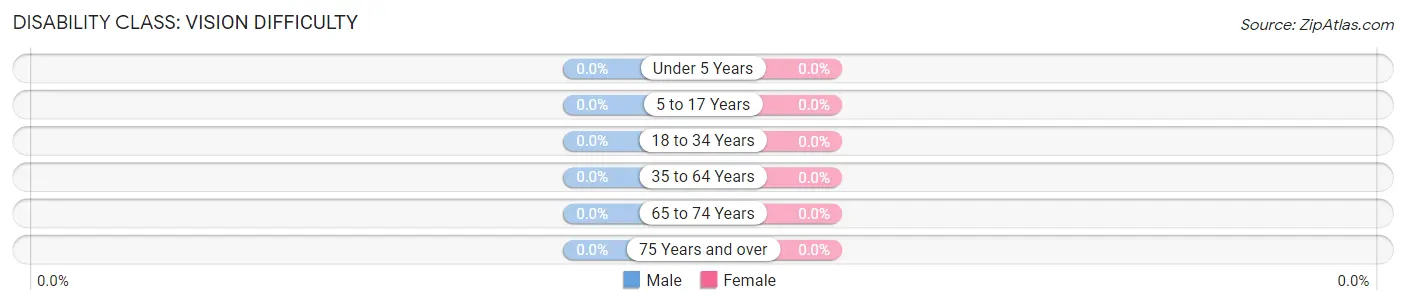
| Age Bracket | Male | Female |
| Under 5 Years | 0 (0.0%) | 0 (0.0%) |
| 5 to 17 Years | 0 (0.0%) | 0 (0.0%) |
| 18 to 34 Years | 0 (0.0%) | 0 (0.0%) |
| 35 to 64 Years | 0 (0.0%) | 0 (0.0%) |
| 65 to 74 Years | 0 (0.0%) | 0 (0.0%) |
| 75 Years and over | 0 (0.0%) | 0 (0.0%) |
Disability Class: Cognitive Difficulty
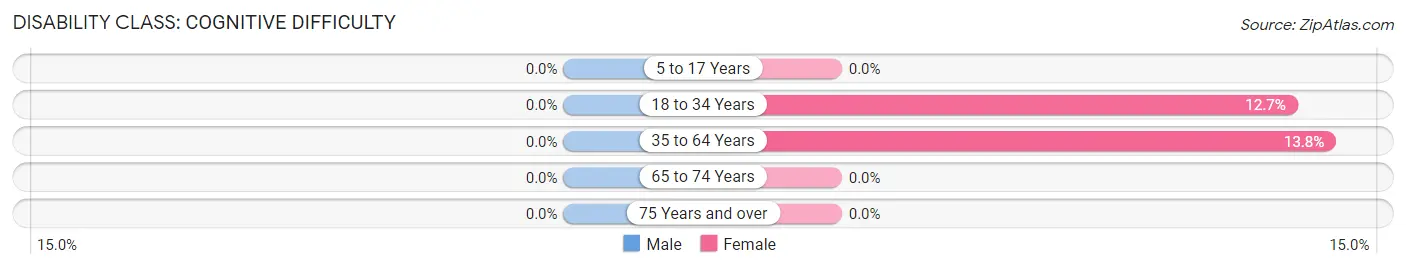
| Age Bracket | Male | Female |
| 5 to 17 Years | 0 (0.0%) | 0 (0.0%) |
| 18 to 34 Years | 0 (0.0%) | 17 (12.7%) |
| 35 to 64 Years | 0 (0.0%) | 15 (13.8%) |
| 65 to 74 Years | 0 (0.0%) | 0 (0.0%) |
| 75 Years and over | 0 (0.0%) | 0 (0.0%) |
Disability Class: Ambulatory Difficulty
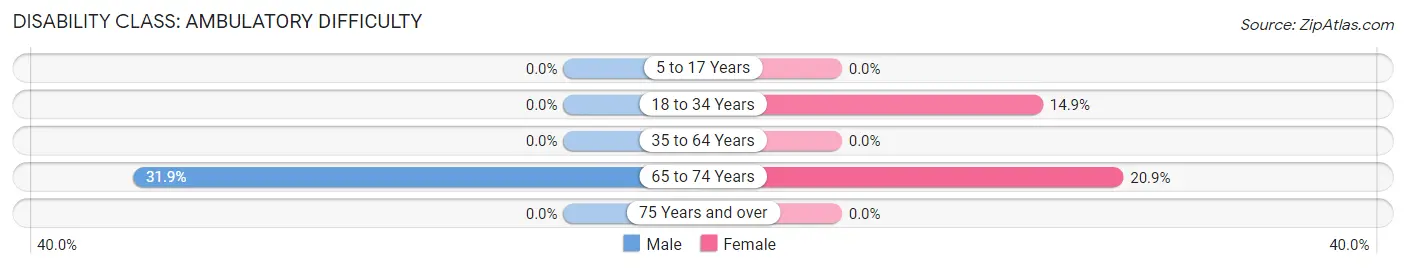
| Age Bracket | Male | Female |
| 5 to 17 Years | 0 (0.0%) | 0 (0.0%) |
| 18 to 34 Years | 0 (0.0%) | 20 (14.9%) |
| 35 to 64 Years | 0 (0.0%) | 0 (0.0%) |
| 65 to 74 Years | 23 (31.9%) | 14 (20.9%) |
| 75 Years and over | 0 (0.0%) | 0 (0.0%) |
Disability Class: Self-Care Difficulty
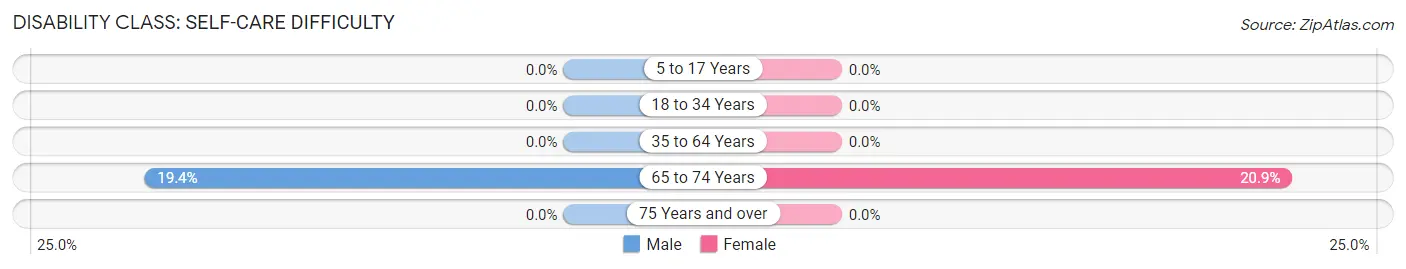
| Age Bracket | Male | Female |
| 5 to 17 Years | 0 (0.0%) | 0 (0.0%) |
| 18 to 34 Years | 0 (0.0%) | 0 (0.0%) |
| 35 to 64 Years | 0 (0.0%) | 0 (0.0%) |
| 65 to 74 Years | 14 (19.4%) | 14 (20.9%) |
| 75 Years and over | 0 (0.0%) | 0 (0.0%) |
Technology Access in Harold
Computing Device Access in Harold
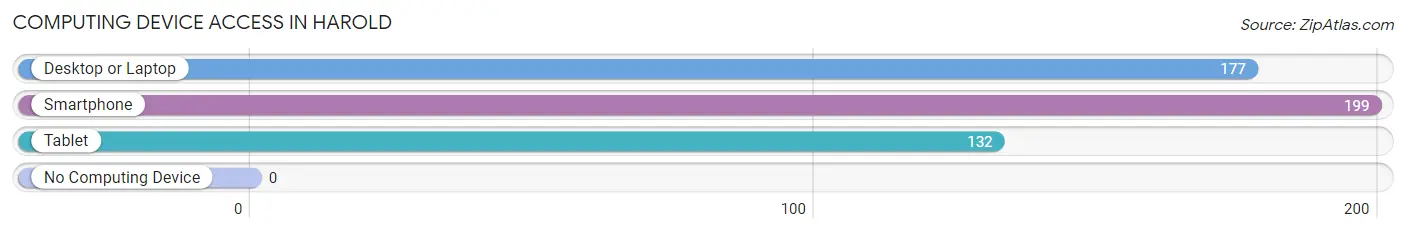
| Device Type | # Households | % Households |
| Desktop or Laptop | 177 | 72.8% |
| Smartphone | 199 | 81.9% |
| Tablet | 132 | 54.3% |
| No Computing Device | 0 | 0.0% |
| Total | 243 | 100.0% |
Internet Access in Harold
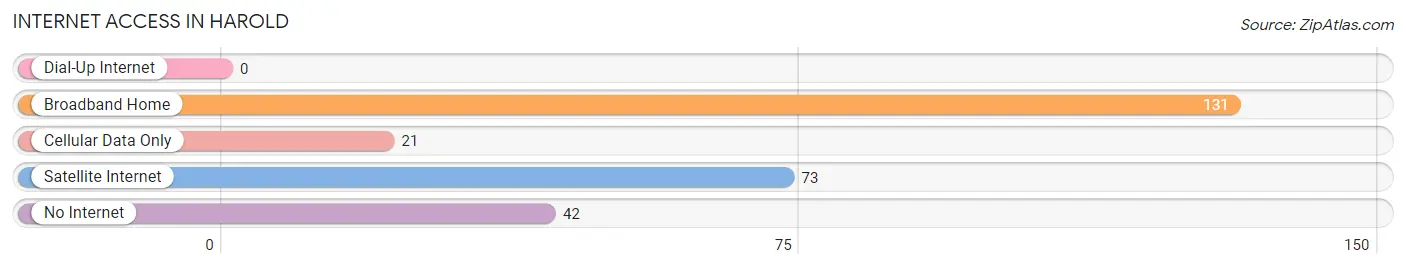
| Internet Type | # Households | % Households |
| Dial-Up Internet | 0 | 0.0% |
| Broadband Home | 131 | 53.9% |
| Cellular Data Only | 21 | 8.6% |
| Satellite Internet | 73 | 30.0% |
| No Internet | 42 | 17.3% |
| Total | 243 | 100.0% |
Harold Summary
Harold, Florida is a small town located in the Panhandle region of the state. It is situated in Okaloosa County, approximately 20 miles east of the city of Crestview. The town has a population of just over 1,000 people, and is known for its rural charm and friendly atmosphere.
History
Harold was founded in 1883 by a group of settlers from Georgia. The town was named after the first postmaster, William Harold. The town was originally a farming community, and the main crops grown were cotton, corn, and peanuts. In the early 1900s, the town began to grow and develop, and by the 1920s, it had become a thriving community.
In the 1950s, the town began to experience a decline in population as many of the younger residents moved away in search of better job opportunities. However, in the late 1970s, the town began to experience a resurgence in population as people began to move back to the area.
Geography
Harold is located in the Florida Panhandle, approximately 20 miles east of the city of Crestview. The town is situated in Okaloosa County, and is bordered by the Blackwater River to the north and the Shoal River to the south. The town is located at an elevation of approximately 100 feet above sea level.
The climate in Harold is classified as humid subtropical, with hot, humid summers and mild winters. The average annual temperature is around 70 degrees Fahrenheit, and the average annual precipitation is around 50 inches.
Economy
The economy of Harold is largely based on agriculture. The main crops grown in the area are cotton, corn, and peanuts. In addition, the town is home to several small businesses, including a grocery store, a hardware store, and a few restaurants.
The town is also home to a number of tourist attractions, including the Blackwater River State Park, the Shoal River State Park, and the Harold Wildlife Management Area. These attractions draw visitors from all over the state and beyond, providing a boost to the local economy.
Demographics
As of the 2010 census, the population of Harold was 1,072. The racial makeup of the town was 94.3% White, 2.2% African American, 0.7% Native American, 0.3% Asian, 0.1% Pacific Islander, and 2.4% from other races. The median household income was $37,917, and the median family income was $45,625.
Conclusion
Harold, Florida is a small town located in the Panhandle region of the state. It is situated in Okaloosa County, and has a population of just over 1,000 people. The town is known for its rural charm and friendly atmosphere, and its economy is largely based on agriculture. The town is also home to a number of tourist attractions, which provide a boost to the local economy.
Common Questions
What is Per Capita Income in Harold?
Per Capita income in Harold is $41,275.
What is the Median Family Income in Harold?
Median Family Income in Harold is $108,947.
What is Income or Wage Gap in Harold?
Income or Wage Gap in Harold is 11.0%.
Women in Harold earn 89.0 cents for every dollar earned by a man.
What is Inequality or Gini Index in Harold?
Inequality or Gini Index in Harold is 0.44.
What is the Total Population of Harold?
Total Population of Harold is 863.
What is the Total Male Population of Harold?
Total Male Population of Harold is 424.
What is the Total Female Population of Harold?
Total Female Population of Harold is 439.
What is the Ratio of Males per 100 Females in Harold?
There are 96.58 Males per 100 Females in Harold.
What is the Ratio of Females per 100 Males in Harold?
There are 103.54 Females per 100 Males in Harold.
What is the Median Population Age in Harold?
Median Population Age in Harold is 32.6 Years.
What is the Average Family Size in Harold
Average Family Size in Harold is 4.2 People.
What is the Average Household Size in Harold
Average Household Size in Harold is 3.5 People.
How Large is the Labor Force in Harold?
There are 449 People in the Labor Forcein in Harold.
What is the Percentage of People in the Labor Force in Harold?
66.7% of People are in the Labor Force in Harold.
What is the Unemployment Rate in Harold?
Unemployment Rate in Harold is 12.9%.