Samoset, FL Map & Demographics
Samoset Map
Samoset Overview
$23,091
PER CAPITA INCOME
$54,800
AVG FAMILY INCOME
$45,188
AVG HOUSEHOLD INCOME
14.9%
WAGE / INCOME GAP [ % ]
85.1¢/ $1
WAGE / INCOME GAP [ $ ]
0.41
INEQUALITY / GINI INDEX
4,235
TOTAL POPULATION
1,917
MALE POPULATION
2,318
FEMALE POPULATION
82.70
MALES / 100 FEMALES
120.92
FEMALES / 100 MALES
43.7
MEDIAN AGE
3.9
AVG FAMILY SIZE
3.2
AVG HOUSEHOLD SIZE
2,017
LABOR FORCE [ PEOPLE ]
57.2%
PERCENT IN LABOR FORCE
6.7%
UNEMPLOYMENT RATE
Income in Samoset
Income Overview in Samoset
Per Capita Income in Samoset is $23,091, while median incomes of families and households are $54,800 and $45,188 respectively.
| Characteristic | Number | Measure |
| Per Capita Income | 4,235 | $23,091 |
| Median Family Income | 978 | $54,800 |
| Mean Family Income | 978 | $68,660 |
| Median Household Income | 1,302 | $45,188 |
| Mean Household Income | 1,302 | $60,740 |
| Income Deficit | 978 | $0 |
| Wage / Income Gap (%) | 4,235 | 14.89% |
| Wage / Income Gap ($) | 4,235 | 85.11¢ per $1 |
| Gini / Inequality Index | 4,235 | 0.41 |
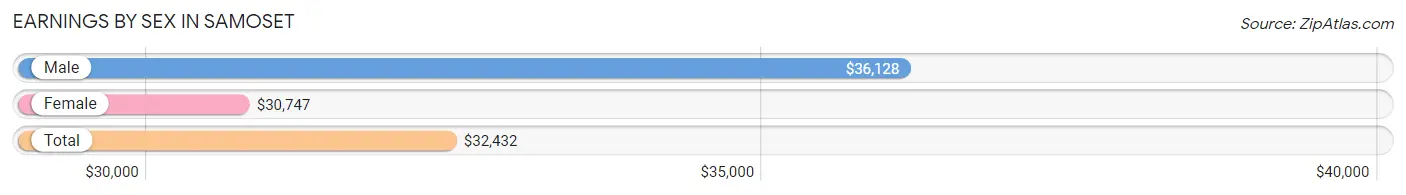
Earnings by Sex in Samoset
Average Earnings in Samoset are $32,432, $36,128 for men and $30,747 for women, a difference of 14.9%.
| Sex | Number | Average Earnings |
| Male | 767 (39.8%) | $36,128 |
| Female | 1,159 (60.2%) | $30,747 |
| Total | 1,926 (100.0%) | $32,432 |
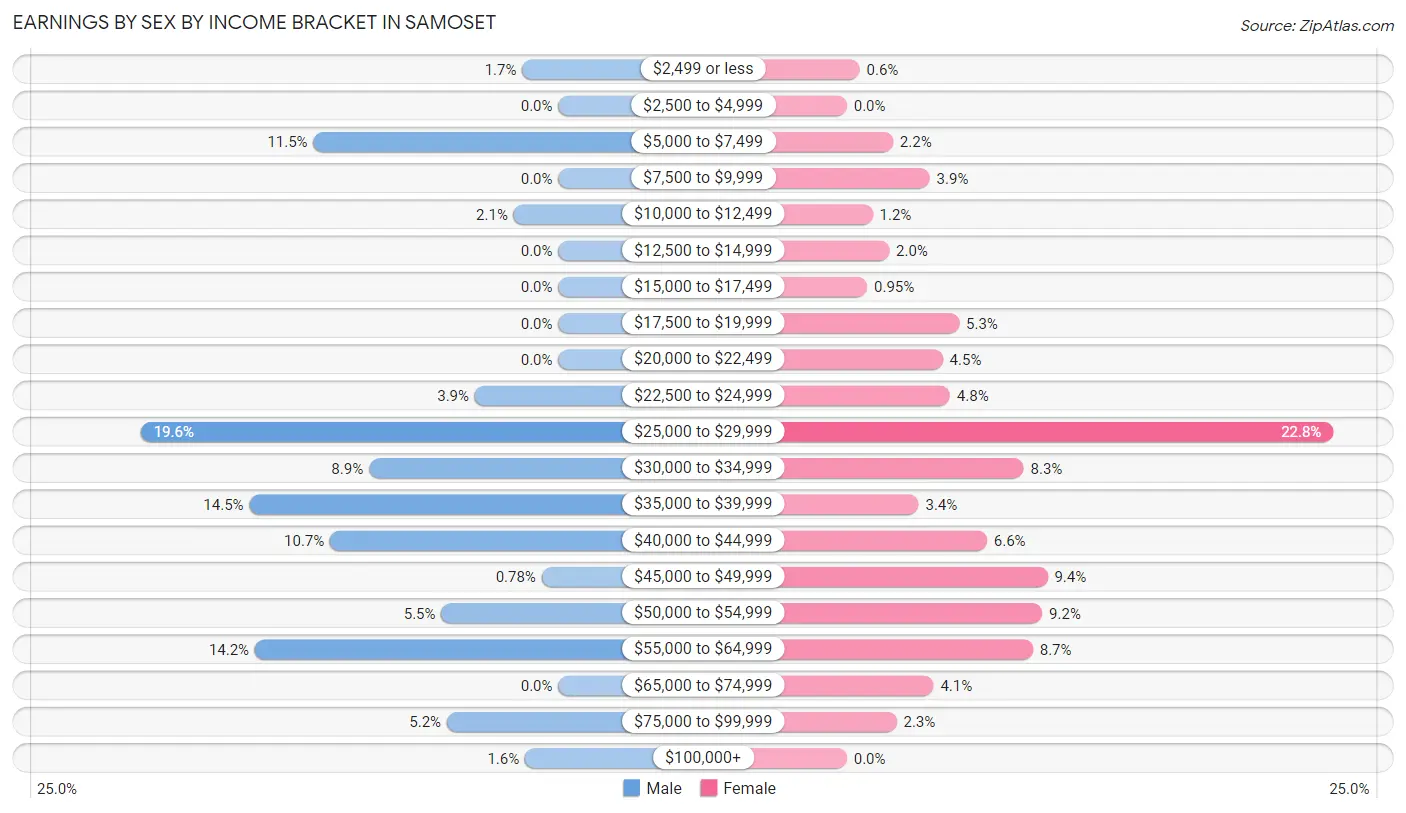
Earnings by Sex by Income Bracket in Samoset
The most common earnings brackets in Samoset are $25,000 to $29,999 for men (150 | 19.6%) and $25,000 to $29,999 for women (264 | 22.8%).
| Income | Male | Female |
| $2,499 or less | 13 (1.7%) | 7 (0.6%) |
| $2,500 to $4,999 | 0 (0.0%) | 0 (0.0%) |
| $5,000 to $7,499 | 88 (11.5%) | 25 (2.2%) |
| $7,500 to $9,999 | 0 (0.0%) | 45 (3.9%) |
| $10,000 to $12,499 | 16 (2.1%) | 14 (1.2%) |
| $12,500 to $14,999 | 0 (0.0%) | 23 (2.0%) |
| $15,000 to $17,499 | 0 (0.0%) | 11 (0.9%) |
| $17,500 to $19,999 | 0 (0.0%) | 61 (5.3%) |
| $20,000 to $22,499 | 0 (0.0%) | 52 (4.5%) |
| $22,500 to $24,999 | 30 (3.9%) | 56 (4.8%) |
| $25,000 to $29,999 | 150 (19.6%) | 264 (22.8%) |
| $30,000 to $34,999 | 68 (8.9%) | 96 (8.3%) |
| $35,000 to $39,999 | 111 (14.5%) | 39 (3.4%) |
| $40,000 to $44,999 | 82 (10.7%) | 76 (6.6%) |
| $45,000 to $49,999 | 6 (0.8%) | 109 (9.4%) |
| $50,000 to $54,999 | 42 (5.5%) | 106 (9.1%) |
| $55,000 to $64,999 | 109 (14.2%) | 101 (8.7%) |
| $65,000 to $74,999 | 0 (0.0%) | 47 (4.1%) |
| $75,000 to $99,999 | 40 (5.2%) | 27 (2.3%) |
| $100,000+ | 12 (1.6%) | 0 (0.0%) |
| Total | 767 (100.0%) | 1,159 (100.0%) |
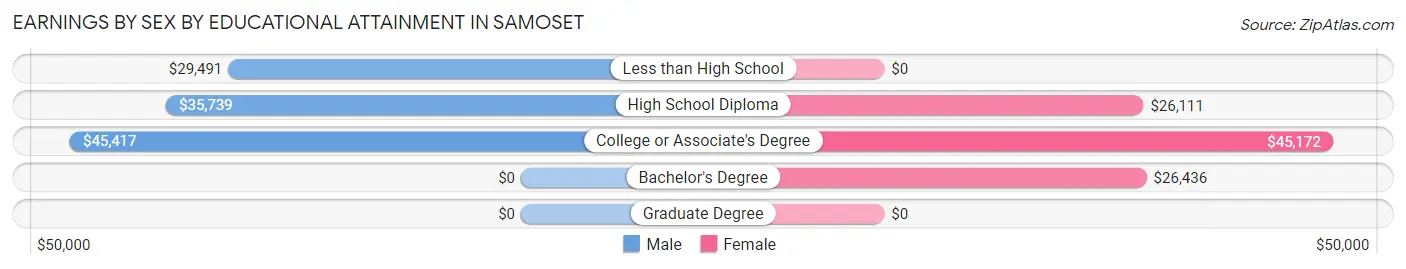
Earnings by Sex by Educational Attainment in Samoset
Average earnings in Samoset are $35,244 for men and $32,292 for women, a difference of 8.4%. Men with an educational attainment of college or associate's degree enjoy the highest average annual earnings of $45,417, while those with less than high school education earn the least with $29,491. Women with an educational attainment of college or associate's degree earn the most with the average annual earnings of $45,172, while those with high school diploma education have the smallest earnings of $26,111.
| Educational Attainment | Male Income | Female Income |
| Less than High School | $29,491 | $0 |
| High School Diploma | $35,739 | $26,111 |
| College or Associate's Degree | $45,417 | $45,172 |
| Bachelor's Degree | - | - |
| Graduate Degree | - | - |
| Total | $35,244 | $32,292 |
Family Income in Samoset
Family Income Brackets in Samoset
According to the Samoset family income data, there are 218 families falling into the $35,000 to $49,999 income range, which is the most common income bracket and makes up 22.3% of all families. Conversely, the $200,000+ income bracket is the least frequent group with only 11 families (1.1%) belonging to this category.
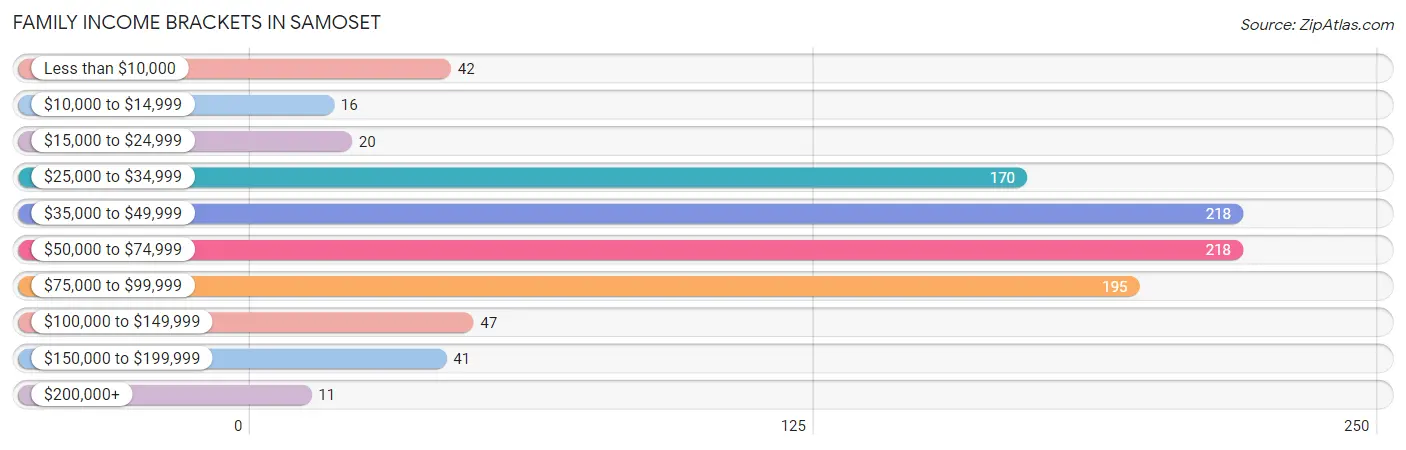
| Income Bracket | # Families | % Families |
| Less than $10,000 | 42 | 4.3% |
| $10,000 to $14,999 | 16 | 1.6% |
| $15,000 to $24,999 | 20 | 2.0% |
| $25,000 to $34,999 | 170 | 17.4% |
| $35,000 to $49,999 | 218 | 22.3% |
| $50,000 to $74,999 | 218 | 22.3% |
| $75,000 to $99,999 | 195 | 19.9% |
| $100,000 to $149,999 | 47 | 4.8% |
| $150,000 to $199,999 | 41 | 4.2% |
| $200,000+ | 11 | 1.1% |
Family Income by Famaliy Size in Samoset
3-person families (315 | 32.2%) account for the highest median family income in Samoset with $82,813 per family, while 3-person families (315 | 32.2%) have the highest median income of $27,604 per family member.
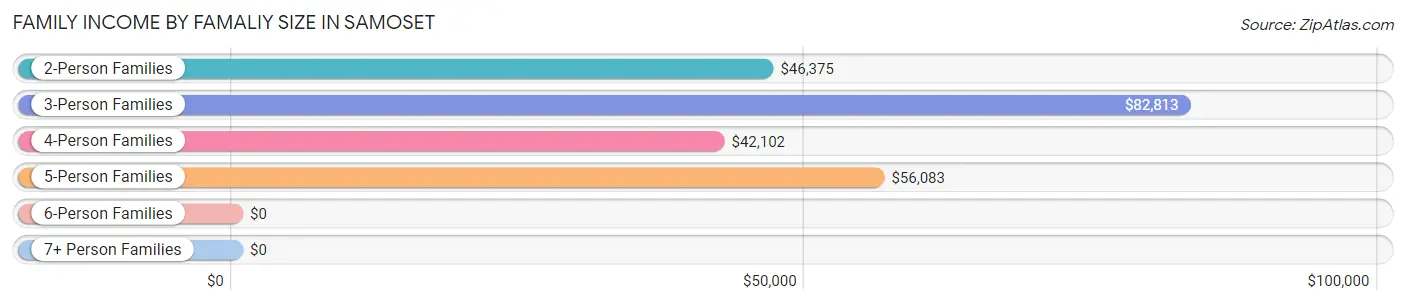
| Income Bracket | # Families | Median Income |
| 2-Person Families | 324 (33.1%) | $46,375 |
| 3-Person Families | 315 (32.2%) | $82,813 |
| 4-Person Families | 214 (21.9%) | $42,102 |
| 5-Person Families | 85 (8.7%) | $56,083 |
| 6-Person Families | 11 (1.1%) | $0 |
| 7+ Person Families | 29 (3.0%) | $0 |
| Total | 978 (100.0%) | $54,800 |
Family Income by Number of Earners in Samoset
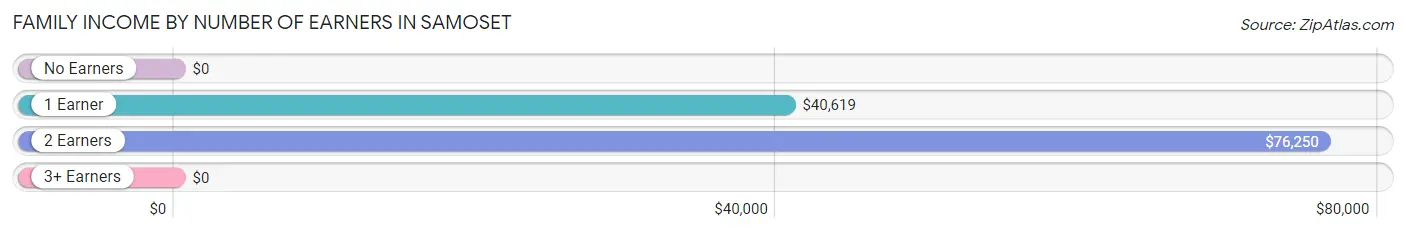
| Number of Earners | # Families | Median Income |
| No Earners | 150 (15.3%) | $0 |
| 1 Earner | 390 (39.9%) | $40,619 |
| 2 Earners | 306 (31.3%) | $76,250 |
| 3+ Earners | 132 (13.5%) | $0 |
| Total | 978 (100.0%) | $54,800 |
Household Income in Samoset
Household Income Brackets in Samoset
With 326 households falling in the category, the $35,000 to $49,999 income range is the most frequent in Samoset, accounting for 25.0% of all households. In contrast, only 10 households (0.8%) fall into the $200,000+ income bracket, making it the least populous group.
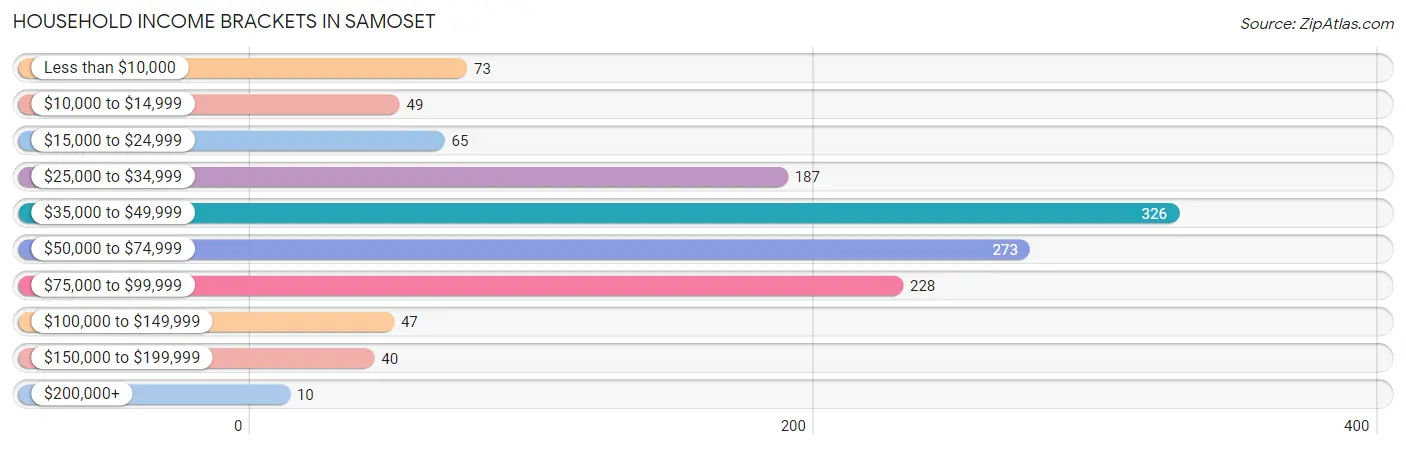
| Income Bracket | # Households | % Households |
| Less than $10,000 | 73 | 5.6% |
| $10,000 to $14,999 | 49 | 3.8% |
| $15,000 to $24,999 | 65 | 5.0% |
| $25,000 to $34,999 | 187 | 14.4% |
| $35,000 to $49,999 | 326 | 25.0% |
| $50,000 to $74,999 | 273 | 21.0% |
| $75,000 to $99,999 | 228 | 17.5% |
| $100,000 to $149,999 | 47 | 3.6% |
| $150,000 to $199,999 | 40 | 3.1% |
| $200,000+ | 10 | 0.8% |
Household Income by Householder Age in Samoset
The median household income in Samoset is $45,188, with the highest median household income of $76,250 found in the 45 to 64 years age bracket for the primary householder. A total of 557 households (42.8%) fall into this category.
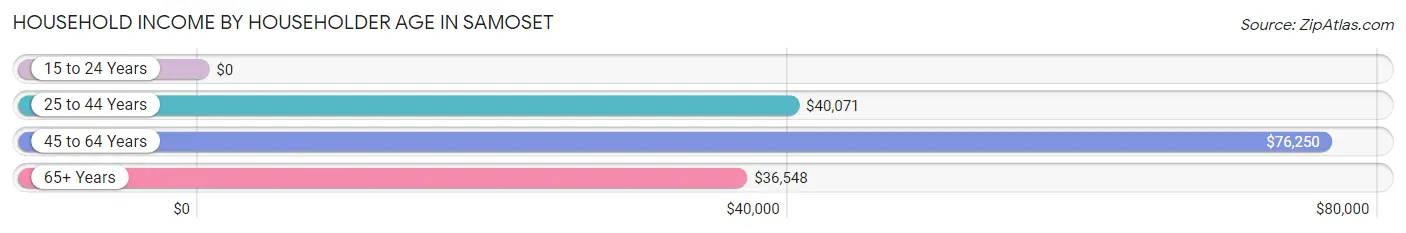
| Income Bracket | # Households | Median Income |
| 15 to 24 Years | 0 (0.0%) | $0 |
| 25 to 44 Years | 291 (22.4%) | $40,071 |
| 45 to 64 Years | 557 (42.8%) | $76,250 |
| 65+ Years | 454 (34.9%) | $36,548 |
| Total | 1,302 (100.0%) | $45,188 |
Poverty in Samoset
Income Below Poverty by Sex and Age in Samoset
With 9.9% poverty level for males and 15.2% for females among the residents of Samoset, 35 to 44 year old males and 15 year old females are the most vulnerable to poverty, with 115 males (31.3%) and 36 females (87.8%) in their respective age groups living below the poverty level.
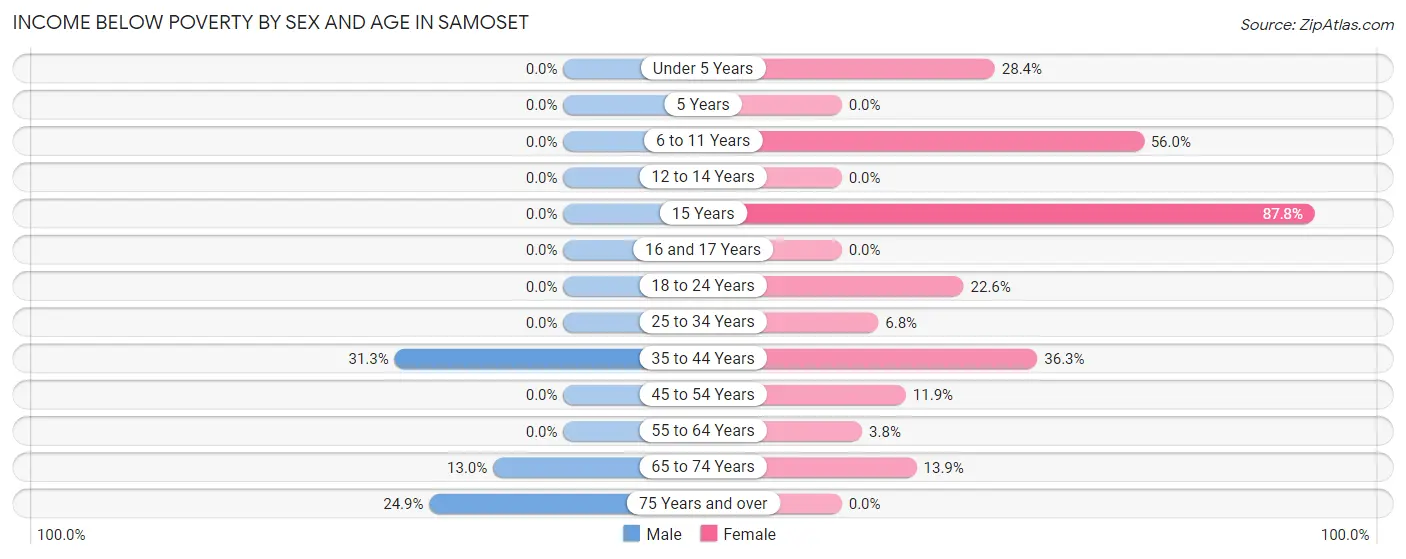
| Age Bracket | Male | Female |
| Under 5 Years | 0 (0.0%) | 25 (28.4%) |
| 5 Years | 0 (0.0%) | 0 (0.0%) |
| 6 to 11 Years | 0 (0.0%) | 51 (56.0%) |
| 12 to 14 Years | 0 (0.0%) | 0 (0.0%) |
| 15 Years | 0 (0.0%) | 36 (87.8%) |
| 16 and 17 Years | 0 (0.0%) | 0 (0.0%) |
| 18 to 24 Years | 0 (0.0%) | 26 (22.6%) |
| 25 to 34 Years | 0 (0.0%) | 31 (6.8%) |
| 35 to 44 Years | 115 (31.3%) | 98 (36.3%) |
| 45 to 54 Years | 0 (0.0%) | 40 (11.9%) |
| 55 to 64 Years | 0 (0.0%) | 15 (3.8%) |
| 65 to 74 Years | 15 (13.0%) | 30 (13.9%) |
| 75 Years and over | 59 (24.9%) | 0 (0.0%) |
| Total | 189 (9.9%) | 352 (15.2%) |
Income Above Poverty by Sex and Age in Samoset
According to the poverty statistics in Samoset, males aged under 5 years and females aged 5 years are the age groups that are most secure financially, with 100.0% of males and 100.0% of females in these age groups living above the poverty line.
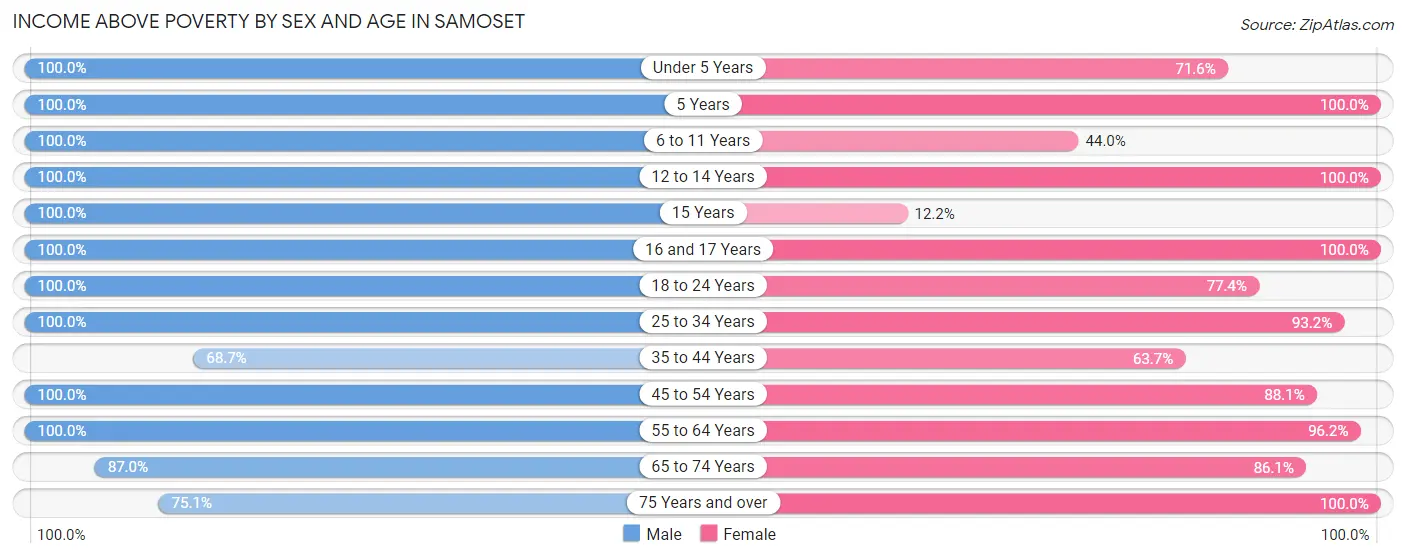
| Age Bracket | Male | Female |
| Under 5 Years | 84 (100.0%) | 63 (71.6%) |
| 5 Years | 49 (100.0%) | 23 (100.0%) |
| 6 to 11 Years | 240 (100.0%) | 40 (44.0%) |
| 12 to 14 Years | 11 (100.0%) | 52 (100.0%) |
| 15 Years | 29 (100.0%) | 5 (12.2%) |
| 16 and 17 Years | 80 (100.0%) | 31 (100.0%) |
| 18 to 24 Years | 154 (100.0%) | 89 (77.4%) |
| 25 to 34 Years | 147 (100.0%) | 426 (93.2%) |
| 35 to 44 Years | 252 (68.7%) | 172 (63.7%) |
| 45 to 54 Years | 192 (100.0%) | 296 (88.1%) |
| 55 to 64 Years | 212 (100.0%) | 382 (96.2%) |
| 65 to 74 Years | 100 (87.0%) | 186 (86.1%) |
| 75 Years and over | 178 (75.1%) | 201 (100.0%) |
| Total | 1,728 (90.1%) | 1,966 (84.8%) |
Income Below Poverty Among Married-Couple Families in Samoset
The poverty statistics for married-couple families in Samoset show that 5.8% or 33 of the total 565 families live below the poverty line. Families with 1 or 2 children have the highest poverty rate of 12.6%, comprising of 33 families. On the other hand, families with no children have the lowest poverty rate of 0.0%, which includes 0 families.
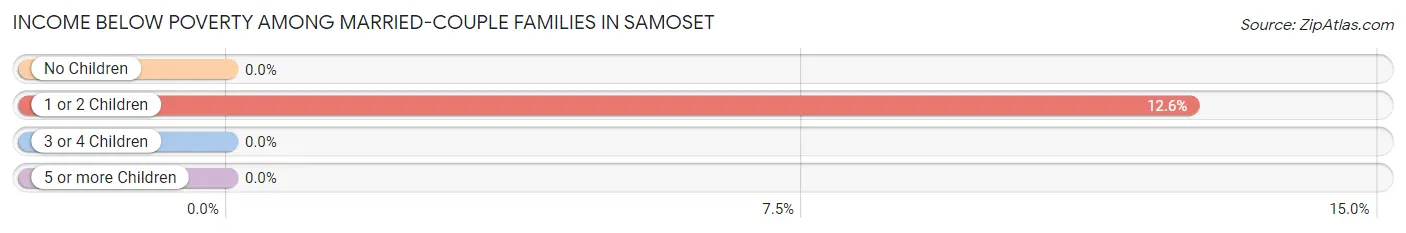
| Children | Above Poverty | Below Poverty |
| No Children | 273 (100.0%) | 0 (0.0%) |
| 1 or 2 Children | 230 (87.5%) | 33 (12.6%) |
| 3 or 4 Children | 29 (100.0%) | 0 (0.0%) |
| 5 or more Children | 0 (0.0%) | 0 (0.0%) |
| Total | 532 (94.2%) | 33 (5.8%) |
Income Below Poverty Among Single-Parent Households in Samoset
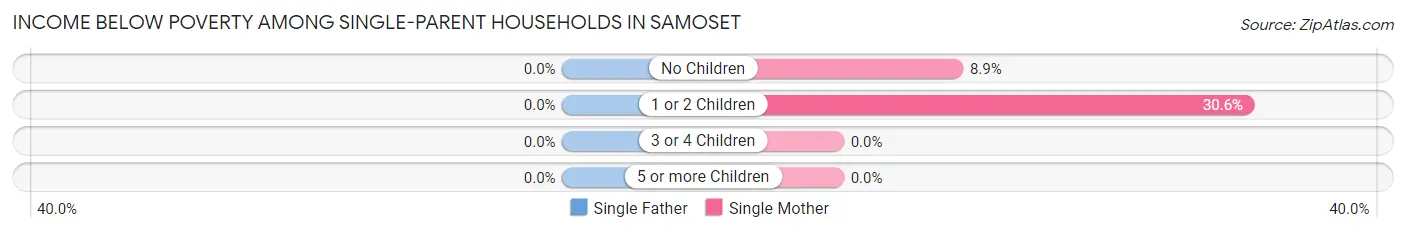
| Children | Single Father | Single Mother |
| No Children | 0 (0.0%) | 16 (8.9%) |
| 1 or 2 Children | 0 (0.0%) | 53 (30.6%) |
| 3 or 4 Children | 0 (0.0%) | 0 (0.0%) |
| 5 or more Children | 0 (0.0%) | 0 (0.0%) |
| Total | 0 (0.0%) | 69 (19.6%) |
Income Below Poverty Among Married-Couple vs Single-Parent Households in Samoset
The poverty data for Samoset shows that 33 of the married-couple family households (5.8%) and 69 of the single-parent households (16.7%) are living below the poverty level. Within the married-couple family households, those with 1 or 2 children have the highest poverty rate, with 33 households (12.6%) falling below the poverty line. Among the single-parent households, those with 1 or 2 children have the highest poverty rate, with 53 household (26.5%) living below poverty.
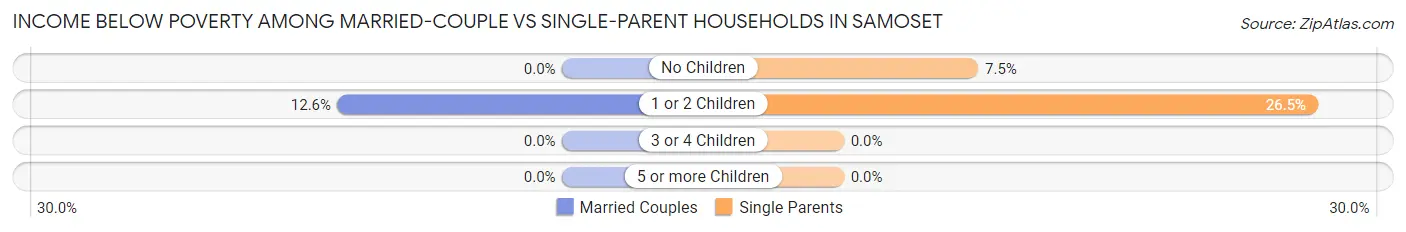
| Children | Married-Couple Families | Single-Parent Households |
| No Children | 0 (0.0%) | 16 (7.5%) |
| 1 or 2 Children | 33 (12.6%) | 53 (26.5%) |
| 3 or 4 Children | 0 (0.0%) | 0 (0.0%) |
| 5 or more Children | 0 (0.0%) | 0 (0.0%) |
| Total | 33 (5.8%) | 69 (16.7%) |
Race in Samoset
The most populous races in Samoset are White / Caucasian (2,265 | 53.5%), Hispanic or Latino (1,658 | 39.2%), and Black / African American (942 | 22.2%).
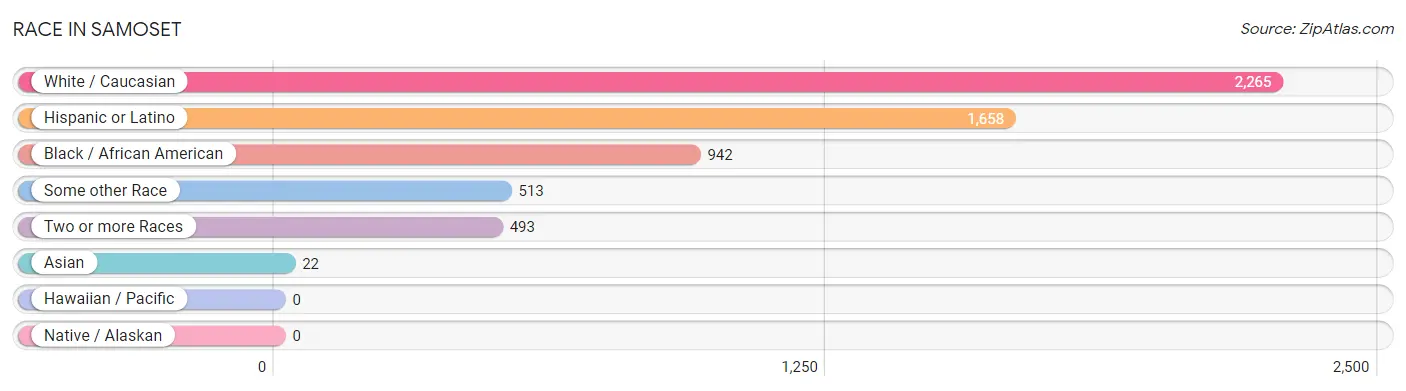
| Race | # Population | % Population |
| Asian | 22 | 0.5% |
| Black / African American | 942 | 22.2% |
| Hawaiian / Pacific | 0 | 0.0% |
| Hispanic or Latino | 1,658 | 39.2% |
| Native / Alaskan | 0 | 0.0% |
| White / Caucasian | 2,265 | 53.5% |
| Two or more Races | 493 | 11.6% |
| Some other Race | 513 | 12.1% |
| Total | 4,235 | 100.0% |
Ancestry in Samoset
The most populous ancestries reported in Samoset are Mexican (1,084 | 25.6%), German (684 | 16.2%), Central American (458 | 10.8%), Irish (415 | 9.8%), and American (308 | 7.3%), together accounting for 69.6% of all Samoset residents.
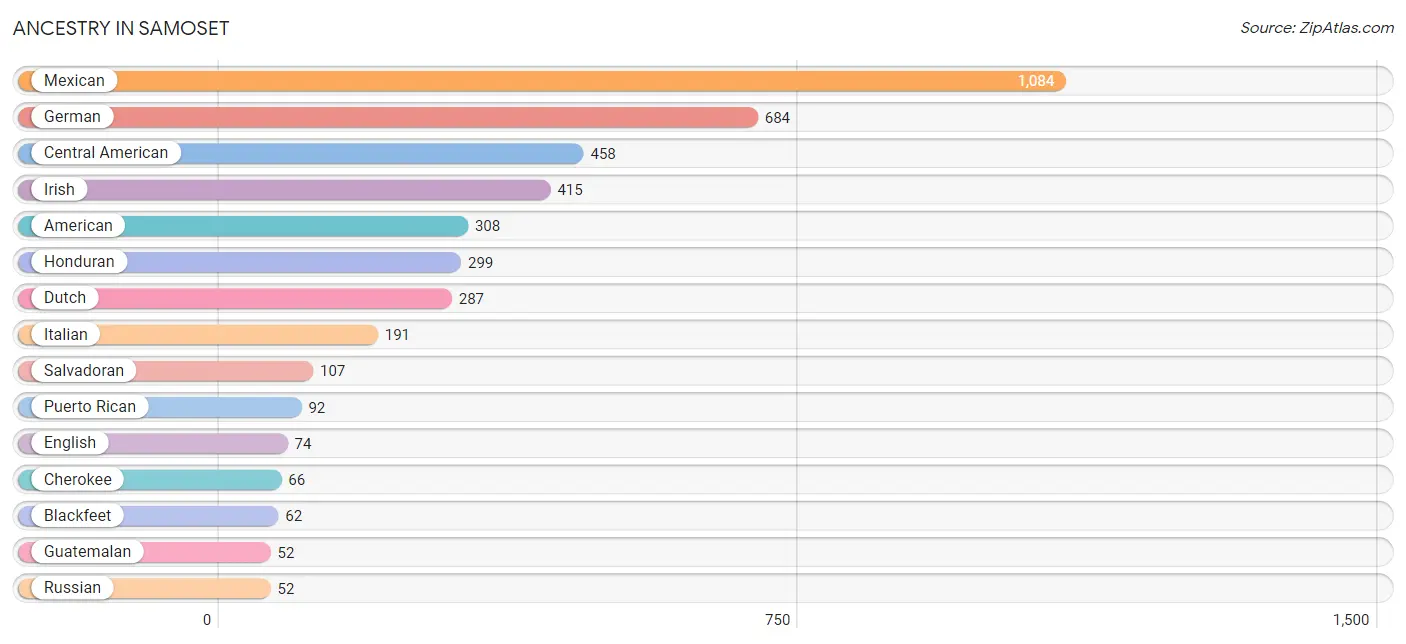
| Ancestry | # Population | % Population |
| African | 3 | 0.1% |
| American | 308 | 7.3% |
| Blackfeet | 62 | 1.5% |
| Canadian | 16 | 0.4% |
| Central American | 458 | 10.8% |
| Cherokee | 66 | 1.6% |
| Dutch | 287 | 6.8% |
| English | 74 | 1.8% |
| French | 47 | 1.1% |
| German | 684 | 16.2% |
| Guatemalan | 52 | 1.2% |
| Honduran | 299 | 7.1% |
| Irish | 415 | 9.8% |
| Italian | 191 | 4.5% |
| Mexican | 1,084 | 25.6% |
| Portuguese | 18 | 0.4% |
| Puerto Rican | 92 | 2.2% |
| Russian | 52 | 1.2% |
| Salvadoran | 107 | 2.5% |
| Scotch-Irish | 27 | 0.6% |
| Scottish | 39 | 0.9% |
| Subsaharan African | 3 | 0.1% |
| Swedish | 23 | 0.5% |
| West Indian | 21 | 0.5% | View All 24 Rows |
Immigrants in Samoset
The most numerous immigrant groups reported in Samoset came from Latin America (900 | 21.2%), Central America (860 | 20.3%), Mexico (591 | 14.0%), Honduras (145 | 3.4%), and El Salvador (107 | 2.5%), together accounting for 61.5% of all Samoset residents.
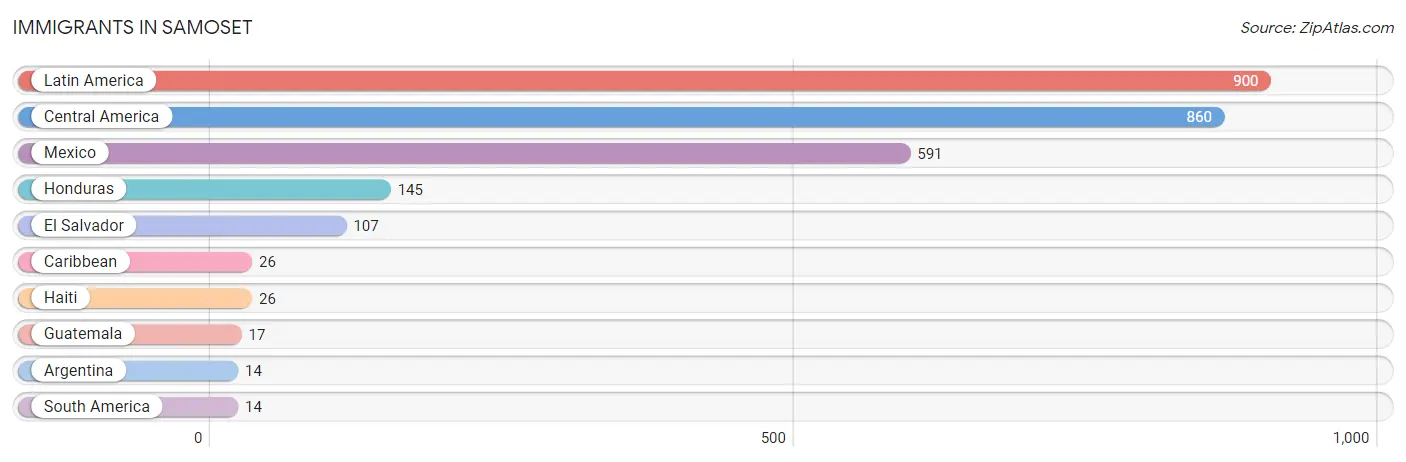
| Immigration Origin | # Population | % Population |
| Argentina | 14 | 0.3% |
| Caribbean | 26 | 0.6% |
| Central America | 860 | 20.3% |
| El Salvador | 107 | 2.5% |
| Guatemala | 17 | 0.4% |
| Haiti | 26 | 0.6% |
| Honduras | 145 | 3.4% |
| Latin America | 900 | 21.2% |
| Mexico | 591 | 14.0% |
| South America | 14 | 0.3% | View All 10 Rows |
Sex and Age in Samoset
Sex and Age in Samoset
The most populous age groups in Samoset are 40 to 44 Years (262 | 13.7%) for men and 25 to 29 Years (278 | 12.0%) for women.
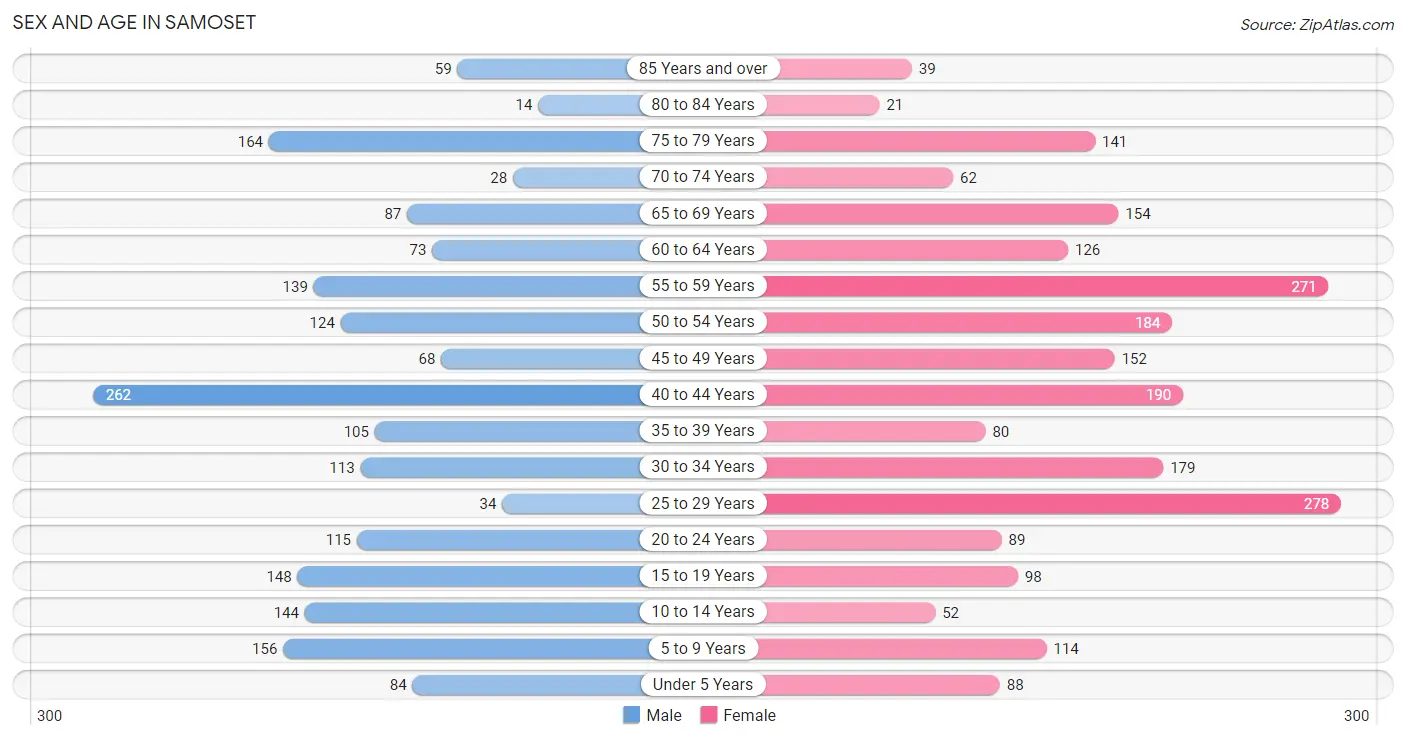
| Age Bracket | Male | Female |
| Under 5 Years | 84 (4.4%) | 88 (3.8%) |
| 5 to 9 Years | 156 (8.1%) | 114 (4.9%) |
| 10 to 14 Years | 144 (7.5%) | 52 (2.2%) |
| 15 to 19 Years | 148 (7.7%) | 98 (4.2%) |
| 20 to 24 Years | 115 (6.0%) | 89 (3.8%) |
| 25 to 29 Years | 34 (1.8%) | 278 (12.0%) |
| 30 to 34 Years | 113 (5.9%) | 179 (7.7%) |
| 35 to 39 Years | 105 (5.5%) | 80 (3.5%) |
| 40 to 44 Years | 262 (13.7%) | 190 (8.2%) |
| 45 to 49 Years | 68 (3.5%) | 152 (6.6%) |
| 50 to 54 Years | 124 (6.5%) | 184 (7.9%) |
| 55 to 59 Years | 139 (7.2%) | 271 (11.7%) |
| 60 to 64 Years | 73 (3.8%) | 126 (5.4%) |
| 65 to 69 Years | 87 (4.5%) | 154 (6.6%) |
| 70 to 74 Years | 28 (1.5%) | 62 (2.7%) |
| 75 to 79 Years | 164 (8.6%) | 141 (6.1%) |
| 80 to 84 Years | 14 (0.7%) | 21 (0.9%) |
| 85 Years and over | 59 (3.1%) | 39 (1.7%) |
| Total | 1,917 (100.0%) | 2,318 (100.0%) |
Families and Households in Samoset
Median Family Size in Samoset
The median family size in Samoset is 3.88 persons per family, with single female/mother families (353 | 36.1%) accounting for the largest median family size of 4.01 persons per family. On the other hand, single male/father families (60 | 6.1%) represent the smallest median family size with 3.18 persons per family.
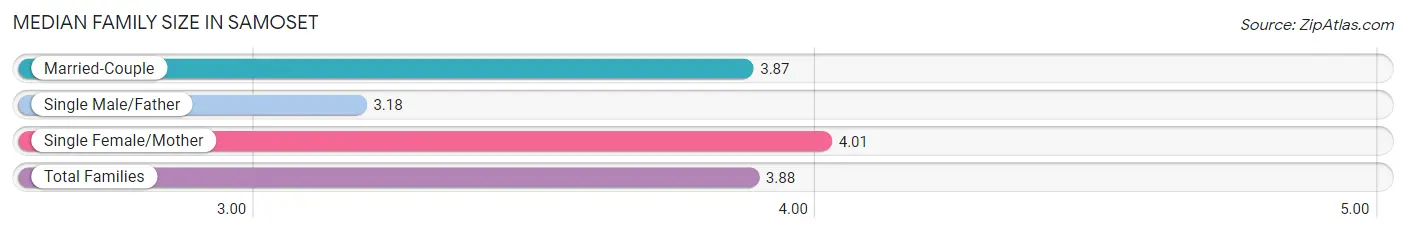
| Family Type | # Families | Family Size |
| Married-Couple | 565 (57.8%) | 3.87 |
| Single Male/Father | 60 (6.1%) | 3.18 |
| Single Female/Mother | 353 (36.1%) | 4.01 |
| Total Families | 978 (100.0%) | 3.88 |
Median Household Size in Samoset
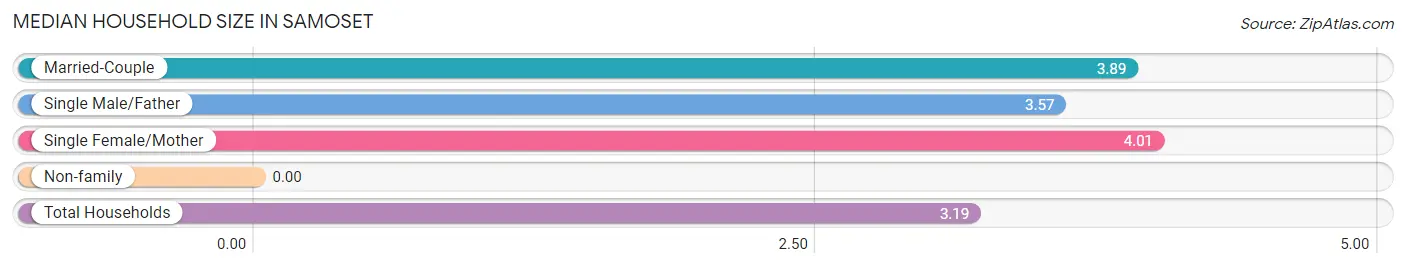
| Household Type | # Households | Household Size |
| Married-Couple | 565 (43.4%) | 3.89 |
| Single Male/Father | 60 (4.6%) | 3.57 |
| Single Female/Mother | 353 (27.1%) | 4.01 |
| Non-family | 324 (24.9%) | - |
| Total Households | 1,302 (100.0%) | 3.19 |
Household Size by Marriage Status in Samoset
Out of a total of 1,302 households in Samoset, 978 (75.1%) are family households, while 324 (24.9%) are nonfamily households. The most numerous type of family households are 2-person households, comprising 318, and the most common type of nonfamily households are 1-person households, comprising 324.
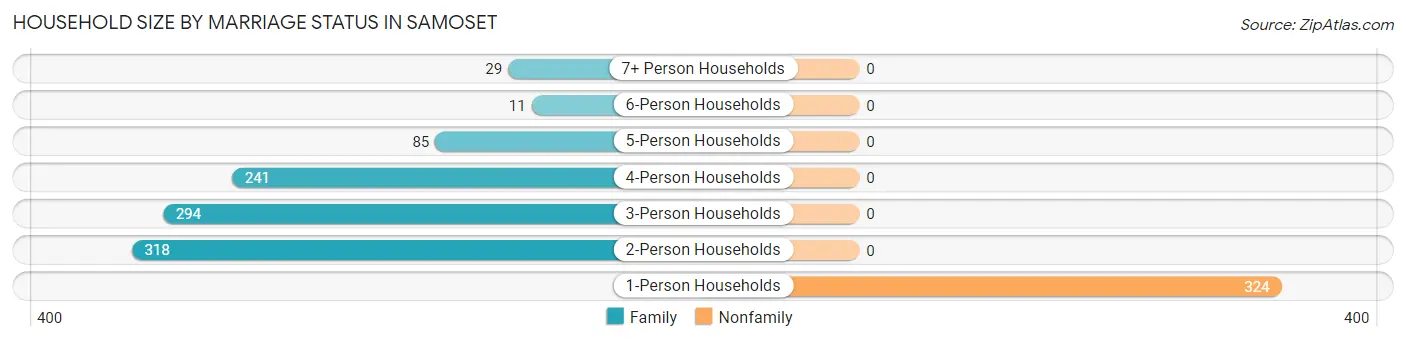
| Household Size | Family Households | Nonfamily Households |
| 1-Person Households | - | 324 (24.9%) |
| 2-Person Households | 318 (24.4%) | 0 (0.0%) |
| 3-Person Households | 294 (22.6%) | 0 (0.0%) |
| 4-Person Households | 241 (18.5%) | 0 (0.0%) |
| 5-Person Households | 85 (6.5%) | 0 (0.0%) |
| 6-Person Households | 11 (0.8%) | 0 (0.0%) |
| 7+ Person Households | 29 (2.2%) | 0 (0.0%) |
| Total | 978 (75.1%) | 324 (24.9%) |
Female Fertility in Samoset
Fertility by Age in Samoset
Average fertility rate in Samoset is 29.0 births per 1,000 women. Women in the age bracket of 20 to 34 years have the highest fertility rate with 57.0 births per 1,000 women. Women in the age bracket of 20 to 34 years acount for 100.0% of all women with births.
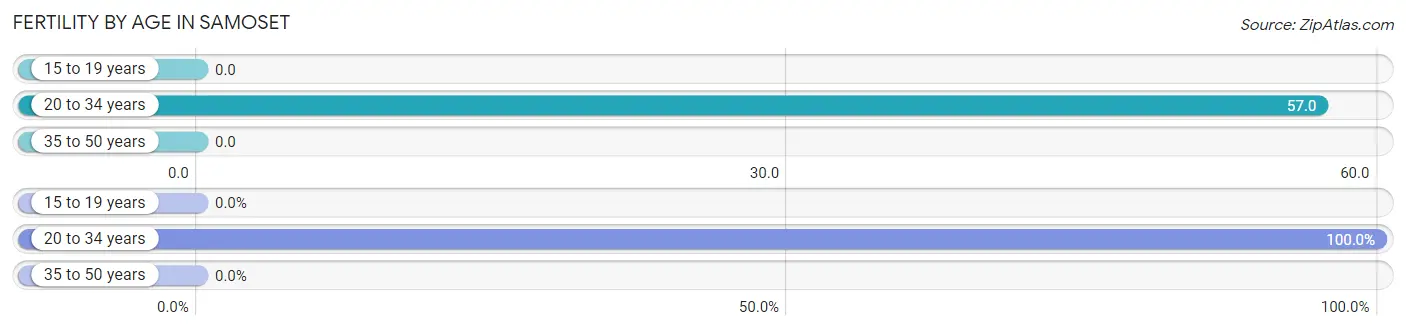
| Age Bracket | Women with Births | Births / 1,000 Women |
| 15 to 19 years | 0 (0.0%) | 0.0 |
| 20 to 34 years | 31 (100.0%) | 57.0 |
| 35 to 50 years | 0 (0.0%) | 0.0 |
| Total | 31 (100.0%) | 29.0 |
Fertility by Age by Marriage Status in Samoset
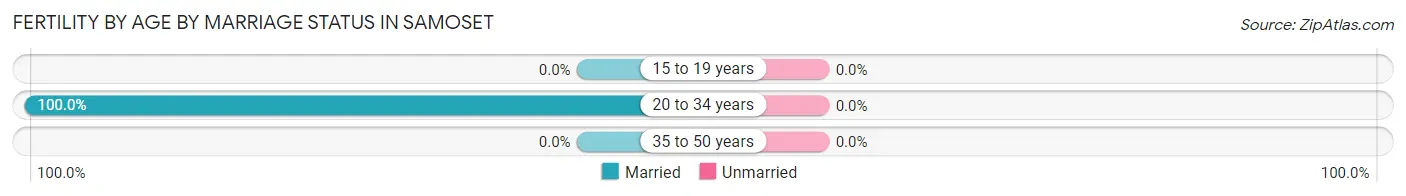
| Age Bracket | Married | Unmarried |
| 15 to 19 years | 0 (0.0%) | 0 (0.0%) |
| 20 to 34 years | 31 (100.0%) | 0 (0.0%) |
| 35 to 50 years | 0 (0.0%) | 0 (0.0%) |
| Total | 31 (100.0%) | 0 (0.0%) |
Fertility by Education in Samoset
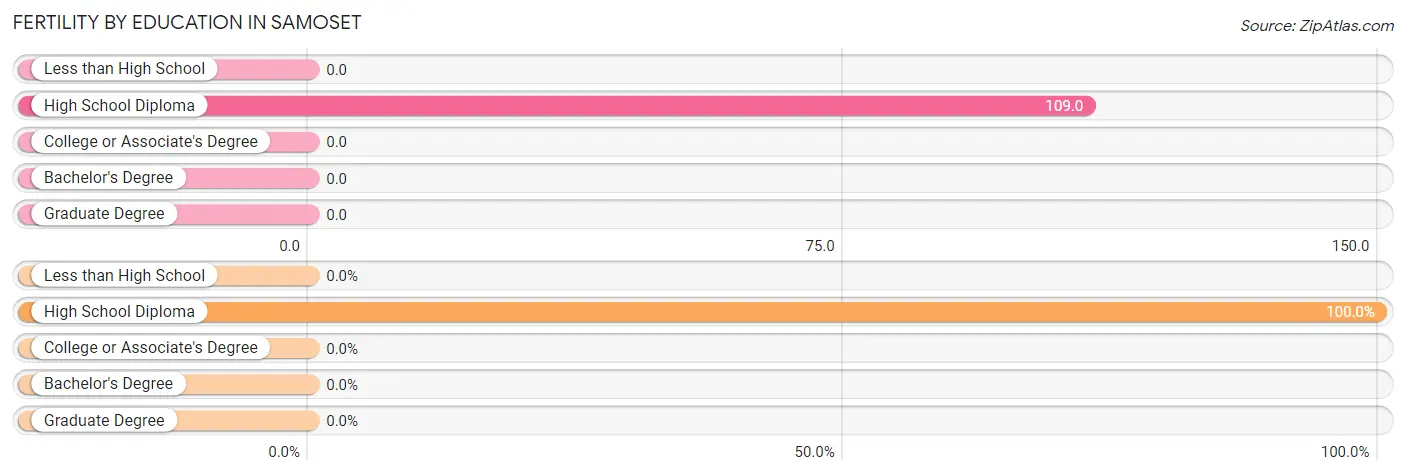
| Educational Attainment | Women with Births | Births / 1,000 Women |
| Less than High School | 0 (0.0%) | 0.0 |
| High School Diploma | 31 (100.0%) | 109.0 |
| College or Associate's Degree | 0 (0.0%) | 0.0 |
| Bachelor's Degree | 0 (0.0%) | 0.0 |
| Graduate Degree | 0 (0.0%) | 0.0 |
| Total | 31 (100.0%) | 29.0 |
Fertility by Education by Marriage Status in Samoset
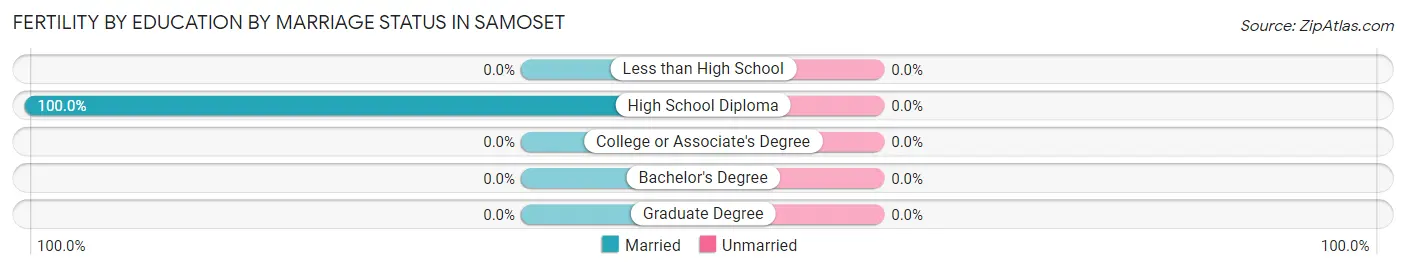
| Educational Attainment | Married | Unmarried |
| Less than High School | 0 (0.0%) | 0 (0.0%) |
| High School Diploma | 31 (100.0%) | 0 (0.0%) |
| College or Associate's Degree | 0 (0.0%) | 0 (0.0%) |
| Bachelor's Degree | 0 (0.0%) | 0 (0.0%) |
| Graduate Degree | 0 (0.0%) | 0 (0.0%) |
| Total | 31 (100.0%) | 0 (0.0%) |
Employment Characteristics in Samoset
Employment by Class of Employer in Samoset
Among the 1,756 employed individuals in Samoset, private company employees (1,503 | 85.6%), local government employees (120 | 6.8%), and state government employees (54 | 3.1%) make up the most common classes of employment.
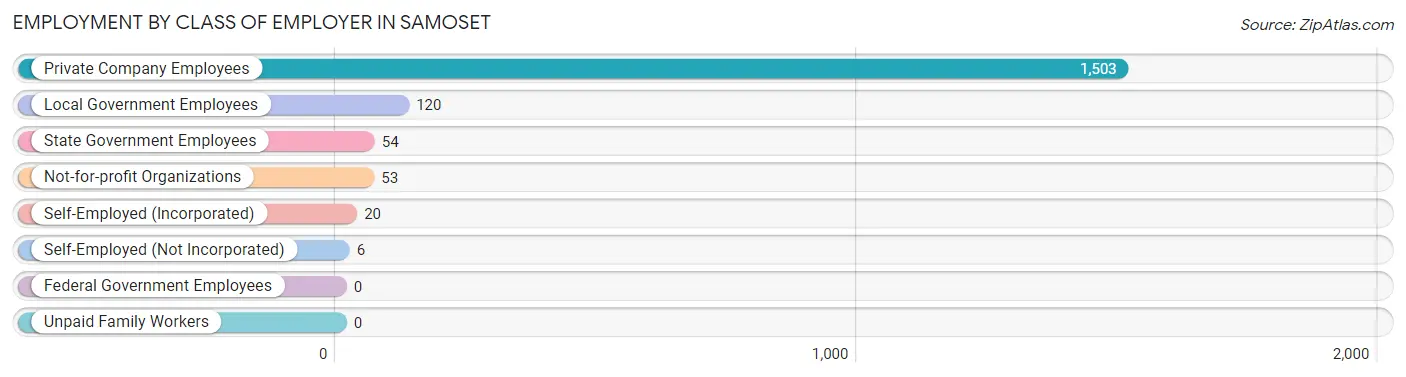
| Employer Class | # Employees | % Employees |
| Private Company Employees | 1,503 | 85.6% |
| Self-Employed (Incorporated) | 20 | 1.1% |
| Self-Employed (Not Incorporated) | 6 | 0.3% |
| Not-for-profit Organizations | 53 | 3.0% |
| Local Government Employees | 120 | 6.8% |
| State Government Employees | 54 | 3.1% |
| Federal Government Employees | 0 | 0.0% |
| Unpaid Family Workers | 0 | 0.0% |
| Total | 1,756 | 100.0% |
Employment Status by Age in Samoset
According to the labor force statistics for Samoset, out of the total population over 16 years of age (3,527), 57.2% or 2,017 individuals are in the labor force, with 6.7% or 135 of them unemployed. The age group with the highest labor force participation rate is 45 to 54 years, with 85.2% or 450 individuals in the labor force. Within the labor force, the 35 to 44 years age range has the highest percentage of unemployed individuals, with 23.9% or 92 of them being unemployed.
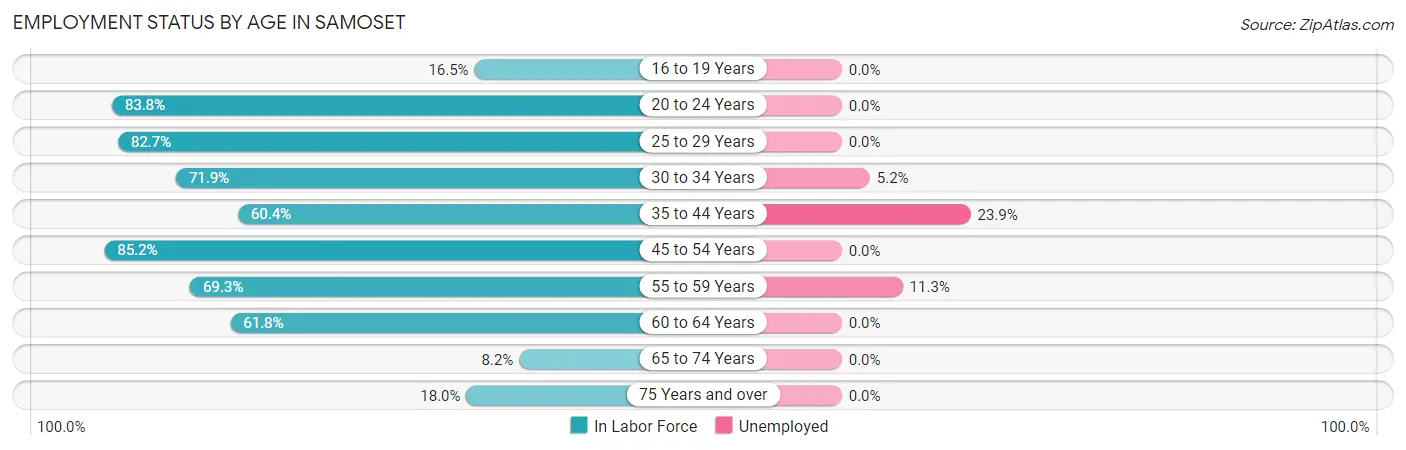
| Age Bracket | In Labor Force | Unemployed |
| 16 to 19 Years | 29 (16.5%) | 0 (0.0%) |
| 20 to 24 Years | 171 (83.8%) | 0 (0.0%) |
| 25 to 29 Years | 258 (82.7%) | 0 (0.0%) |
| 30 to 34 Years | 210 (71.9%) | 11 (5.2%) |
| 35 to 44 Years | 385 (60.4%) | 92 (23.9%) |
| 45 to 54 Years | 450 (85.2%) | 0 (0.0%) |
| 55 to 59 Years | 284 (69.3%) | 32 (11.3%) |
| 60 to 64 Years | 123 (61.8%) | 0 (0.0%) |
| 65 to 74 Years | 27 (8.2%) | 0 (0.0%) |
| 75 Years and over | 79 (18.0%) | 0 (0.0%) |
| Total | 2,017 (57.2%) | 135 (6.7%) |
Employment Status by Educational Attainment in Samoset
According to labor force statistics for Samoset, 71.9% of individuals (1,710) out of the total population between 25 and 64 years of age (2,378) are in the labor force, with 7.9% or 135 of them being unemployed. The group with the highest labor force participation rate are those with the educational attainment of high school diploma, with 89.1% or 596 individuals in the labor force. Within the labor force, individuals with high school diploma education have the highest percentage of unemployment, with 16.6% or 99 of them being unemployed.
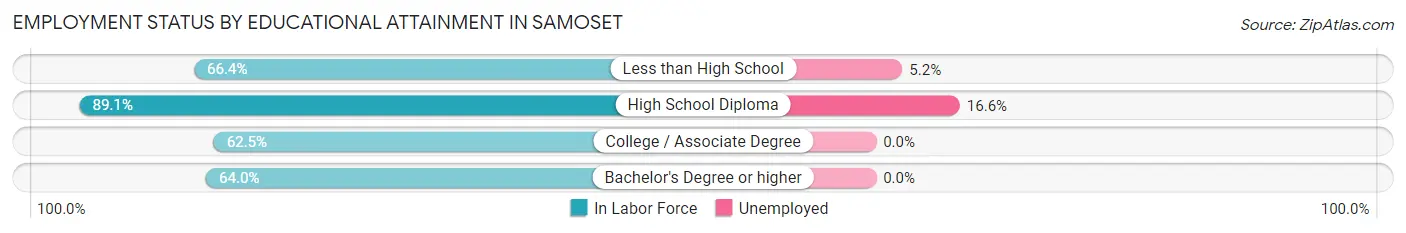
| Educational Attainment | In Labor Force | Unemployed |
| Less than High School | 697 (66.4%) | 55 (5.2%) |
| High School Diploma | 596 (89.1%) | 111 (16.6%) |
| College / Associate Degree | 232 (62.5%) | 0 (0.0%) |
| Bachelor's Degree or higher | 185 (64.0%) | 0 (0.0%) |
| Total | 1,710 (71.9%) | 188 (7.9%) |
Employment Occupations by Sex in Samoset
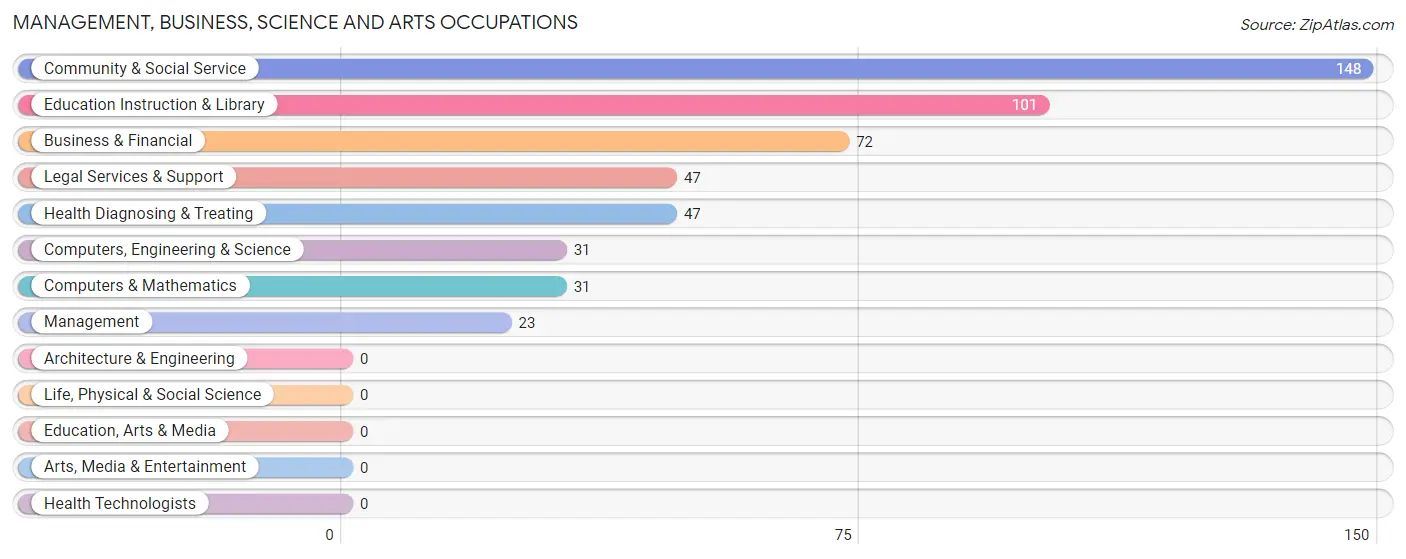
Management, Business, Science and Arts Occupations
The most common Management, Business, Science and Arts occupations in Samoset are Community & Social Service (148 | 7.9%), Education Instruction & Library (101 | 5.4%), Business & Financial (72 | 3.8%), Legal Services & Support (47 | 2.5%), and Health Diagnosing & Treating (47 | 2.5%).
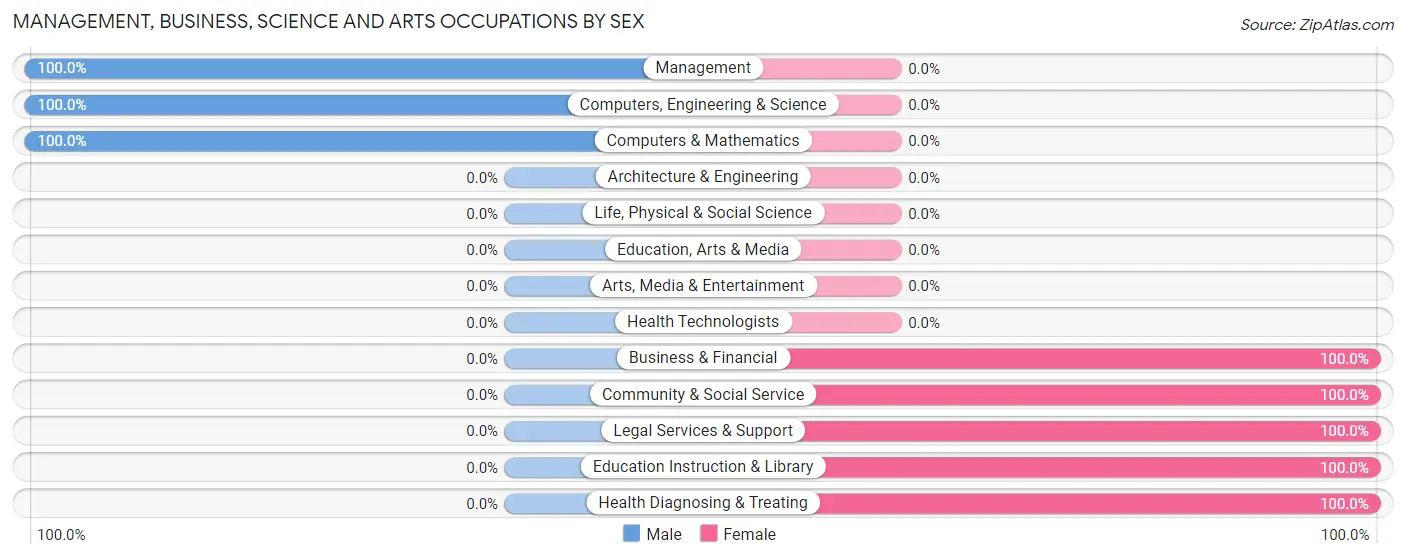
Management, Business, Science and Arts Occupations by Sex
Within the Management, Business, Science and Arts occupations in Samoset, the most male-oriented occupations are Management (100.0%), Computers, Engineering & Science (100.0%), and Computers & Mathematics (100.0%), while the most female-oriented occupations are Business & Financial (100.0%), Community & Social Service (100.0%), and Legal Services & Support (100.0%).
| Occupation | Male | Female |
| Management | 23 (100.0%) | 0 (0.0%) |
| Business & Financial | 0 (0.0%) | 72 (100.0%) |
| Computers, Engineering & Science | 31 (100.0%) | 0 (0.0%) |
| Computers & Mathematics | 31 (100.0%) | 0 (0.0%) |
| Architecture & Engineering | 0 (0.0%) | 0 (0.0%) |
| Life, Physical & Social Science | 0 (0.0%) | 0 (0.0%) |
| Community & Social Service | 0 (0.0%) | 148 (100.0%) |
| Education, Arts & Media | 0 (0.0%) | 0 (0.0%) |
| Legal Services & Support | 0 (0.0%) | 47 (100.0%) |
| Education Instruction & Library | 0 (0.0%) | 101 (100.0%) |
| Arts, Media & Entertainment | 0 (0.0%) | 0 (0.0%) |
| Health Diagnosing & Treating | 0 (0.0%) | 47 (100.0%) |
| Health Technologists | 0 (0.0%) | 0 (0.0%) |
| Total (Category) | 54 (16.8%) | 267 (83.2%) |
| Total (Overall) | 763 (40.6%) | 1,118 (59.4%) |
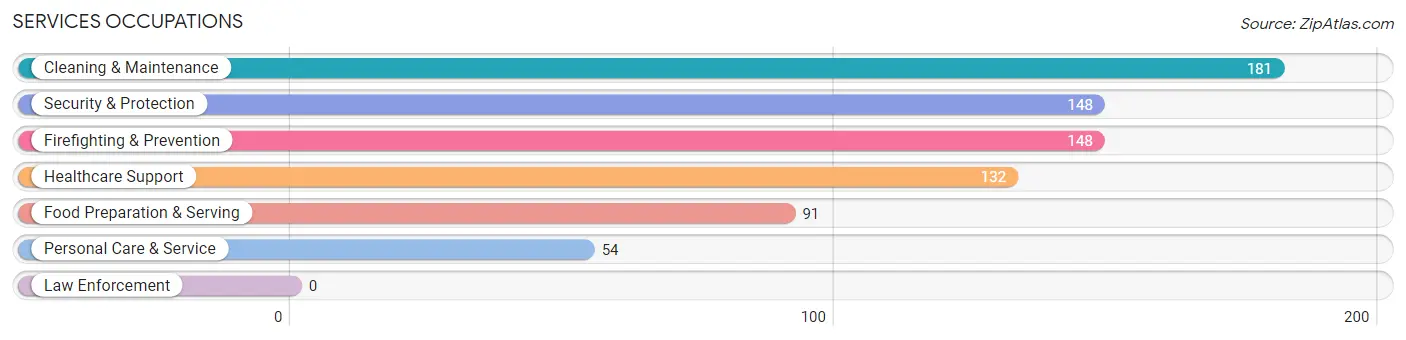
Services Occupations
The most common Services occupations in Samoset are Cleaning & Maintenance (181 | 9.6%), Security & Protection (148 | 7.9%), Firefighting & Prevention (148 | 7.9%), Healthcare Support (132 | 7.0%), and Food Preparation & Serving (91 | 4.8%).
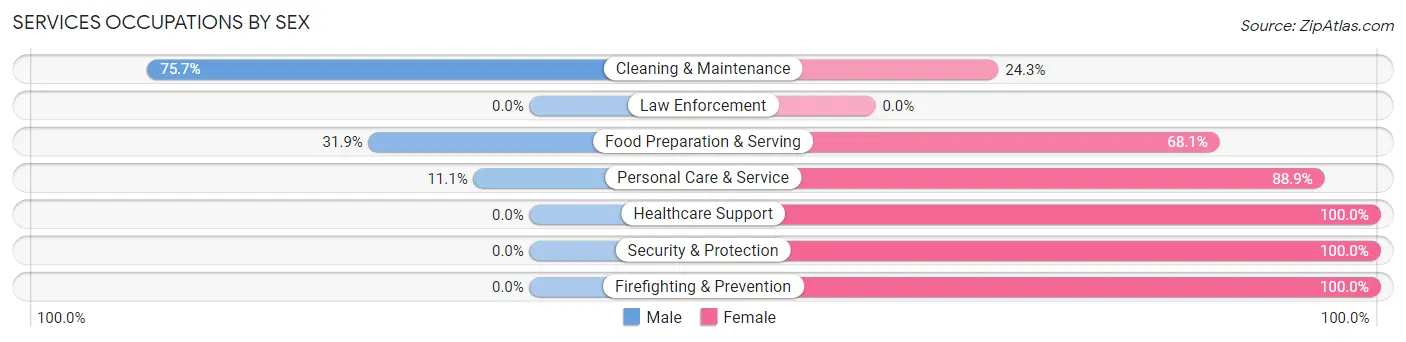
Services Occupations by Sex
Within the Services occupations in Samoset, the most male-oriented occupations are Cleaning & Maintenance (75.7%), Food Preparation & Serving (31.9%), and Personal Care & Service (11.1%), while the most female-oriented occupations are Healthcare Support (100.0%), Security & Protection (100.0%), and Firefighting & Prevention (100.0%).
| Occupation | Male | Female |
| Healthcare Support | 0 (0.0%) | 132 (100.0%) |
| Security & Protection | 0 (0.0%) | 148 (100.0%) |
| Firefighting & Prevention | 0 (0.0%) | 148 (100.0%) |
| Law Enforcement | 0 (0.0%) | 0 (0.0%) |
| Food Preparation & Serving | 29 (31.9%) | 62 (68.1%) |
| Cleaning & Maintenance | 137 (75.7%) | 44 (24.3%) |
| Personal Care & Service | 6 (11.1%) | 48 (88.9%) |
| Total (Category) | 172 (28.4%) | 434 (71.6%) |
| Total (Overall) | 763 (40.6%) | 1,118 (59.4%) |
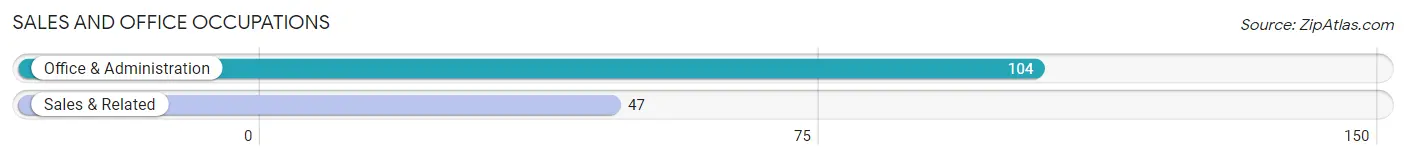
Sales and Office Occupations
The most common Sales and Office occupations in Samoset are Office & Administration (104 | 5.5%), and Sales & Related (47 | 2.5%).
Sales and Office Occupations by Sex
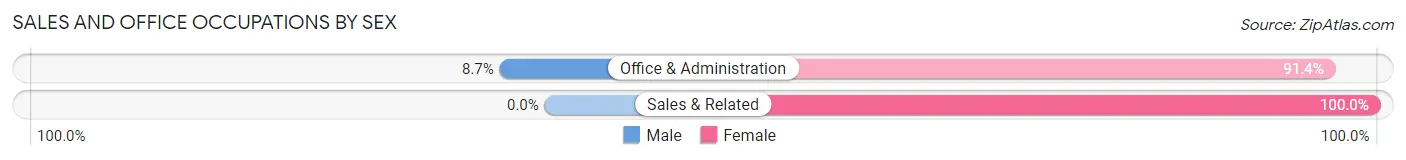
| Occupation | Male | Female |
| Sales & Related | 0 (0.0%) | 47 (100.0%) |
| Office & Administration | 9 (8.6%) | 95 (91.3%) |
| Total (Category) | 9 (6.0%) | 142 (94.0%) |
| Total (Overall) | 763 (40.6%) | 1,118 (59.4%) |
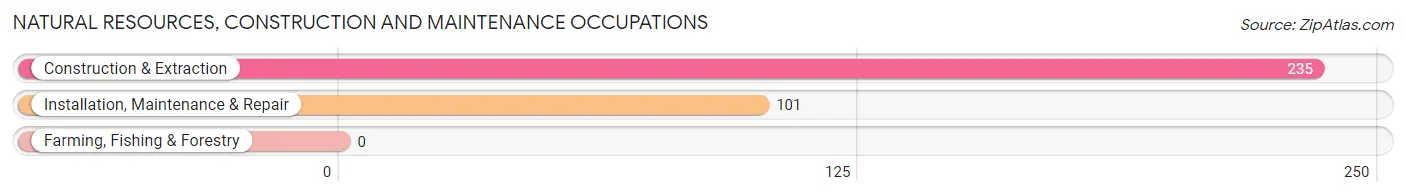
Natural Resources, Construction and Maintenance Occupations
The most common Natural Resources, Construction and Maintenance occupations in Samoset are Construction & Extraction (235 | 12.5%), and Installation, Maintenance & Repair (101 | 5.4%).
Natural Resources, Construction and Maintenance Occupations by Sex
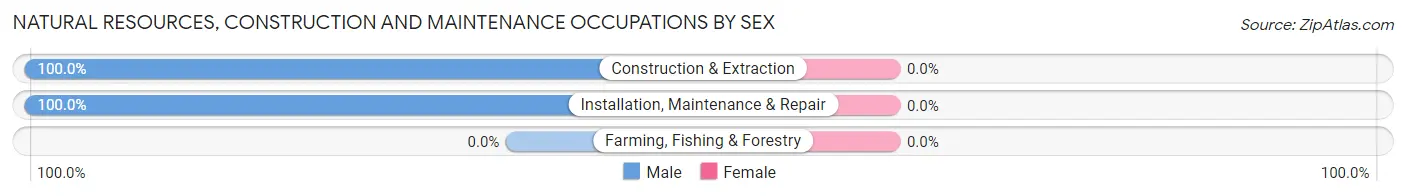
| Occupation | Male | Female |
| Farming, Fishing & Forestry | 0 (0.0%) | 0 (0.0%) |
| Construction & Extraction | 235 (100.0%) | 0 (0.0%) |
| Installation, Maintenance & Repair | 101 (100.0%) | 0 (0.0%) |
| Total (Category) | 336 (100.0%) | 0 (0.0%) |
| Total (Overall) | 763 (40.6%) | 1,118 (59.4%) |
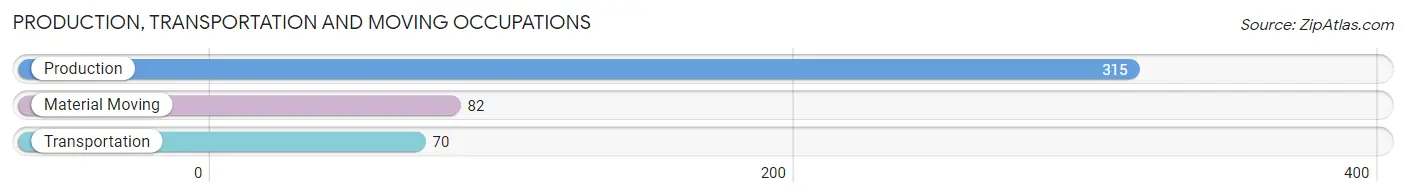
Production, Transportation and Moving Occupations
The most common Production, Transportation and Moving occupations in Samoset are Production (315 | 16.8%), Material Moving (82 | 4.4%), and Transportation (70 | 3.7%).
Production, Transportation and Moving Occupations by Sex
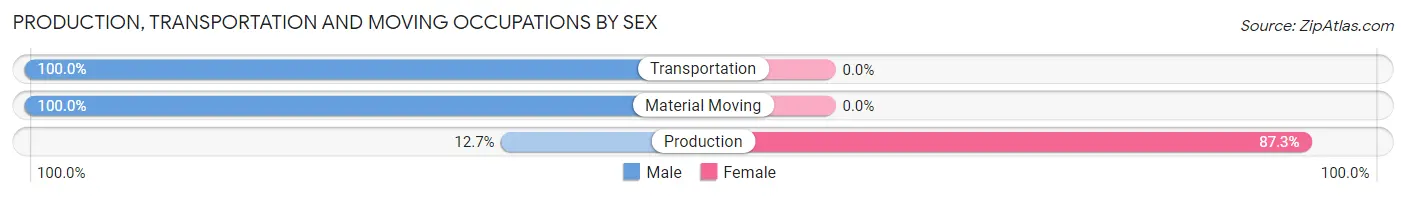
| Occupation | Male | Female |
| Production | 40 (12.7%) | 275 (87.3%) |
| Transportation | 70 (100.0%) | 0 (0.0%) |
| Material Moving | 82 (100.0%) | 0 (0.0%) |
| Total (Category) | 192 (41.1%) | 275 (58.9%) |
| Total (Overall) | 763 (40.6%) | 1,118 (59.4%) |
Employment Industries by Sex in Samoset
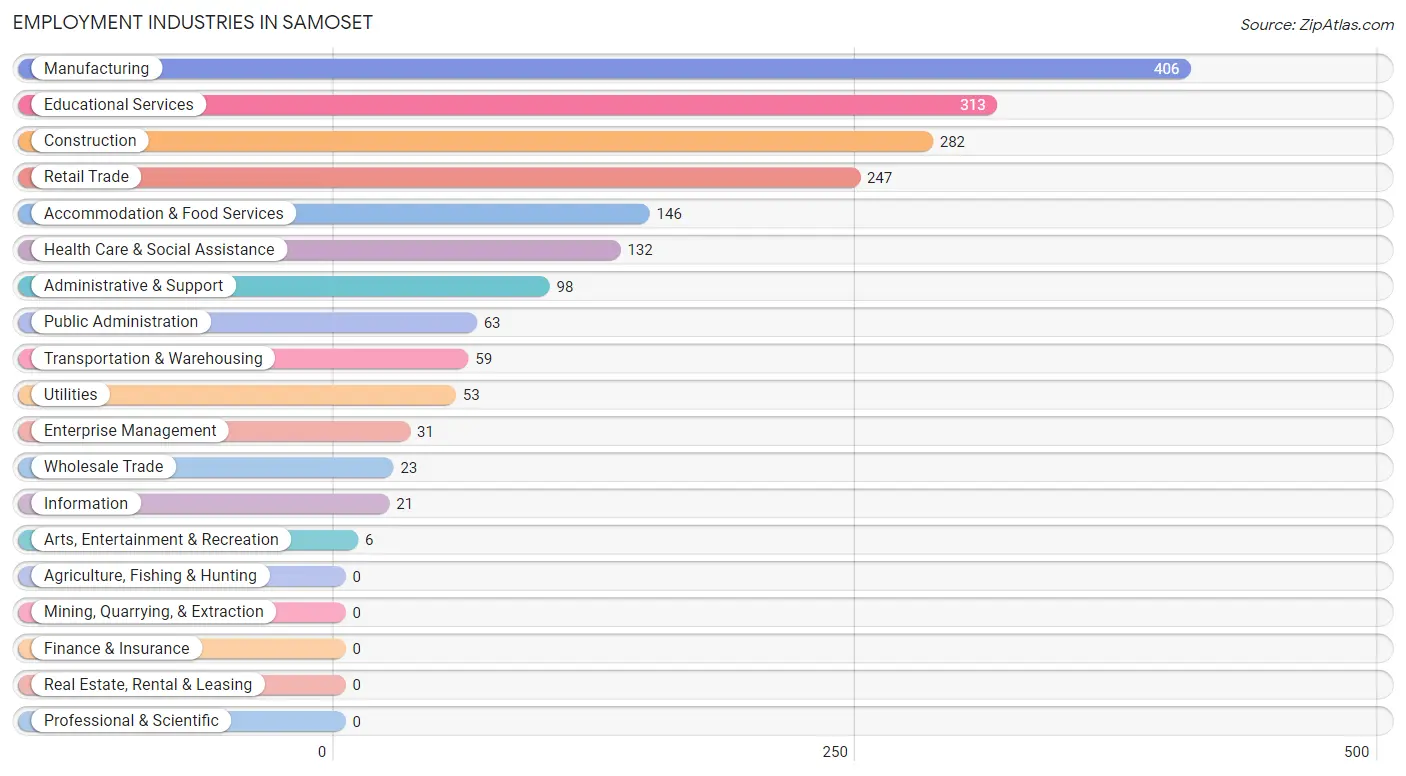
Employment Industries in Samoset
The major employment industries in Samoset include Manufacturing (406 | 21.6%), Educational Services (313 | 16.6%), Construction (282 | 15.0%), Retail Trade (247 | 13.1%), and Accommodation & Food Services (146 | 7.8%).
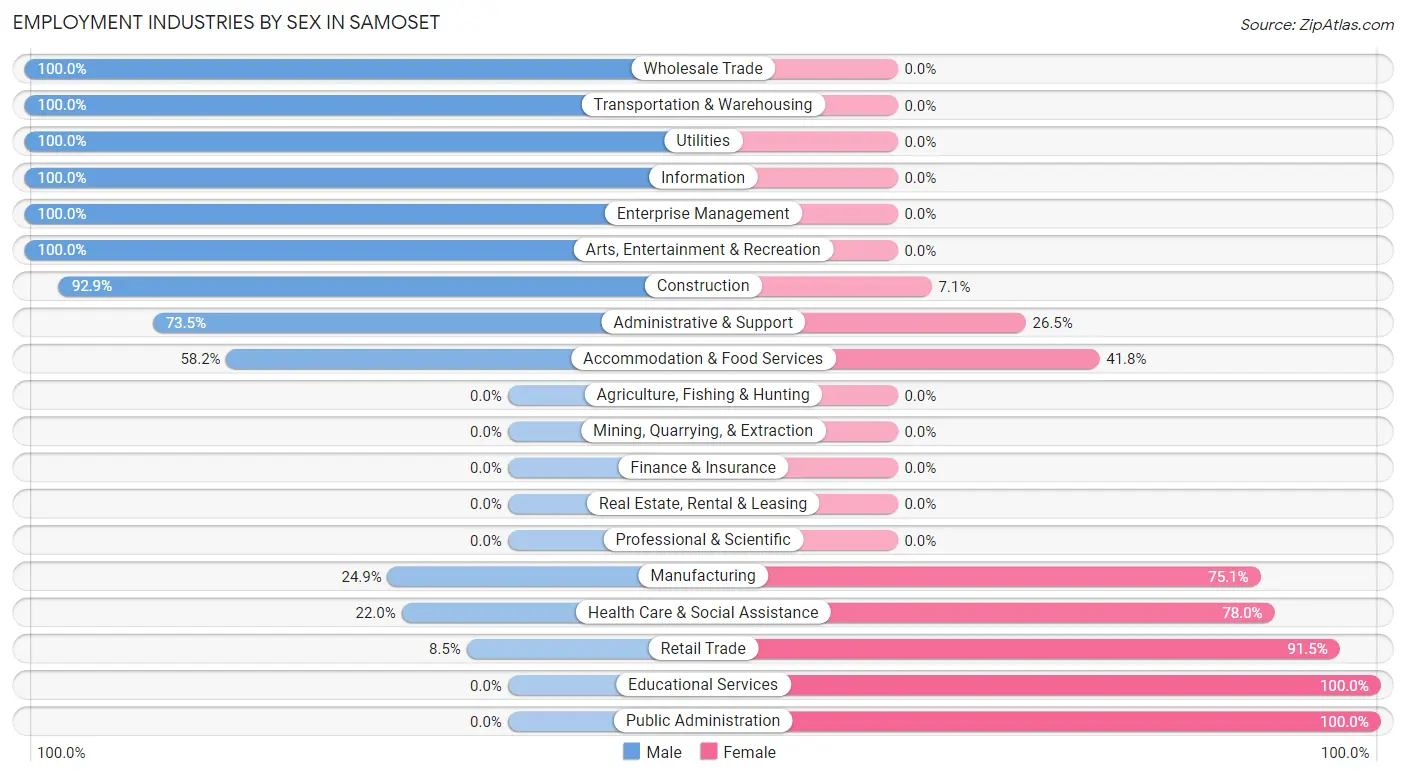
Employment Industries by Sex in Samoset
The Samoset industries that see more men than women are Wholesale Trade (100.0%), Transportation & Warehousing (100.0%), and Utilities (100.0%), whereas the industries that tend to have a higher number of women are Educational Services (100.0%), Public Administration (100.0%), and Retail Trade (91.5%).
| Industry | Male | Female |
| Agriculture, Fishing & Hunting | 0 (0.0%) | 0 (0.0%) |
| Mining, Quarrying, & Extraction | 0 (0.0%) | 0 (0.0%) |
| Construction | 262 (92.9%) | 20 (7.1%) |
| Manufacturing | 101 (24.9%) | 305 (75.1%) |
| Wholesale Trade | 23 (100.0%) | 0 (0.0%) |
| Retail Trade | 21 (8.5%) | 226 (91.5%) |
| Transportation & Warehousing | 59 (100.0%) | 0 (0.0%) |
| Utilities | 53 (100.0%) | 0 (0.0%) |
| Information | 21 (100.0%) | 0 (0.0%) |
| Finance & Insurance | 0 (0.0%) | 0 (0.0%) |
| Real Estate, Rental & Leasing | 0 (0.0%) | 0 (0.0%) |
| Professional & Scientific | 0 (0.0%) | 0 (0.0%) |
| Enterprise Management | 31 (100.0%) | 0 (0.0%) |
| Administrative & Support | 72 (73.5%) | 26 (26.5%) |
| Educational Services | 0 (0.0%) | 313 (100.0%) |
| Health Care & Social Assistance | 29 (22.0%) | 103 (78.0%) |
| Arts, Entertainment & Recreation | 6 (100.0%) | 0 (0.0%) |
| Accommodation & Food Services | 85 (58.2%) | 61 (41.8%) |
| Public Administration | 0 (0.0%) | 63 (100.0%) |
| Total | 763 (40.6%) | 1,118 (59.4%) |
Education in Samoset
School Enrollment in Samoset
The most common levels of schooling among the 744 students in Samoset are high school (218 | 29.3%), elementary school (198 | 26.6%), and middle school (185 | 24.9%).
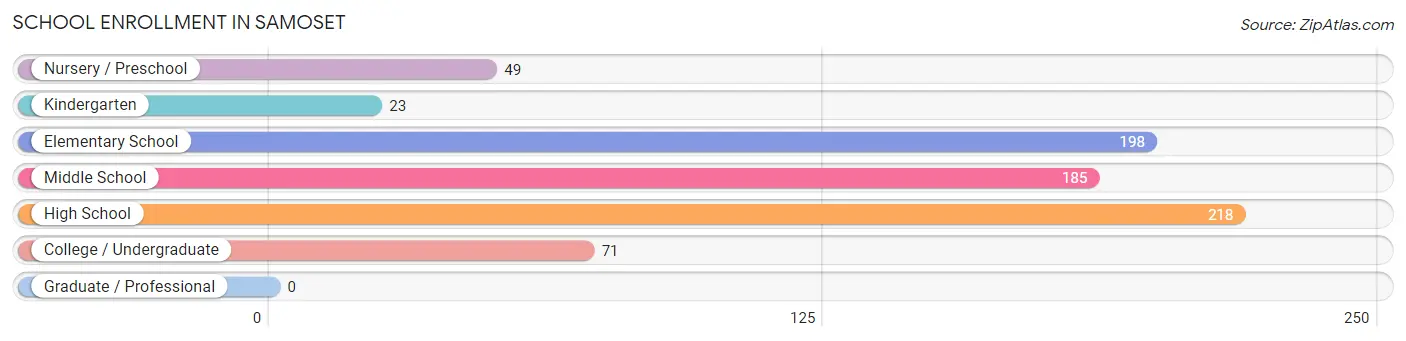
| School Level | # Students | % Students |
| Nursery / Preschool | 49 | 6.6% |
| Kindergarten | 23 | 3.1% |
| Elementary School | 198 | 26.6% |
| Middle School | 185 | 24.9% |
| High School | 218 | 29.3% |
| College / Undergraduate | 71 | 9.5% |
| Graduate / Professional | 0 | 0.0% |
| Total | 744 | 100.0% |
School Enrollment by Age by Funding Source in Samoset
Out of a total of 744 students who are enrolled in schools in Samoset, 111 (14.9%) attend a private institution, while the remaining 633 (85.1%) are enrolled in public schools. The age group of 20 to 24 year olds has the highest likelihood of being enrolled in private schools, with 33 (56.9% in the age bracket) enrolled. Conversely, the age group of 15 to 17 year olds has the lowest likelihood of being enrolled in a private school, with 181 (100.0% in the age bracket) attending a public institution.
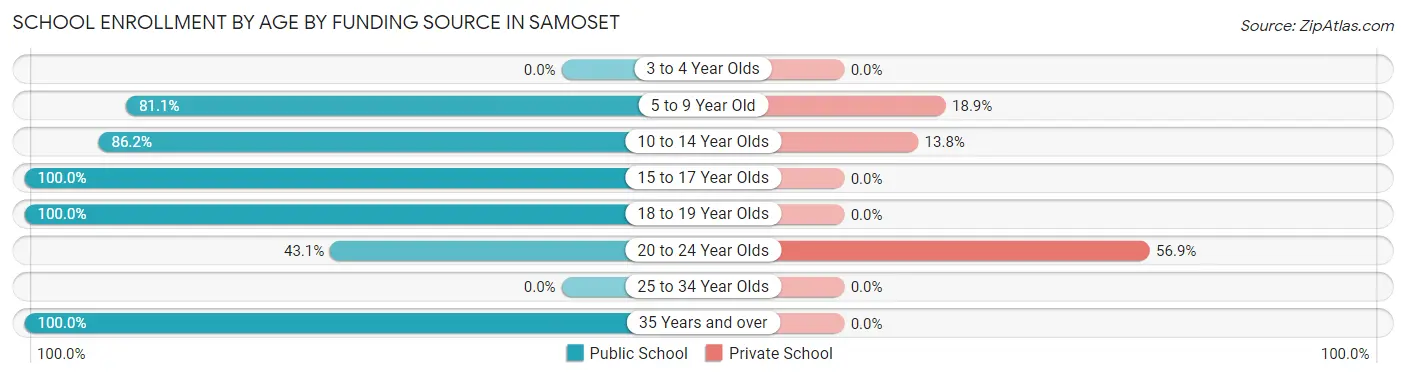
| Age Bracket | Public School | Private School |
| 3 to 4 Year Olds | 0 (0.0%) | 0 (0.0%) |
| 5 to 9 Year Old | 219 (81.1%) | 51 (18.9%) |
| 10 to 14 Year Olds | 169 (86.2%) | 27 (13.8%) |
| 15 to 17 Year Olds | 181 (100.0%) | 0 (0.0%) |
| 18 to 19 Year Olds | 36 (100.0%) | 0 (0.0%) |
| 20 to 24 Year Olds | 25 (43.1%) | 33 (56.9%) |
| 25 to 34 Year Olds | 0 (0.0%) | 0 (0.0%) |
| 35 Years and over | 3 (100.0%) | 0 (0.0%) |
| Total | 633 (85.1%) | 111 (14.9%) |
Educational Attainment by Field of Study in Samoset
Education (113 | 34.7%), arts & humanities (37 | 11.4%), science & technology (34 | 10.4%), business (34 | 10.4%), and computers & mathematics (31 | 9.5%) are the most common fields of study among 326 individuals in Samoset who have obtained a bachelor's degree or higher.
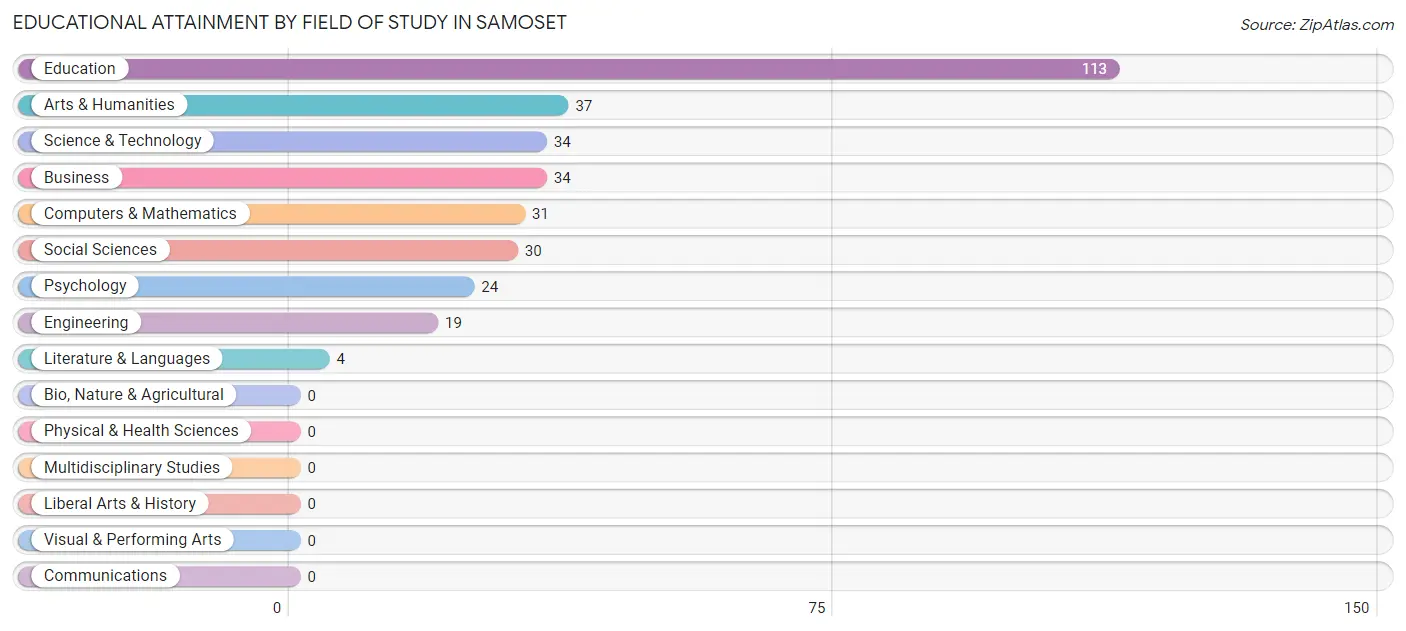
| Field of Study | # Graduates | % Graduates |
| Computers & Mathematics | 31 | 9.5% |
| Bio, Nature & Agricultural | 0 | 0.0% |
| Physical & Health Sciences | 0 | 0.0% |
| Psychology | 24 | 7.4% |
| Social Sciences | 30 | 9.2% |
| Engineering | 19 | 5.8% |
| Multidisciplinary Studies | 0 | 0.0% |
| Science & Technology | 34 | 10.4% |
| Business | 34 | 10.4% |
| Education | 113 | 34.7% |
| Literature & Languages | 4 | 1.2% |
| Liberal Arts & History | 0 | 0.0% |
| Visual & Performing Arts | 0 | 0.0% |
| Communications | 0 | 0.0% |
| Arts & Humanities | 37 | 11.4% |
| Total | 326 | 100.0% |
Transportation & Commute in Samoset
Vehicle Availability by Sex in Samoset
The most prevalent vehicle ownership categories in Samoset are males with 3 vehicles (280, accounting for 39.4%) and females with 3 vehicles (485, making up 27.5%).
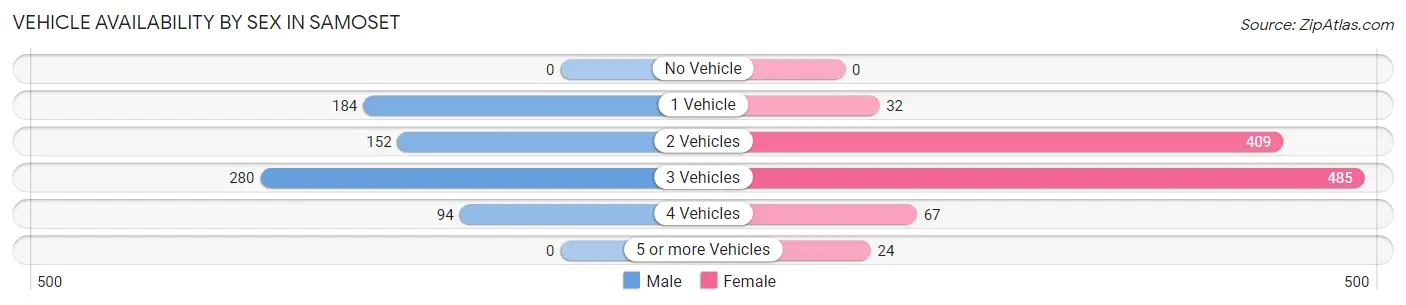
| Vehicles Available | Male | Female |
| No Vehicle | 0 (0.0%) | 0 (0.0%) |
| 1 Vehicle | 184 (25.9%) | 32 (3.2%) |
| 2 Vehicles | 152 (21.4%) | 409 (40.2%) |
| 3 Vehicles | 280 (39.4%) | 485 (47.7%) |
| 4 Vehicles | 94 (13.2%) | 67 (6.6%) |
| 5 or more Vehicles | 0 (0.0%) | 24 (2.4%) |
| Total | 710 (100.0%) | 1,017 (100.0%) |
Commute Time in Samoset
The most frequently occuring commute durations in Samoset are 30 to 34 minutes (405 commuters, 24.1%), 15 to 19 minutes (322 commuters, 19.1%), and 20 to 24 minutes (303 commuters, 18.0%).
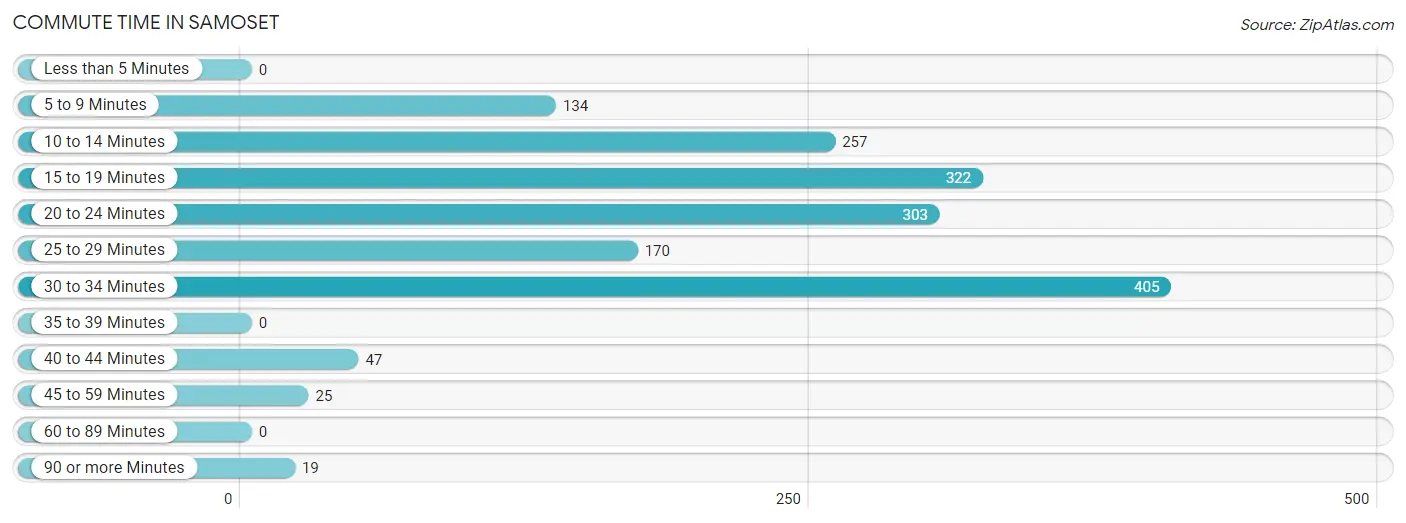
| Commute Time | # Commuters | % Commuters |
| Less than 5 Minutes | 0 | 0.0% |
| 5 to 9 Minutes | 134 | 8.0% |
| 10 to 14 Minutes | 257 | 15.3% |
| 15 to 19 Minutes | 322 | 19.1% |
| 20 to 24 Minutes | 303 | 18.0% |
| 25 to 29 Minutes | 170 | 10.1% |
| 30 to 34 Minutes | 405 | 24.1% |
| 35 to 39 Minutes | 0 | 0.0% |
| 40 to 44 Minutes | 47 | 2.8% |
| 45 to 59 Minutes | 25 | 1.5% |
| 60 to 89 Minutes | 0 | 0.0% |
| 90 or more Minutes | 19 | 1.1% |
Commute Time by Sex in Samoset
The most common commute times in Samoset are 15 to 19 minutes (237 commuters, 33.5%) for males and 10 to 14 minutes (234 commuters, 24.0%) for females.
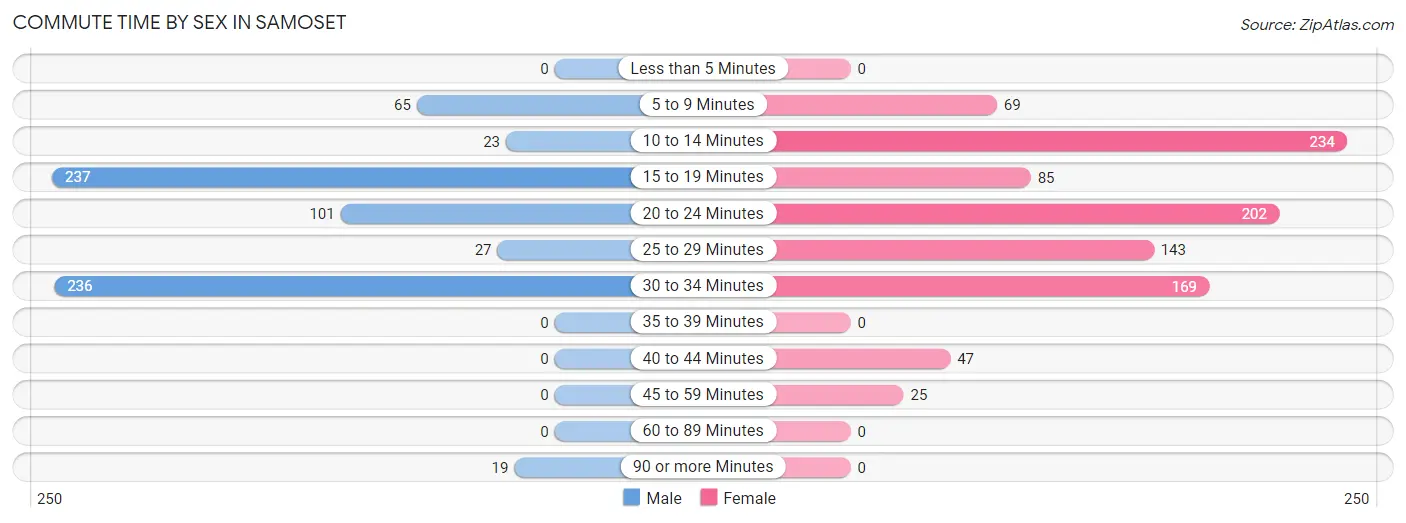
| Commute Time | Male | Female |
| Less than 5 Minutes | 0 (0.0%) | 0 (0.0%) |
| 5 to 9 Minutes | 65 (9.2%) | 69 (7.1%) |
| 10 to 14 Minutes | 23 (3.3%) | 234 (24.0%) |
| 15 to 19 Minutes | 237 (33.5%) | 85 (8.7%) |
| 20 to 24 Minutes | 101 (14.3%) | 202 (20.7%) |
| 25 to 29 Minutes | 27 (3.8%) | 143 (14.7%) |
| 30 to 34 Minutes | 236 (33.3%) | 169 (17.3%) |
| 35 to 39 Minutes | 0 (0.0%) | 0 (0.0%) |
| 40 to 44 Minutes | 0 (0.0%) | 47 (4.8%) |
| 45 to 59 Minutes | 0 (0.0%) | 25 (2.6%) |
| 60 to 89 Minutes | 0 (0.0%) | 0 (0.0%) |
| 90 or more Minutes | 19 (2.7%) | 0 (0.0%) |
Time of Departure to Work by Sex in Samoset
The most frequent times of departure to work in Samoset are 6:00 AM to 6:29 AM (189, 26.7%) for males and 7:30 AM to 7:59 AM (272, 27.9%) for females.
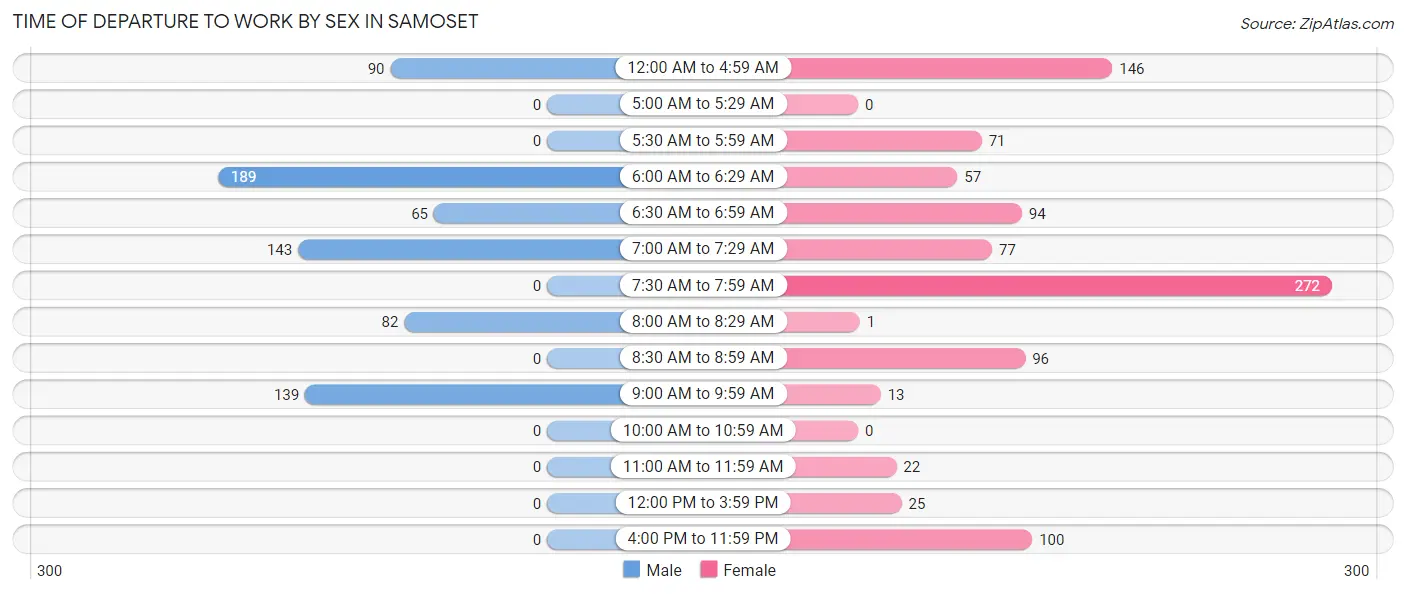
| Time of Departure | Male | Female |
| 12:00 AM to 4:59 AM | 90 (12.7%) | 146 (15.0%) |
| 5:00 AM to 5:29 AM | 0 (0.0%) | 0 (0.0%) |
| 5:30 AM to 5:59 AM | 0 (0.0%) | 71 (7.3%) |
| 6:00 AM to 6:29 AM | 189 (26.7%) | 57 (5.9%) |
| 6:30 AM to 6:59 AM | 65 (9.2%) | 94 (9.7%) |
| 7:00 AM to 7:29 AM | 143 (20.2%) | 77 (7.9%) |
| 7:30 AM to 7:59 AM | 0 (0.0%) | 272 (27.9%) |
| 8:00 AM to 8:29 AM | 82 (11.6%) | 1 (0.1%) |
| 8:30 AM to 8:59 AM | 0 (0.0%) | 96 (9.9%) |
| 9:00 AM to 9:59 AM | 139 (19.6%) | 13 (1.3%) |
| 10:00 AM to 10:59 AM | 0 (0.0%) | 0 (0.0%) |
| 11:00 AM to 11:59 AM | 0 (0.0%) | 22 (2.3%) |
| 12:00 PM to 3:59 PM | 0 (0.0%) | 25 (2.6%) |
| 4:00 PM to 11:59 PM | 0 (0.0%) | 100 (10.3%) |
| Total | 708 (100.0%) | 974 (100.0%) |
Housing Occupancy in Samoset
Occupancy by Ownership in Samoset
Of the total 1,302 dwellings in Samoset, owner-occupied units account for 865 (66.4%), while renter-occupied units make up 437 (33.6%).
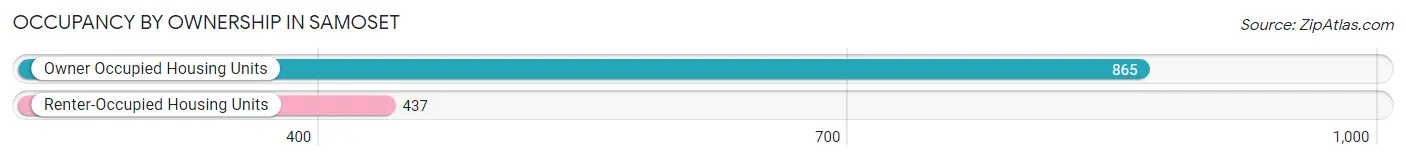
| Occupancy | # Housing Units | % Housing Units |
| Owner Occupied Housing Units | 865 | 66.4% |
| Renter-Occupied Housing Units | 437 | 33.6% |
| Total Occupied Housing Units | 1,302 | 100.0% |
Occupancy by Household Size in Samoset
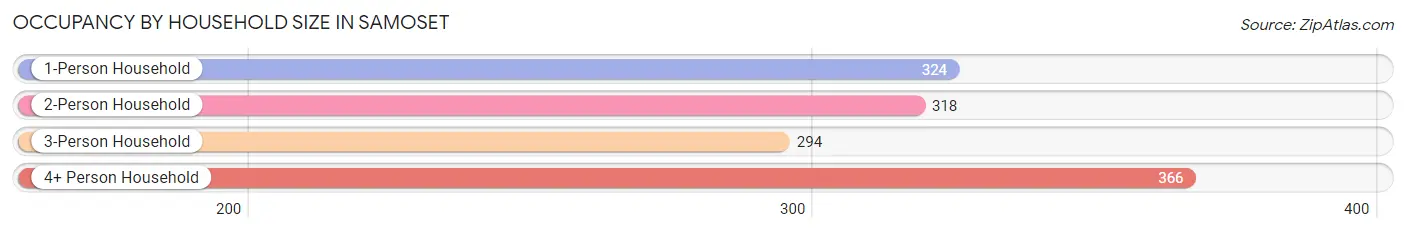
| Household Size | # Housing Units | % Housing Units |
| 1-Person Household | 324 | 24.9% |
| 2-Person Household | 318 | 24.4% |
| 3-Person Household | 294 | 22.6% |
| 4+ Person Household | 366 | 28.1% |
| Total Housing Units | 1,302 | 100.0% |
Occupancy by Ownership by Household Size in Samoset
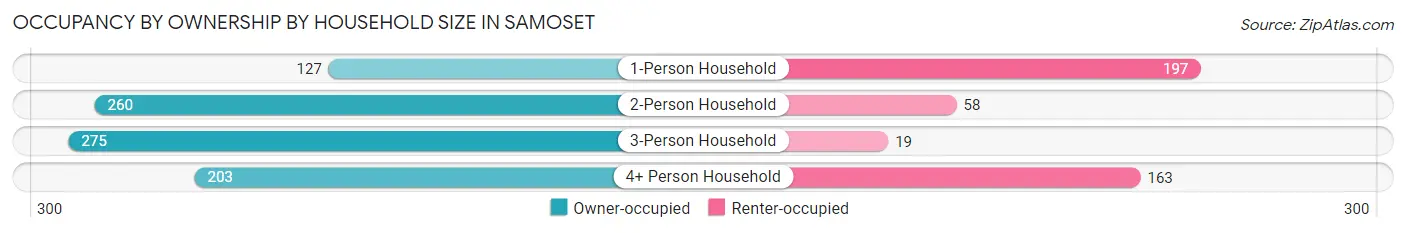
| Household Size | Owner-occupied | Renter-occupied |
| 1-Person Household | 127 (39.2%) | 197 (60.8%) |
| 2-Person Household | 260 (81.8%) | 58 (18.2%) |
| 3-Person Household | 275 (93.5%) | 19 (6.5%) |
| 4+ Person Household | 203 (55.5%) | 163 (44.5%) |
| Total Housing Units | 865 (66.4%) | 437 (33.6%) |
Occupancy by Educational Attainment in Samoset
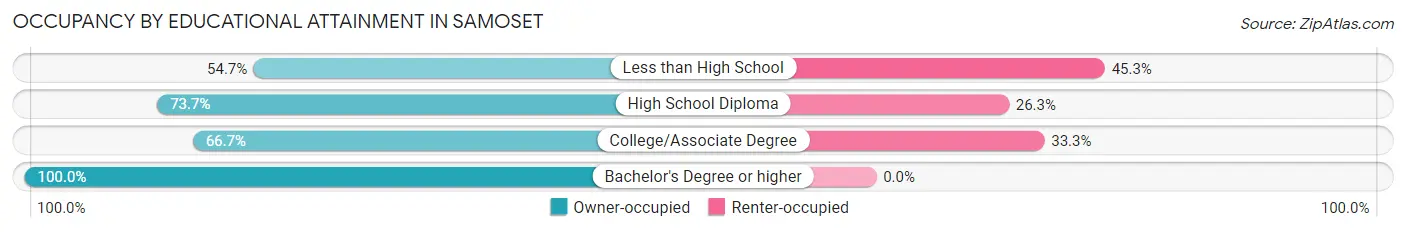
| Household Size | Owner-occupied | Renter-occupied |
| Less than High School | 303 (54.7%) | 251 (45.3%) |
| High School Diploma | 353 (73.7%) | 126 (26.3%) |
| College/Associate Degree | 120 (66.7%) | 60 (33.3%) |
| Bachelor's Degree or higher | 89 (100.0%) | 0 (0.0%) |
Occupancy by Age of Householder in Samoset
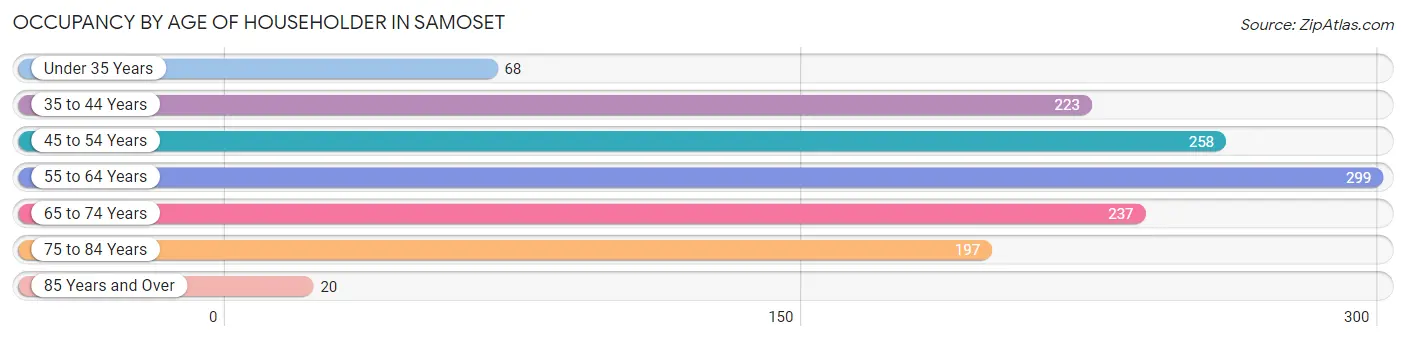
| Age Bracket | # Households | % Households |
| Under 35 Years | 68 | 5.2% |
| 35 to 44 Years | 223 | 17.1% |
| 45 to 54 Years | 258 | 19.8% |
| 55 to 64 Years | 299 | 23.0% |
| 65 to 74 Years | 237 | 18.2% |
| 75 to 84 Years | 197 | 15.1% |
| 85 Years and Over | 20 | 1.5% |
| Total | 1,302 | 100.0% |
Housing Finances in Samoset
Median Income by Occupancy in Samoset
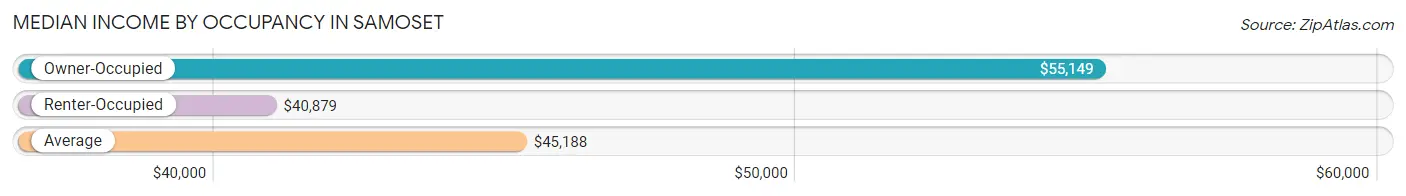
| Occupancy Type | # Households | Median Income |
| Owner-Occupied | 865 (66.4%) | $55,149 |
| Renter-Occupied | 437 (33.6%) | $40,879 |
| Average | 1,302 (100.0%) | $45,188 |
Occupancy by Householder Income Bracket in Samoset
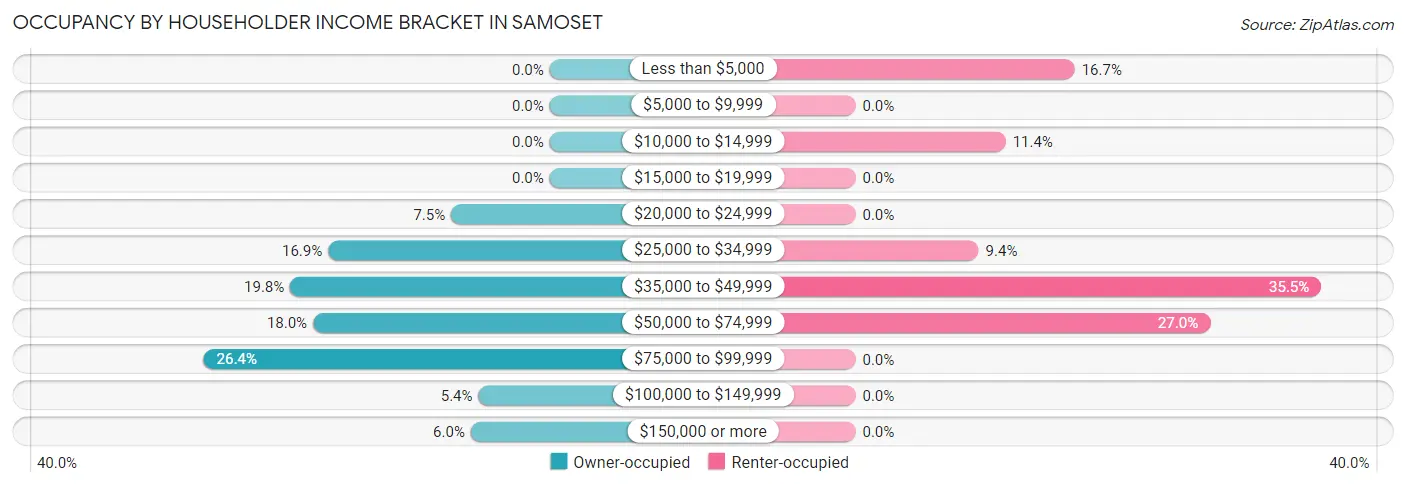
| Income Bracket | Owner-occupied | Renter-occupied |
| Less than $5,000 | 0 (0.0%) | 73 (16.7%) |
| $5,000 to $9,999 | 0 (0.0%) | 0 (0.0%) |
| $10,000 to $14,999 | 0 (0.0%) | 50 (11.4%) |
| $15,000 to $19,999 | 0 (0.0%) | 0 (0.0%) |
| $20,000 to $24,999 | 65 (7.5%) | 0 (0.0%) |
| $25,000 to $34,999 | 146 (16.9%) | 41 (9.4%) |
| $35,000 to $49,999 | 171 (19.8%) | 155 (35.5%) |
| $50,000 to $74,999 | 156 (18.0%) | 118 (27.0%) |
| $75,000 to $99,999 | 228 (26.4%) | 0 (0.0%) |
| $100,000 to $149,999 | 47 (5.4%) | 0 (0.0%) |
| $150,000 or more | 52 (6.0%) | 0 (0.0%) |
| Total | 865 (100.0%) | 437 (100.0%) |
Monthly Housing Cost Tiers in Samoset
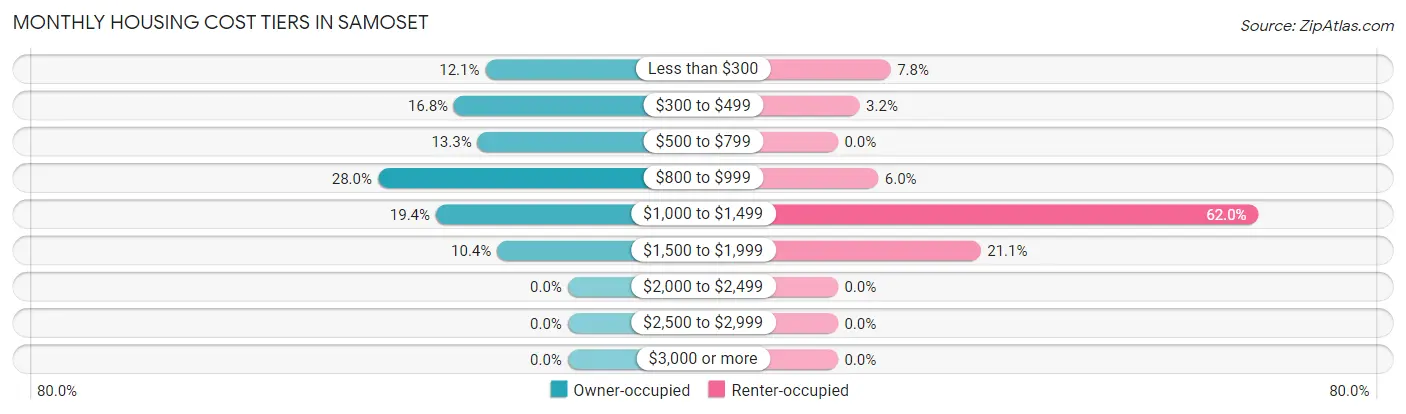
| Monthly Cost | Owner-occupied | Renter-occupied |
| Less than $300 | 105 (12.1%) | 34 (7.8%) |
| $300 to $499 | 145 (16.8%) | 14 (3.2%) |
| $500 to $799 | 115 (13.3%) | 0 (0.0%) |
| $800 to $999 | 242 (28.0%) | 26 (5.9%) |
| $1,000 to $1,499 | 168 (19.4%) | 271 (62.0%) |
| $1,500 to $1,999 | 90 (10.4%) | 92 (21.0%) |
| $2,000 to $2,499 | 0 (0.0%) | 0 (0.0%) |
| $2,500 to $2,999 | 0 (0.0%) | 0 (0.0%) |
| $3,000 or more | 0 (0.0%) | 0 (0.0%) |
| Total | 865 (100.0%) | 437 (100.0%) |
Physical Housing Characteristics in Samoset
Housing Structures in Samoset
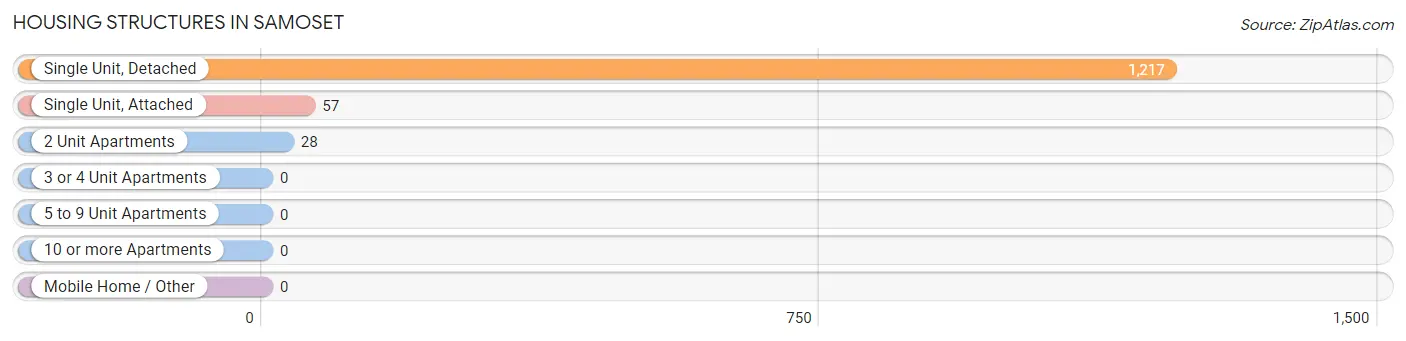
| Structure Type | # Housing Units | % Housing Units |
| Single Unit, Detached | 1,217 | 93.5% |
| Single Unit, Attached | 57 | 4.4% |
| 2 Unit Apartments | 28 | 2.1% |
| 3 or 4 Unit Apartments | 0 | 0.0% |
| 5 to 9 Unit Apartments | 0 | 0.0% |
| 10 or more Apartments | 0 | 0.0% |
| Mobile Home / Other | 0 | 0.0% |
| Total | 1,302 | 100.0% |
Housing Structures by Occupancy in Samoset
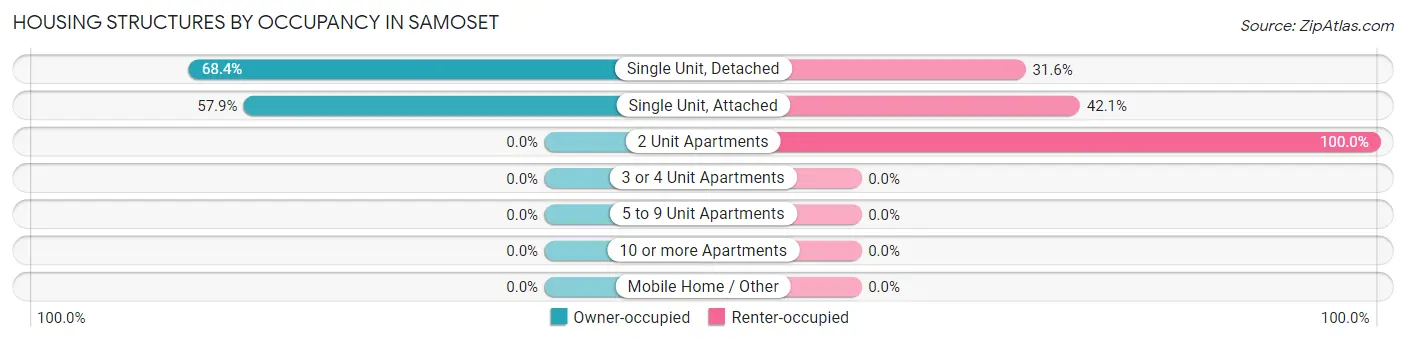
| Structure Type | Owner-occupied | Renter-occupied |
| Single Unit, Detached | 832 (68.4%) | 385 (31.6%) |
| Single Unit, Attached | 33 (57.9%) | 24 (42.1%) |
| 2 Unit Apartments | 0 (0.0%) | 28 (100.0%) |
| 3 or 4 Unit Apartments | 0 (0.0%) | 0 (0.0%) |
| 5 to 9 Unit Apartments | 0 (0.0%) | 0 (0.0%) |
| 10 or more Apartments | 0 (0.0%) | 0 (0.0%) |
| Mobile Home / Other | 0 (0.0%) | 0 (0.0%) |
| Total | 865 (66.4%) | 437 (33.6%) |
Housing Structures by Number of Rooms in Samoset
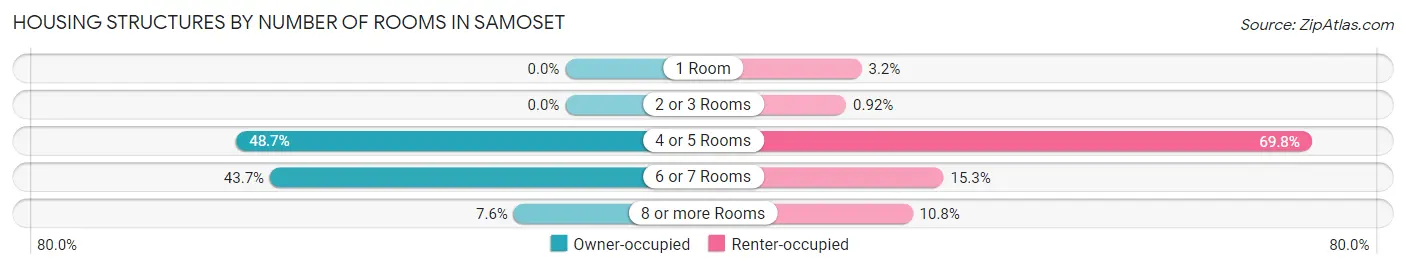
| Number of Rooms | Owner-occupied | Renter-occupied |
| 1 Room | 0 (0.0%) | 14 (3.2%) |
| 2 or 3 Rooms | 0 (0.0%) | 4 (0.9%) |
| 4 or 5 Rooms | 421 (48.7%) | 305 (69.8%) |
| 6 or 7 Rooms | 378 (43.7%) | 67 (15.3%) |
| 8 or more Rooms | 66 (7.6%) | 47 (10.8%) |
| Total | 865 (100.0%) | 437 (100.0%) |
Housing Structure by Heating Type in Samoset
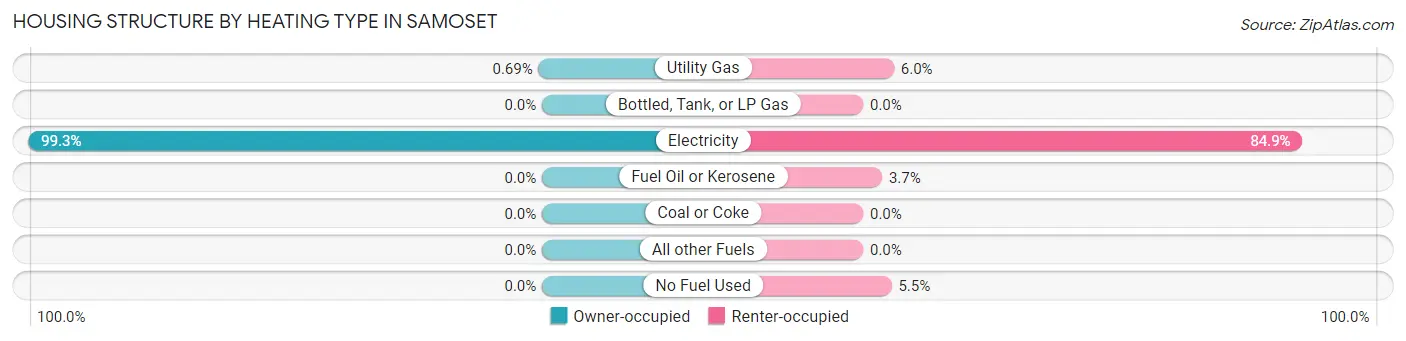
| Heating Type | Owner-occupied | Renter-occupied |
| Utility Gas | 6 (0.7%) | 26 (5.9%) |
| Bottled, Tank, or LP Gas | 0 (0.0%) | 0 (0.0%) |
| Electricity | 859 (99.3%) | 371 (84.9%) |
| Fuel Oil or Kerosene | 0 (0.0%) | 16 (3.7%) |
| Coal or Coke | 0 (0.0%) | 0 (0.0%) |
| All other Fuels | 0 (0.0%) | 0 (0.0%) |
| No Fuel Used | 0 (0.0%) | 24 (5.5%) |
| Total | 865 (100.0%) | 437 (100.0%) |
Household Vehicle Usage in Samoset
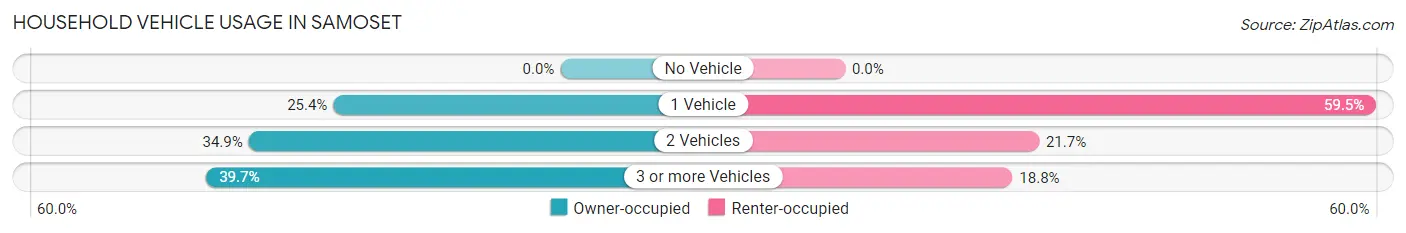
| Vehicles per Household | Owner-occupied | Renter-occupied |
| No Vehicle | 0 (0.0%) | 0 (0.0%) |
| 1 Vehicle | 220 (25.4%) | 260 (59.5%) |
| 2 Vehicles | 302 (34.9%) | 95 (21.7%) |
| 3 or more Vehicles | 343 (39.7%) | 82 (18.8%) |
| Total | 865 (100.0%) | 437 (100.0%) |
Real Estate & Mortgages in Samoset
Real Estate and Mortgage Overview in Samoset
| Characteristic | Without Mortgage | With Mortgage |
| Housing Units | 297 | 568 |
| Median Property Value | $120,100 | $129,400 |
| Median Household Income | $36,756 | $11 |
| Monthly Housing Costs | $352 | $0 |
| Real Estate Taxes | - | - |
Property Value by Mortgage Status in Samoset
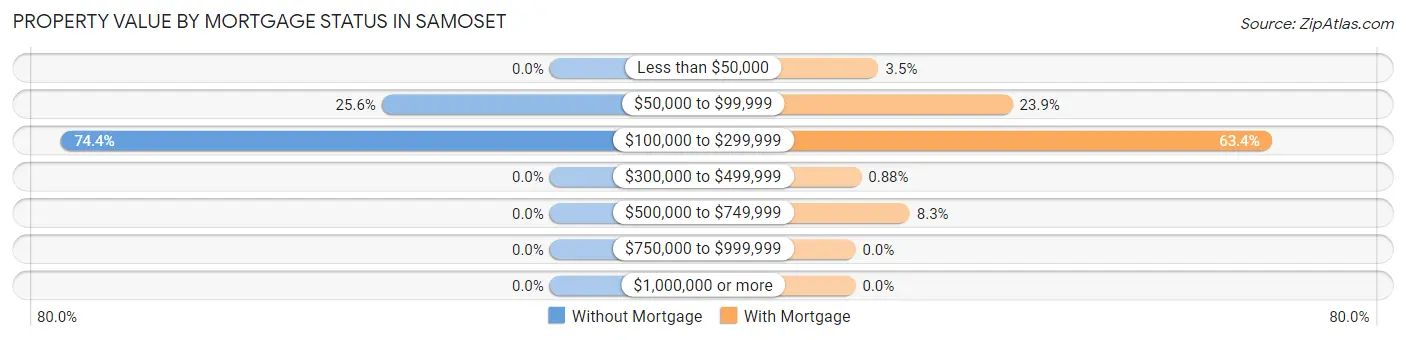
| Property Value | Without Mortgage | With Mortgage |
| Less than $50,000 | 0 (0.0%) | 20 (3.5%) |
| $50,000 to $99,999 | 76 (25.6%) | 136 (23.9%) |
| $100,000 to $299,999 | 221 (74.4%) | 360 (63.4%) |
| $300,000 to $499,999 | 0 (0.0%) | 5 (0.9%) |
| $500,000 to $749,999 | 0 (0.0%) | 47 (8.3%) |
| $750,000 to $999,999 | 0 (0.0%) | 0 (0.0%) |
| $1,000,000 or more | 0 (0.0%) | 0 (0.0%) |
| Total | 297 (100.0%) | 568 (100.0%) |
Household Income by Mortgage Status in Samoset
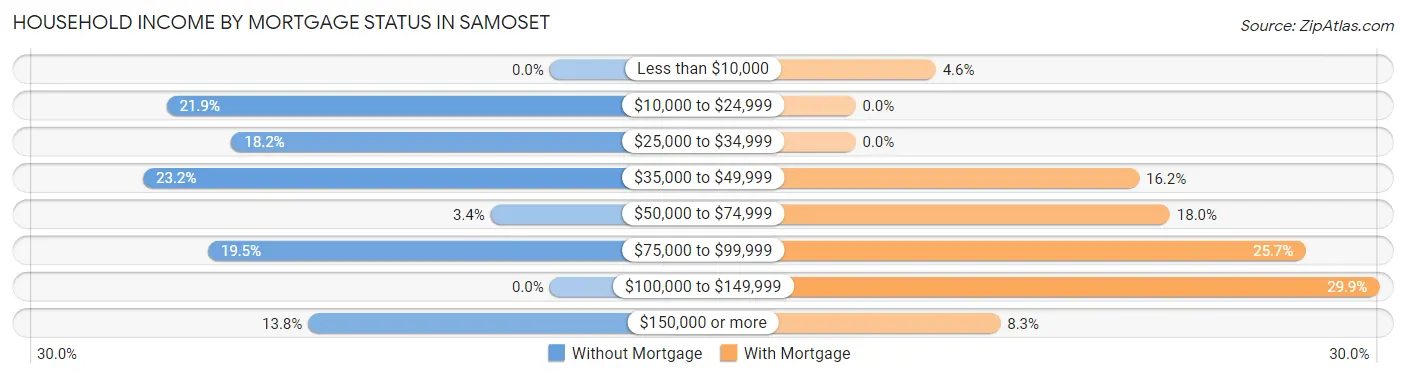
| Household Income | Without Mortgage | With Mortgage |
| Less than $10,000 | 0 (0.0%) | 26 (4.6%) |
| $10,000 to $24,999 | 65 (21.9%) | 0 (0.0%) |
| $25,000 to $34,999 | 54 (18.2%) | 0 (0.0%) |
| $35,000 to $49,999 | 69 (23.2%) | 92 (16.2%) |
| $50,000 to $74,999 | 10 (3.4%) | 102 (18.0%) |
| $75,000 to $99,999 | 58 (19.5%) | 146 (25.7%) |
| $100,000 to $149,999 | 0 (0.0%) | 170 (29.9%) |
| $150,000 or more | 41 (13.8%) | 47 (8.3%) |
| Total | 297 (100.0%) | 568 (100.0%) |
Property Value to Household Income Ratio in Samoset
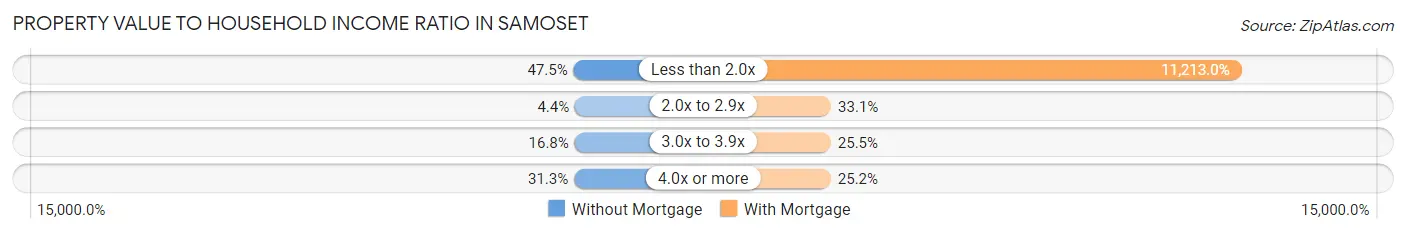
| Value-to-Income Ratio | Without Mortgage | With Mortgage |
| Less than 2.0x | 141 (47.5%) | 63,690 (11,213.0%) |
| 2.0x to 2.9x | 13 (4.4%) | 188 (33.1%) |
| 3.0x to 3.9x | 50 (16.8%) | 145 (25.5%) |
| 4.0x or more | 93 (31.3%) | 143 (25.2%) |
| Total | 297 (100.0%) | 568 (100.0%) |
Real Estate Taxes by Mortgage Status in Samoset
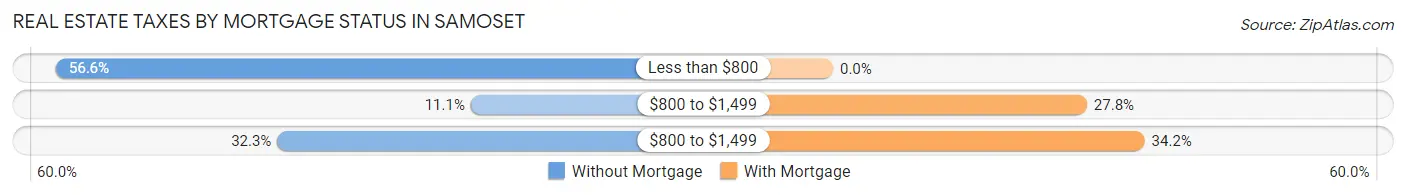
| Property Taxes | Without Mortgage | With Mortgage |
| Less than $800 | 168 (56.6%) | 0 (0.0%) |
| $800 to $1,499 | 33 (11.1%) | 158 (27.8%) |
| $800 to $1,499 | 96 (32.3%) | 194 (34.2%) |
| Total | 297 (100.0%) | 568 (100.0%) |
Health & Disability in Samoset
Health Insurance Coverage by Age in Samoset
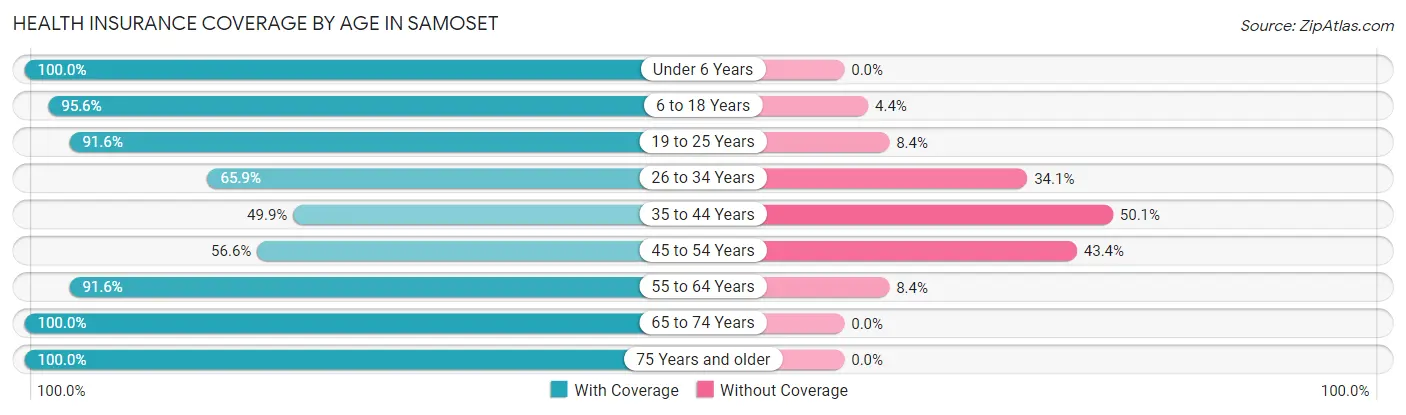
| Age Bracket | With Coverage | Without Coverage |
| Under 6 Years | 244 (100.0%) | 0 (0.0%) |
| 6 to 18 Years | 559 (95.6%) | 26 (4.4%) |
| 19 to 25 Years | 361 (91.6%) | 33 (8.4%) |
| 26 to 34 Years | 309 (65.9%) | 160 (34.1%) |
| 35 to 44 Years | 318 (49.9%) | 319 (50.1%) |
| 45 to 54 Years | 299 (56.6%) | 229 (43.4%) |
| 55 to 64 Years | 558 (91.6%) | 51 (8.4%) |
| 65 to 74 Years | 331 (100.0%) | 0 (0.0%) |
| 75 Years and older | 438 (100.0%) | 0 (0.0%) |
| Total | 3,417 (80.7%) | 818 (19.3%) |
Health Insurance Coverage by Citizenship Status in Samoset
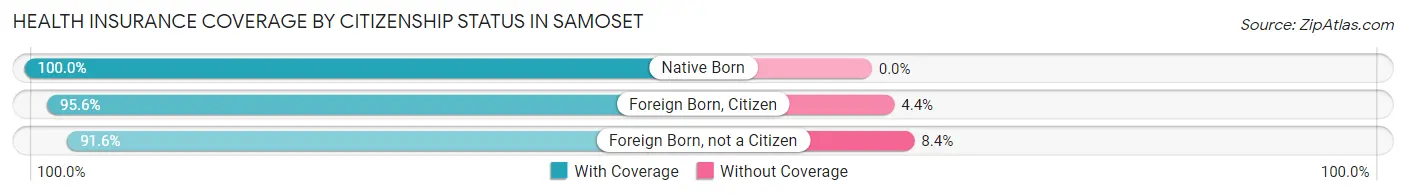
| Citizenship Status | With Coverage | Without Coverage |
| Native Born | 244 (100.0%) | 0 (0.0%) |
| Foreign Born, Citizen | 559 (95.6%) | 26 (4.4%) |
| Foreign Born, not a Citizen | 361 (91.6%) | 33 (8.4%) |
Health Insurance Coverage by Household Income in Samoset
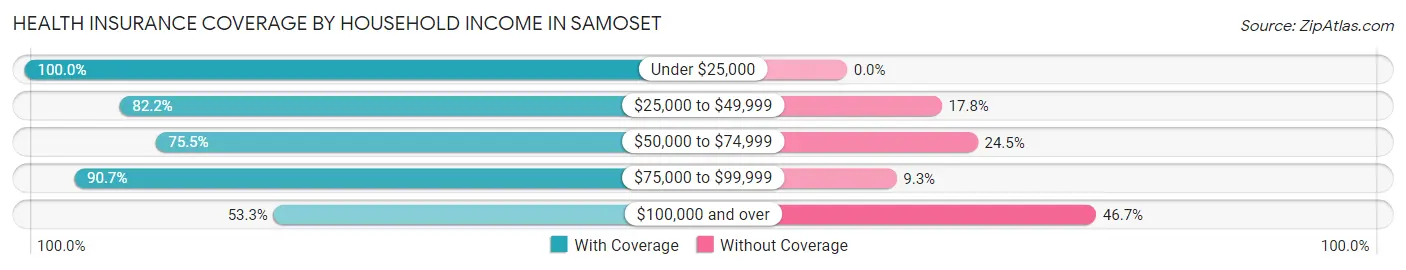
| Household Income | With Coverage | Without Coverage |
| Under $25,000 | 294 (100.0%) | 0 (0.0%) |
| $25,000 to $49,999 | 1,222 (82.2%) | 264 (17.8%) |
| $50,000 to $74,999 | 761 (75.5%) | 247 (24.5%) |
| $75,000 to $99,999 | 870 (90.7%) | 89 (9.3%) |
| $100,000 and over | 216 (53.3%) | 189 (46.7%) |
Public vs Private Health Insurance Coverage by Age in Samoset
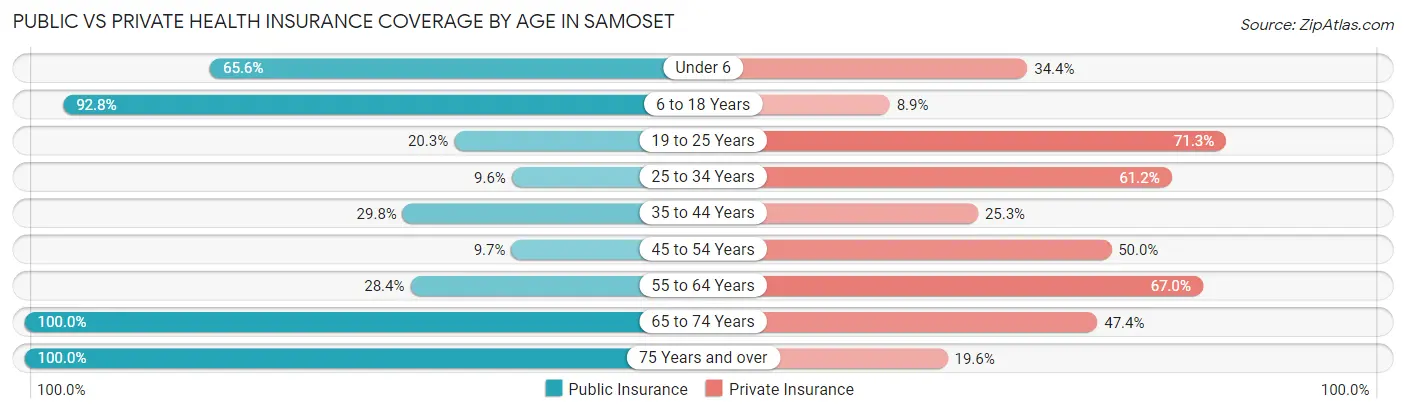
| Age Bracket | Public Insurance | Private Insurance |
| Under 6 | 160 (65.6%) | 84 (34.4%) |
| 6 to 18 Years | 543 (92.8%) | 52 (8.9%) |
| 19 to 25 Years | 80 (20.3%) | 281 (71.3%) |
| 25 to 34 Years | 45 (9.6%) | 287 (61.2%) |
| 35 to 44 Years | 190 (29.8%) | 161 (25.3%) |
| 45 to 54 Years | 51 (9.7%) | 264 (50.0%) |
| 55 to 64 Years | 173 (28.4%) | 408 (67.0%) |
| 65 to 74 Years | 331 (100.0%) | 157 (47.4%) |
| 75 Years and over | 438 (100.0%) | 86 (19.6%) |
| Total | 2,011 (47.5%) | 1,780 (42.0%) |
Disability Status by Sex by Age in Samoset
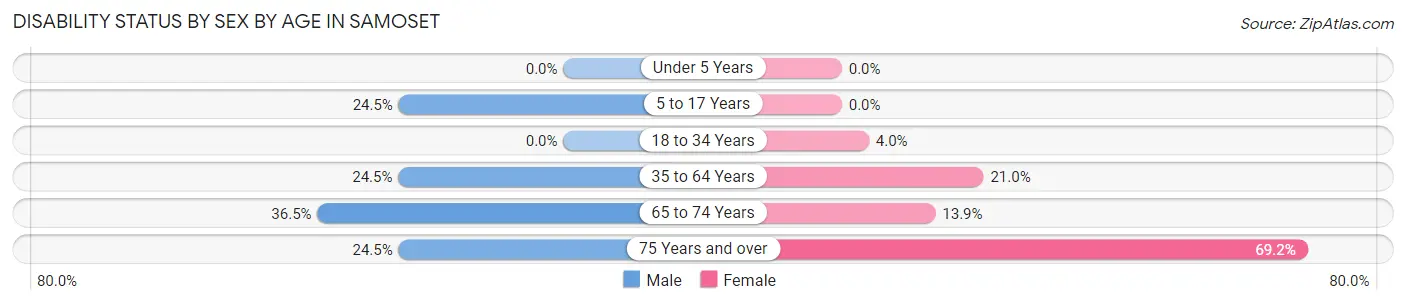
| Age Bracket | Male | Female |
| Under 5 Years | 0 (0.0%) | 0 (0.0%) |
| 5 to 17 Years | 100 (24.4%) | 0 (0.0%) |
| 18 to 34 Years | 0 (0.0%) | 23 (4.0%) |
| 35 to 64 Years | 189 (24.5%) | 211 (21.0%) |
| 65 to 74 Years | 42 (36.5%) | 30 (13.9%) |
| 75 Years and over | 58 (24.5%) | 139 (69.2%) |
Disability Class by Sex by Age in Samoset
Disability Class: Hearing Difficulty
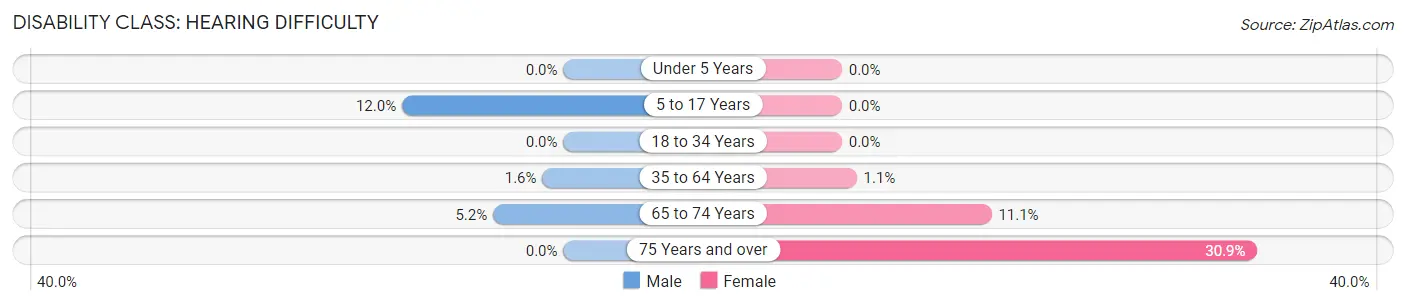
| Age Bracket | Male | Female |
| Under 5 Years | 0 (0.0%) | 0 (0.0%) |
| 5 to 17 Years | 49 (12.0%) | 0 (0.0%) |
| 18 to 34 Years | 0 (0.0%) | 0 (0.0%) |
| 35 to 64 Years | 12 (1.6%) | 11 (1.1%) |
| 65 to 74 Years | 6 (5.2%) | 24 (11.1%) |
| 75 Years and over | 0 (0.0%) | 62 (30.8%) |
Disability Class: Vision Difficulty
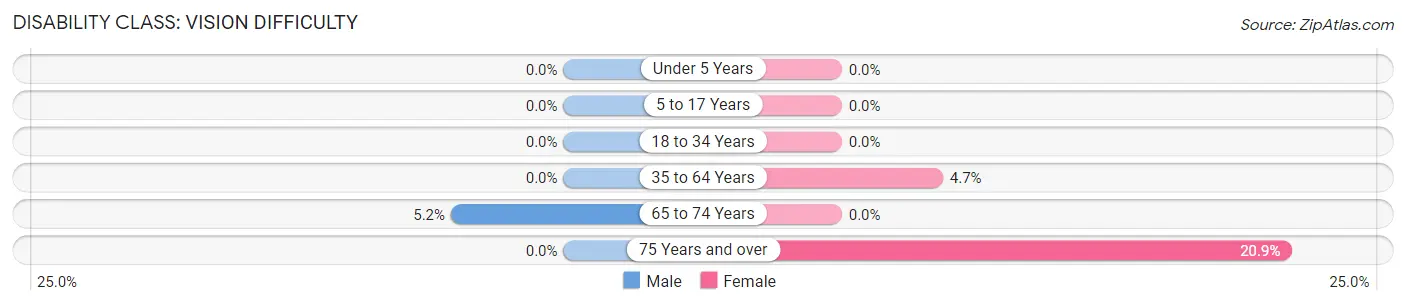
| Age Bracket | Male | Female |
| Under 5 Years | 0 (0.0%) | 0 (0.0%) |
| 5 to 17 Years | 0 (0.0%) | 0 (0.0%) |
| 18 to 34 Years | 0 (0.0%) | 0 (0.0%) |
| 35 to 64 Years | 0 (0.0%) | 47 (4.7%) |
| 65 to 74 Years | 6 (5.2%) | 0 (0.0%) |
| 75 Years and over | 0 (0.0%) | 42 (20.9%) |
Disability Class: Cognitive Difficulty
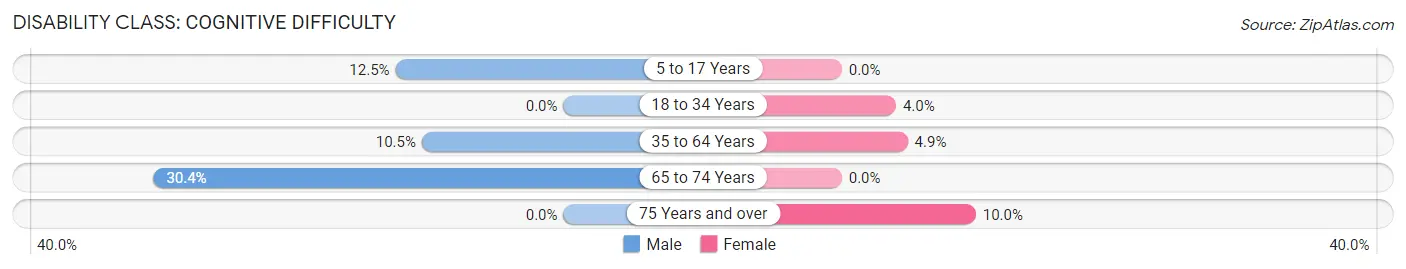
| Age Bracket | Male | Female |
| 5 to 17 Years | 51 (12.5%) | 0 (0.0%) |
| 18 to 34 Years | 0 (0.0%) | 23 (4.0%) |
| 35 to 64 Years | 81 (10.5%) | 49 (4.9%) |
| 65 to 74 Years | 35 (30.4%) | 0 (0.0%) |
| 75 Years and over | 0 (0.0%) | 20 (10.0%) |
Disability Class: Ambulatory Difficulty
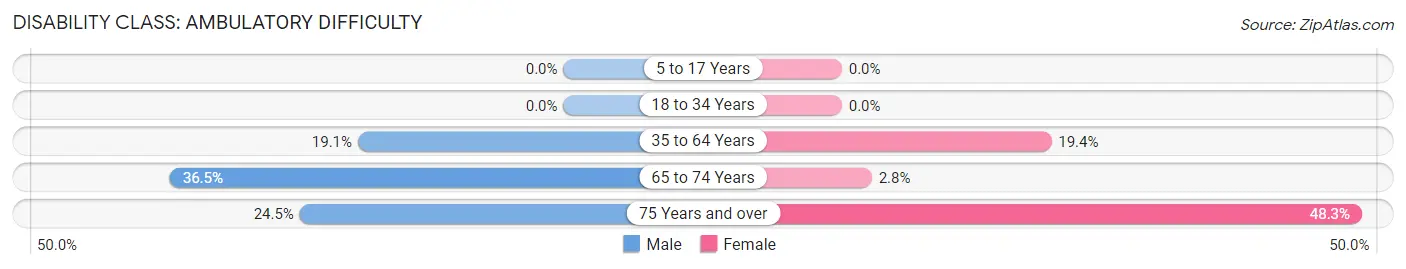
| Age Bracket | Male | Female |
| 5 to 17 Years | 0 (0.0%) | 0 (0.0%) |
| 18 to 34 Years | 0 (0.0%) | 0 (0.0%) |
| 35 to 64 Years | 147 (19.1%) | 195 (19.4%) |
| 65 to 74 Years | 42 (36.5%) | 6 (2.8%) |
| 75 Years and over | 58 (24.5%) | 97 (48.3%) |
Disability Class: Self-Care Difficulty
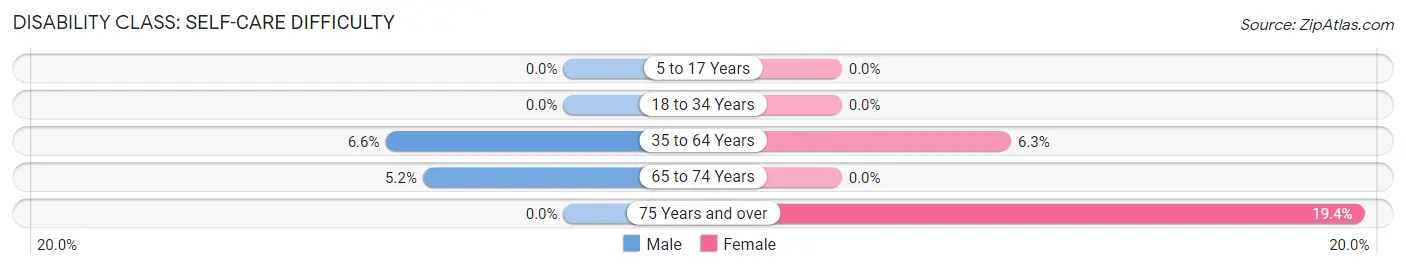
| Age Bracket | Male | Female |
| 5 to 17 Years | 0 (0.0%) | 0 (0.0%) |
| 18 to 34 Years | 0 (0.0%) | 0 (0.0%) |
| 35 to 64 Years | 51 (6.6%) | 63 (6.3%) |
| 65 to 74 Years | 6 (5.2%) | 0 (0.0%) |
| 75 Years and over | 0 (0.0%) | 39 (19.4%) |
Technology Access in Samoset
Computing Device Access in Samoset
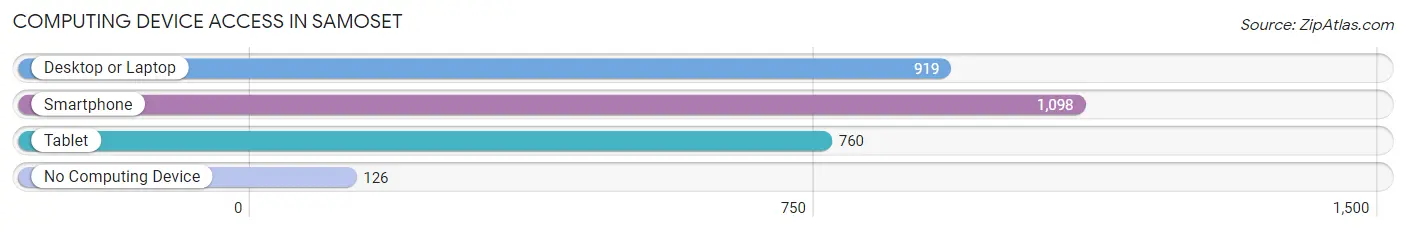
| Device Type | # Households | % Households |
| Desktop or Laptop | 919 | 70.6% |
| Smartphone | 1,098 | 84.3% |
| Tablet | 760 | 58.4% |
| No Computing Device | 126 | 9.7% |
| Total | 1,302 | 100.0% |
Internet Access in Samoset
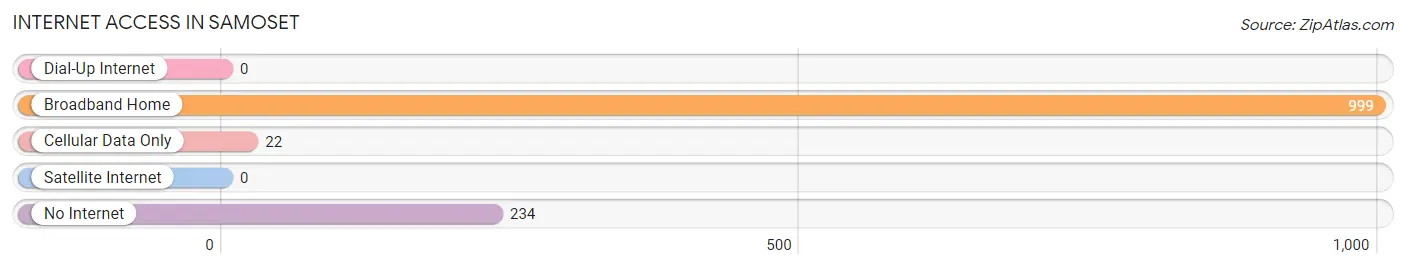
| Internet Type | # Households | % Households |
| Dial-Up Internet | 0 | 0.0% |
| Broadband Home | 999 | 76.7% |
| Cellular Data Only | 22 | 1.7% |
| Satellite Internet | 0 | 0.0% |
| No Internet | 234 | 18.0% |
| Total | 1,302 | 100.0% |
Samoset Summary
Samoset, Florida is a small town located in Manatee County, Florida. It is situated on the Gulf of Mexico, just south of Bradenton. The town was founded in the late 1800s and has a population of just over 1,000 people.
History
Samoset was founded in 1887 by a group of settlers from the nearby town of Bradenton. The settlers were looking for a place to settle and start a new life. The town was named after the Samoset Indians, who were the original inhabitants of the area. The town was originally a small fishing village, but it soon grew into a larger community.
In the early 1900s, Samoset began to attract more settlers and businesses. The town was home to a number of small businesses, including a general store, a post office, a hotel, and a sawmill. The town also had a school, a church, and a library.
In the 1920s, Samoset began to experience a period of growth. The town was home to a number of new businesses, including a bank, a movie theater, and a number of restaurants. The town also had a number of tourist attractions, including a beach and a pier.
In the 1950s, Samoset began to experience a period of decline. The town was hit hard by the Great Depression and many of the businesses in the town closed. The town also experienced a number of hurricanes, which caused further damage to the town.
In the 1970s, Samoset began to experience a period of revitalization. The town was home to a number of new businesses, including a shopping center, a golf course, and a marina. The town also had a number of tourist attractions, including a beach and a pier.
Geography
Samoset is located in Manatee County, Florida. The town is situated on the Gulf of Mexico, just south of Bradenton. The town is bordered by the Manatee River to the north and the Gulf of Mexico to the south. The town is located on the western coast of Florida, just south of Tampa Bay.
The town has a total area of 1.2 square miles, all of which is land. The town is located at an elevation of 10 feet above sea level. The town has a humid subtropical climate, with hot, humid summers and mild winters.
Economy
The economy of Samoset is largely based on tourism. The town is home to a number of tourist attractions, including a beach and a pier. The town also has a number of restaurants, shops, and other businesses.
The town is also home to a number of manufacturing and industrial businesses. The town is home to a number of companies that produce a variety of products, including furniture, clothing, and electronics.
Demographics
As of the 2010 census, the population of Samoset was 1,072. The town has a population density of 890 people per square mile. The median age of the population is 44.7 years.
The racial makeup of the town is 87.3% White, 8.2% African American, 0.7% Native American, 0.7% Asian, 0.1% Pacific Islander, 1.2% from other races, and 2.0% from two or more races. The median household income in the town is $41,250.
Conclusion
Samoset, Florida is a small town located in Manatee County, Florida. It is situated on the Gulf of Mexico, just south of Bradenton. The town was founded in the late 1800s and has a population of just over 1,000 people. The town has a long history and has experienced periods of growth and decline. The economy of the town is largely based on tourism and manufacturing. The town has a population of 1,072 people, with a median age of 44.7 years. The racial makeup of the town is 87.3% White, 8.2% African American, 0.7% Native American, 0.7% Asian, 0.1% Pacific Islander, 1.2% from other races, and 2.0% from two or more races. The median household income in the town is $41,250.
Common Questions
What is Per Capita Income in Samoset?
Per Capita income in Samoset is $23,091.
What is the Median Family Income in Samoset?
Median Family Income in Samoset is $54,800.
What is the Median Household income in Samoset?
Median Household Income in Samoset is $45,188.
What is Income or Wage Gap in Samoset?
Income or Wage Gap in Samoset is 14.9%.
Women in Samoset earn 85.1 cents for every dollar earned by a man.
What is Inequality or Gini Index in Samoset?
Inequality or Gini Index in Samoset is 0.41.
What is the Total Population of Samoset?
Total Population of Samoset is 4,235.
What is the Total Male Population of Samoset?
Total Male Population of Samoset is 1,917.
What is the Total Female Population of Samoset?
Total Female Population of Samoset is 2,318.
What is the Ratio of Males per 100 Females in Samoset?
There are 82.70 Males per 100 Females in Samoset.
What is the Ratio of Females per 100 Males in Samoset?
There are 120.92 Females per 100 Males in Samoset.
What is the Median Population Age in Samoset?
Median Population Age in Samoset is 43.7 Years.
What is the Average Family Size in Samoset
Average Family Size in Samoset is 3.9 People.
What is the Average Household Size in Samoset
Average Household Size in Samoset is 3.2 People.
How Large is the Labor Force in Samoset?
There are 2,017 People in the Labor Forcein in Samoset.
What is the Percentage of People in the Labor Force in Samoset?
57.2% of People are in the Labor Force in Samoset.
What is the Unemployment Rate in Samoset?
Unemployment Rate in Samoset is 6.7%.