South American Married-couple Households
COMPARE
South American
Select to Compare
Married-couple Households
South American Married-couple Households
46.6%
MARRIED-COUPLE HOUSEHOLDS
58.0/ 100
METRIC RATING
170th/ 347
METRIC RANK
South American Married-couple Households Correlation Chart
The statistical analysis conducted on geographies consisting of 493,615,484 people shows a poor positive correlation between the proportion of South Americans and percentage of married-couple family households in the United States with a correlation coefficient (R) of 0.131 and weighted average of 46.6%. On average, for every 1% (one percent) increase in South Americans within a typical geography, there is an increase of 0.086% in percentage of married-couple family households.
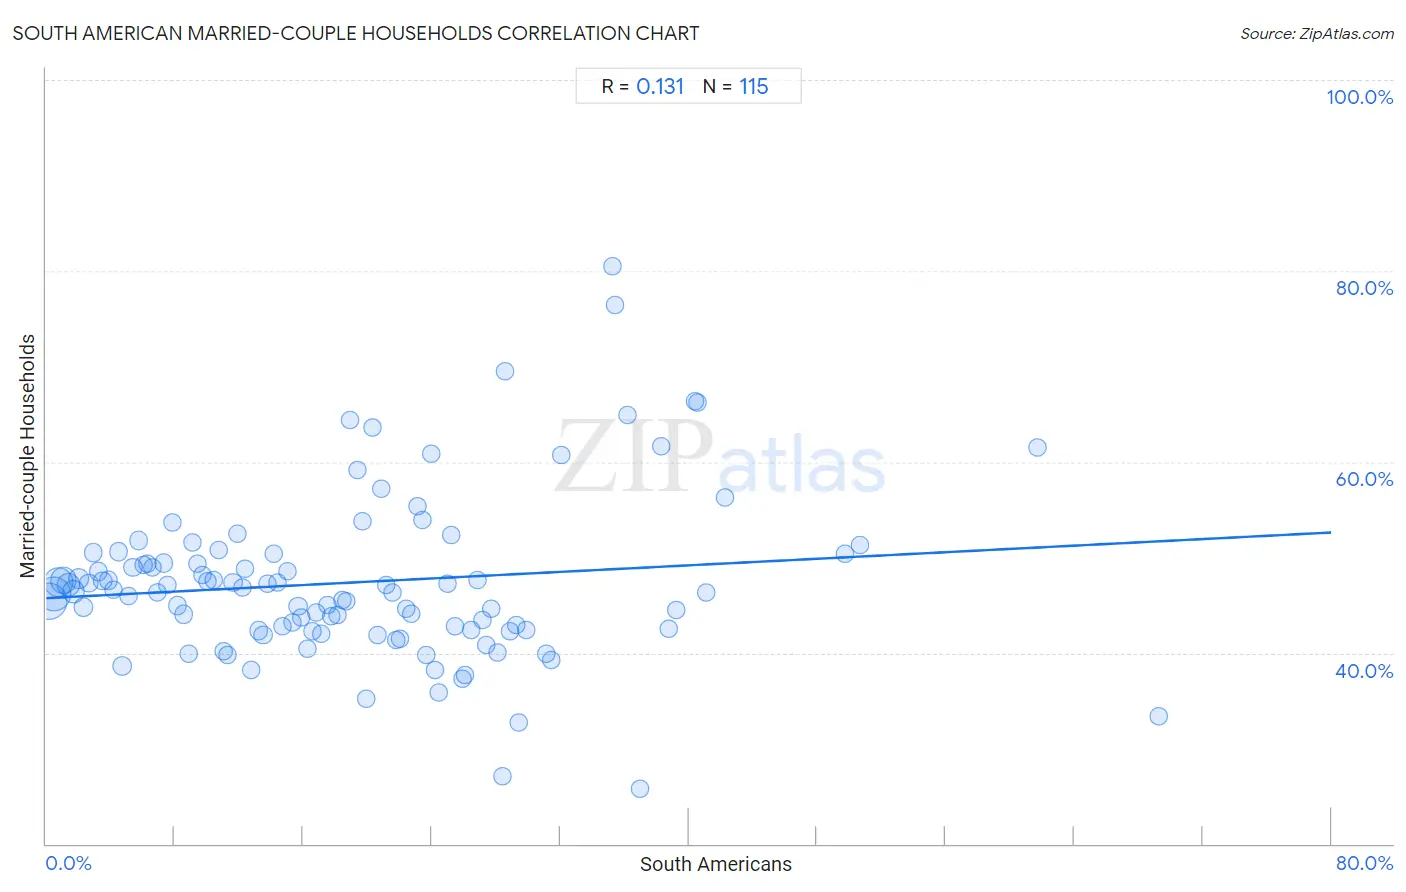
It is essential to understand that the correlation between the percentage of South Americans and percentage of married-couple family households does not imply a direct cause-and-effect relationship. It remains uncertain whether the presence of South Americans influences an upward or downward trend in the level of percentage of married-couple family households within an area, or if South Americans simply ended up residing in those areas with higher or lower levels of percentage of married-couple family households due to other factors.
Demographics Similar to South Americans by Married-couple Households
In terms of married-couple households, the demographic groups most similar to South Americans are Spanish American Indian (46.6%, a difference of 0.050%), Immigrants from Chile (46.5%, a difference of 0.090%), Immigrants from Australia (46.5%, a difference of 0.13%), Israeli (46.7%, a difference of 0.17%), and Immigrants from Norway (46.5%, a difference of 0.23%).
| Demographics | Rating | Rank | Married-couple Households |
| Immigrants from Turkey | 70.2 /100 | #163 | Good 46.8% |
| Immigrants from Kazakhstan | 70.0 /100 | #164 | Good 46.8% |
| Immigrants from Southern Europe | 69.9 /100 | #165 | Good 46.8% |
| Cherokee | 65.7 /100 | #166 | Good 46.7% |
| Immigrants from Croatia | 64.2 /100 | #167 | Good 46.7% |
| Israelis | 62.3 /100 | #168 | Good 46.7% |
| Spanish American Indians | 59.4 /100 | #169 | Average 46.6% |
| South Americans | 58.0 /100 | #170 | Average 46.6% |
| Immigrants from Chile | 55.7 /100 | #171 | Average 46.5% |
| Immigrants from Australia | 54.6 /100 | #172 | Average 46.5% |
| Immigrants from Norway | 52.0 /100 | #173 | Average 46.5% |
| Immigrants from Mexico | 50.0 /100 | #174 | Average 46.4% |
| Immigrants from Colombia | 46.1 /100 | #175 | Average 46.4% |
| Cajuns | 45.2 /100 | #176 | Average 46.4% |
| Immigrants | 43.8 /100 | #177 | Average 46.3% |
South American Married-couple Households Correlation Summary
| Measurement | South American Data | Married-couple Households Data |
| Minimum | 0.16% | 25.8% |
| Maximum | 69.3% | 80.5% |
| Range | 69.1% | 54.7% |
| Mean | 19.2% | 47.4% |
| Median | 17.8% | 46.4% |
| Interquartile 25% (IQ1) | 8.8% | 42.4% |
| Interquartile 75% (IQ3) | 26.9% | 50.4% |
| Interquartile Range (IQR) | 18.0% | 7.9% |
| Standard Deviation (Sample) | 13.2% | 8.6% |
| Standard Deviation (Population) | 13.1% | 8.6% |
Correlation Details
| South American Percentile | Sample Size | Married-couple Households |
[ 0.0% - 0.5% ] 0.16% | 114,377,526 | 45.4% |
[ 0.0% - 0.5% ] 0.46% | 97,193,567 | 46.2% |
[ 0.5% - 1.0% ] 0.76% | 72,319,591 | 47.4% |
[ 1.0% - 1.5% ] 1.08% | 49,583,312 | 47.6% |
[ 1.0% - 1.5% ] 1.39% | 34,139,428 | 47.1% |
[ 1.5% - 2.0% ] 1.70% | 26,185,182 | 46.4% |
[ 2.0% - 2.5% ] 2.01% | 16,231,675 | 47.7% |
[ 2.0% - 2.5% ] 2.30% | 11,513,903 | 44.8% |
[ 2.5% - 3.0% ] 2.62% | 7,292,106 | 47.3% |
[ 2.5% - 3.0% ] 2.94% | 6,038,786 | 50.5% |
[ 3.0% - 3.5% ] 3.24% | 4,682,538 | 48.5% |
[ 3.5% - 4.0% ] 3.54% | 5,169,328 | 47.5% |
[ 3.5% - 4.0% ] 3.87% | 3,829,895 | 47.6% |
[ 4.0% - 4.5% ] 4.18% | 2,952,084 | 46.6% |
[ 4.0% - 4.5% ] 4.49% | 2,486,830 | 50.6% |
[ 4.5% - 5.0% ] 4.75% | 11,227,673 | 38.6% |
[ 5.0% - 5.5% ] 5.12% | 2,537,098 | 46.0% |
[ 5.0% - 5.5% ] 5.40% | 1,727,989 | 49.0% |
[ 5.5% - 6.0% ] 5.72% | 1,895,498 | 51.8% |
[ 6.0% - 6.5% ] 6.03% | 1,519,406 | 49.2% |
[ 6.0% - 6.5% ] 6.32% | 1,142,128 | 49.4% |
[ 6.5% - 7.0% ] 6.63% | 904,258 | 49.0% |
[ 6.5% - 7.0% ] 6.93% | 1,423,979 | 46.3% |
[ 7.0% - 7.5% ] 7.29% | 716,763 | 49.4% |
[ 7.5% - 8.0% ] 7.56% | 852,811 | 47.1% |
[ 7.5% - 8.0% ] 7.87% | 609,744 | 53.6% |
[ 8.0% - 8.5% ] 8.17% | 730,451 | 45.0% |
[ 8.5% - 9.0% ] 8.53% | 774,739 | 44.0% |
[ 8.5% - 9.0% ] 8.85% | 460,827 | 39.8% |
[ 9.0% - 9.5% ] 9.12% | 549,828 | 51.5% |
[ 9.0% - 9.5% ] 9.43% | 766,035 | 49.4% |
[ 9.5% - 10.0% ] 9.71% | 334,092 | 48.2% |
[ 10.0% - 10.5% ] 10.03% | 521,565 | 47.5% |
[ 10.0% - 10.5% ] 10.40% | 323,377 | 47.6% |
[ 10.5% - 11.0% ] 10.71% | 353,937 | 50.8% |
[ 11.0% - 11.5% ] 11.07% | 751,448 | 40.1% |
[ 11.0% - 11.5% ] 11.29% | 201,930 | 39.8% |
[ 11.5% - 12.0% ] 11.63% | 349,117 | 47.3% |
[ 11.5% - 12.0% ] 11.89% | 690,878 | 52.5% |
[ 12.0% - 12.5% ] 12.19% | 156,662 | 46.8% |
[ 12.0% - 12.5% ] 12.41% | 280,842 | 48.8% |
[ 12.5% - 13.0% ] 12.76% | 806,796 | 38.2% |
[ 13.0% - 13.5% ] 13.20% | 407,339 | 42.3% |
[ 13.5% - 14.0% ] 13.50% | 191,017 | 41.9% |
[ 13.5% - 14.0% ] 13.76% | 441,041 | 47.2% |
[ 14.0% - 14.5% ] 14.14% | 325,908 | 50.4% |
[ 14.0% - 14.5% ] 14.42% | 221,791 | 47.3% |
[ 14.5% - 15.0% ] 14.69% | 204,687 | 42.8% |
[ 14.5% - 15.0% ] 14.99% | 234,613 | 48.6% |
[ 15.0% - 15.5% ] 15.33% | 406,294 | 43.2% |
[ 15.5% - 16.0% ] 15.68% | 266,981 | 44.8% |
[ 15.5% - 16.0% ] 15.89% | 187,486 | 43.7% |
[ 16.0% - 16.5% ] 16.26% | 312,081 | 40.4% |
[ 16.5% - 17.0% ] 16.54% | 242,654 | 42.3% |
[ 16.5% - 17.0% ] 16.83% | 150,168 | 44.2% |
[ 17.0% - 17.5% ] 17.14% | 89,321 | 42.0% |
[ 17.5% - 18.0% ] 17.51% | 20,378 | 45.0% |
[ 17.5% - 18.0% ] 17.77% | 240,694 | 43.8% |
[ 18.0% - 18.5% ] 18.10% | 85,976 | 44.0% |
[ 18.0% - 18.5% ] 18.44% | 88,154 | 45.5% |
[ 18.5% - 19.0% ] 18.69% | 40,999 | 45.4% |
[ 18.5% - 19.0% ] 18.88% | 498 | 64.4% |
[ 19.0% - 19.5% ] 19.39% | 111,443 | 59.1% |
[ 19.5% - 20.0% ] 19.70% | 85,790 | 53.8% |
[ 19.5% - 20.0% ] 19.96% | 147,206 | 35.2% |
[ 20.0% - 20.5% ] 20.33% | 22,724 | 63.5% |
[ 20.5% - 21.0% ] 20.60% | 71,060 | 41.8% |
[ 20.5% - 21.0% ] 20.84% | 158,259 | 57.2% |
[ 21.0% - 21.5% ] 21.17% | 109,891 | 47.1% |
[ 21.5% - 22.0% ] 21.54% | 31,140 | 46.3% |
[ 21.5% - 22.0% ] 21.81% | 240,484 | 41.4% |
[ 22.0% - 22.5% ] 22.04% | 57,533 | 41.5% |
[ 22.0% - 22.5% ] 22.41% | 104,960 | 44.7% |
[ 22.5% - 23.0% ] 22.72% | 10,396 | 44.1% |
[ 23.0% - 23.5% ] 23.10% | 64,260 | 55.4% |
[ 23.0% - 23.5% ] 23.39% | 174,733 | 54.0% |
[ 23.5% - 24.0% ] 23.68% | 231,078 | 39.7% |
[ 23.5% - 24.0% ] 23.96% | 59,843 | 60.8% |
[ 24.0% - 24.5% ] 24.18% | 8,904 | 38.2% |
[ 24.0% - 24.5% ] 24.47% | 94 | 35.8% |
[ 24.5% - 25.0% ] 24.95% | 20,760 | 47.3% |
[ 25.0% - 25.5% ] 25.23% | 5,164 | 52.4% |
[ 25.0% - 25.5% ] 25.42% | 101,739 | 42.7% |
[ 25.5% - 26.0% ] 25.90% | 35,967 | 37.3% |
[ 26.0% - 26.5% ] 26.05% | 56,757 | 37.7% |
[ 26.0% - 26.5% ] 26.50% | 21,935 | 42.5% |
[ 26.5% - 27.0% ] 26.89% | 89,647 | 47.7% |
[ 27.0% - 27.5% ] 27.16% | 42,956 | 43.5% |
[ 27.0% - 27.5% ] 27.42% | 44,878 | 40.9% |
[ 27.5% - 28.0% ] 27.69% | 89,577 | 44.6% |
[ 28.0% - 28.5% ] 28.08% | 67,248 | 40.1% |
[ 28.0% - 28.5% ] 28.38% | 458 | 27.1% |
[ 28.5% - 29.0% ] 28.57% | 20,971 | 69.5% |
[ 28.5% - 29.0% ] 28.90% | 80,522 | 42.3% |
[ 29.0% - 29.5% ] 29.27% | 26,364 | 42.9% |
[ 29.0% - 29.5% ] 29.41% | 22,540 | 32.7% |
[ 29.5% - 30.0% ] 29.84% | 112,750 | 42.4% |
[ 31.0% - 31.5% ] 31.13% | 11,069 | 40.0% |
[ 31.0% - 31.5% ] 31.40% | 15,732 | 39.2% |
[ 32.0% - 32.5% ] 32.05% | 2,811 | 60.7% |
[ 35.0% - 35.5% ] 35.23% | 88 | 80.5% |
[ 35.0% - 35.5% ] 35.42% | 68,029 | 76.4% |
[ 36.0% - 36.5% ] 36.16% | 31,514 | 64.9% |
[ 36.5% - 37.0% ] 36.95% | 249 | 25.8% |
[ 38.0% - 38.5% ] 38.27% | 4,656 | 61.7% |
[ 38.5% - 39.0% ] 38.73% | 1,761 | 42.5% |
[ 39.0% - 39.5% ] 39.22% | 255 | 44.4% |
[ 40.0% - 40.5% ] 40.36% | 14,639 | 66.3% |
[ 40.5% - 41.0% ] 40.54% | 14,572 | 66.2% |
[ 41.0% - 41.5% ] 41.13% | 5,843 | 46.3% |
[ 42.0% - 42.5% ] 42.26% | 6,186 | 56.2% |
[ 49.5% - 50.0% ] 49.76% | 1,873 | 50.4% |
[ 50.5% - 51.0% ] 50.63% | 2,718 | 51.3% |
[ 61.5% - 62.0% ] 61.73% | 139,642 | 61.5% |
[ 69.0% - 69.5% ] 69.30% | 114 | 33.3% |