South American Disability Age Under 5
COMPARE
South American
Select to Compare
Disability Age Under 5
South American Disability Age Under 5
1.2%
DISABILITY | AGE UNDER 5
75.6/ 100
METRIC RATING
150th/ 347
METRIC RANK
South American Disability Age Under 5 Correlation Chart
The statistical analysis conducted on geographies consisting of 248,221,421 people shows a slight negative correlation between the proportion of South Americans and percentage of population with a disability under the age of 5 in the United States with a correlation coefficient (R) of -0.055 and weighted average of 1.2%. On average, for every 1% (one percent) increase in South Americans within a typical geography, there is a decrease of 0.0057% in percentage of population with a disability under the age of 5.
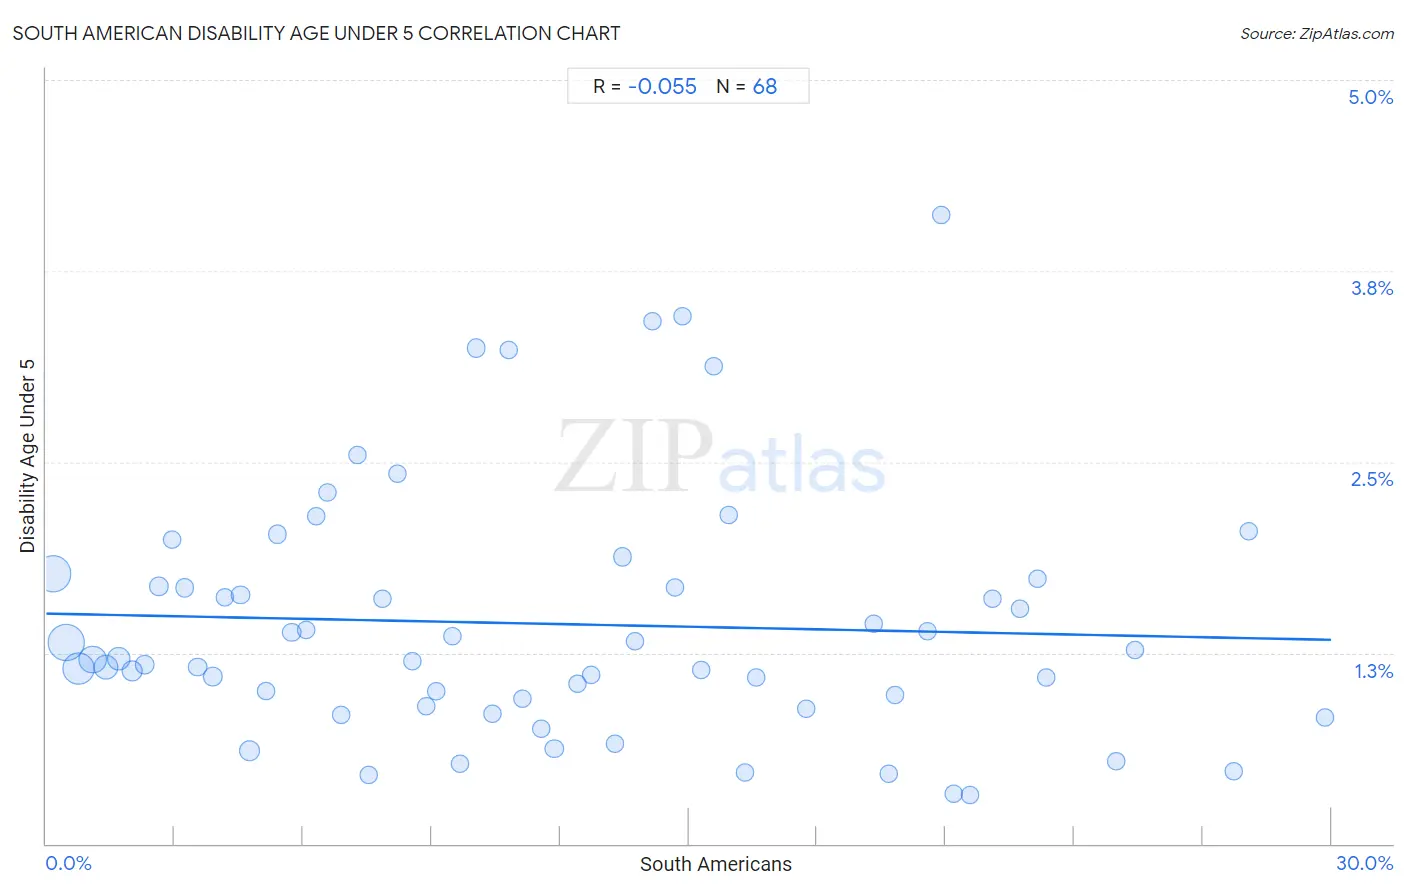
It is essential to understand that the correlation between the percentage of South Americans and percentage of population with a disability under the age of 5 does not imply a direct cause-and-effect relationship. It remains uncertain whether the presence of South Americans influences an upward or downward trend in the level of percentage of population with a disability under the age of 5 within an area, or if South Americans simply ended up residing in those areas with higher or lower levels of percentage of population with a disability under the age of 5 due to other factors.
Demographics Similar to South Americans by Disability Age Under 5
In terms of disability age under 5, the demographic groups most similar to South Americans are Kenyan (1.2%, a difference of 0.040%), Ghanaian (1.2%, a difference of 0.090%), Icelander (1.2%, a difference of 0.10%), Yaqui (1.2%, a difference of 0.10%), and Samoan (1.2%, a difference of 0.27%).
| Demographics | Rating | Rank | Disability Age Under 5 |
| Alsatians | 79.3 /100 | #143 | Good 1.2% |
| Immigrants from Middle Africa | 79.3 /100 | #144 | Good 1.2% |
| Immigrants from Zimbabwe | 77.9 /100 | #145 | Good 1.2% |
| Samoans | 77.7 /100 | #146 | Good 1.2% |
| Icelanders | 76.3 /100 | #147 | Good 1.2% |
| Ghanaians | 76.3 /100 | #148 | Good 1.2% |
| Kenyans | 75.9 /100 | #149 | Good 1.2% |
| South Americans | 75.6 /100 | #150 | Good 1.2% |
| Yaqui | 74.8 /100 | #151 | Good 1.2% |
| Hondurans | 72.5 /100 | #152 | Good 1.2% |
| Immigrants from Thailand | 69.4 /100 | #153 | Good 1.2% |
| Uruguayans | 68.8 /100 | #154 | Good 1.2% |
| Immigrants from Ghana | 68.7 /100 | #155 | Good 1.2% |
| Hawaiians | 68.5 /100 | #156 | Good 1.2% |
| Immigrants from South America | 67.0 /100 | #157 | Good 1.2% |
South American Disability Age Under 5 Correlation Summary
| Measurement | South American Data | Disability Age Under 5 Data |
| Minimum | 0.16% | 0.32% |
| Maximum | 29.8% | 4.1% |
| Range | 29.7% | 3.8% |
| Mean | 11.8% | 1.4% |
| Median | 10.6% | 1.2% |
| Interquartile 25% (IQ1) | 5.3% | 0.93% |
| Interquartile 75% (IQ3) | 17.2% | 1.7% |
| Interquartile Range (IQR) | 11.9% | 0.78% |
| Standard Deviation (Sample) | 7.9% | 0.81% |
| Standard Deviation (Population) | 7.8% | 0.81% |
Correlation Details
| South American Percentile | Sample Size | Disability Age Under 5 |
[ 0.0% - 0.5% ] 0.16% | 51,468,971 | 1.8% |
[ 0.0% - 0.5% ] 0.46% | 51,585,479 | 1.3% |
[ 0.5% - 1.0% ] 0.75% | 38,948,501 | 1.1% |
[ 1.0% - 1.5% ] 1.08% | 26,561,133 | 1.2% |
[ 1.0% - 1.5% ] 1.39% | 19,026,592 | 1.2% |
[ 1.5% - 2.0% ] 1.70% | 13,876,688 | 1.2% |
[ 2.0% - 2.5% ] 2.01% | 8,810,673 | 1.1% |
[ 2.0% - 2.5% ] 2.30% | 5,134,694 | 1.2% |
[ 2.5% - 3.0% ] 2.62% | 2,789,413 | 1.7% |
[ 2.5% - 3.0% ] 2.94% | 2,244,536 | 2.0% |
[ 3.0% - 3.5% ] 3.23% | 1,640,780 | 1.7% |
[ 3.5% - 4.0% ] 3.53% | 2,546,011 | 1.2% |
[ 3.5% - 4.0% ] 3.89% | 1,626,065 | 1.1% |
[ 4.0% - 4.5% ] 4.17% | 978,005 | 1.6% |
[ 4.5% - 5.0% ] 4.54% | 707,928 | 1.6% |
[ 4.5% - 5.0% ] 4.74% | 9,502,476 | 0.61% |
[ 5.0% - 5.5% ] 5.14% | 1,094,129 | 1.00% |
[ 5.0% - 5.5% ] 5.39% | 694,736 | 2.0% |
[ 5.5% - 6.0% ] 5.73% | 917,887 | 1.4% |
[ 6.0% - 6.5% ] 6.06% | 488,737 | 1.4% |
[ 6.0% - 6.5% ] 6.31% | 255,999 | 2.1% |
[ 6.5% - 7.0% ] 6.57% | 228,504 | 2.3% |
[ 6.5% - 7.0% ] 6.89% | 537,251 | 0.84% |
[ 7.0% - 7.5% ] 7.25% | 215,560 | 2.5% |
[ 7.5% - 8.0% ] 7.52% | 326,474 | 0.45% |
[ 7.5% - 8.0% ] 7.84% | 71,353 | 1.6% |
[ 8.0% - 8.5% ] 8.19% | 292,547 | 2.4% |
[ 8.5% - 9.0% ] 8.54% | 512,803 | 1.2% |
[ 8.5% - 9.0% ] 8.87% | 181,256 | 0.90% |
[ 9.0% - 9.5% ] 9.11% | 132,497 | 1.00% |
[ 9.0% - 9.5% ] 9.48% | 432,525 | 1.4% |
[ 9.5% - 10.0% ] 9.67% | 142,514 | 0.52% |
[ 10.0% - 10.5% ] 10.03% | 198,764 | 3.2% |
[ 10.0% - 10.5% ] 10.41% | 145,860 | 0.85% |
[ 10.5% - 11.0% ] 10.80% | 84,478 | 3.2% |
[ 11.0% - 11.5% ] 11.12% | 372,864 | 0.95% |
[ 11.5% - 12.0% ] 11.56% | 92,436 | 0.76% |
[ 11.5% - 12.0% ] 11.86% | 396,262 | 0.62% |
[ 12.0% - 12.5% ] 12.39% | 140,730 | 1.1% |
[ 12.5% - 13.0% ] 12.72% | 537,421 | 1.1% |
[ 13.0% - 13.5% ] 13.29% | 157,864 | 0.65% |
[ 13.0% - 13.5% ] 13.44% | 107,607 | 1.9% |
[ 13.5% - 14.0% ] 13.74% | 215,277 | 1.3% |
[ 14.0% - 14.5% ] 14.16% | 36,139 | 3.4% |
[ 14.5% - 15.0% ] 14.68% | 141,816 | 1.7% |
[ 14.5% - 15.0% ] 14.86% | 33,691 | 3.5% |
[ 15.0% - 15.5% ] 15.30% | 193,866 | 1.1% |
[ 15.5% - 16.0% ] 15.59% | 37,958 | 3.1% |
[ 15.5% - 16.0% ] 15.95% | 102,548 | 2.2% |
[ 16.0% - 16.5% ] 16.30% | 149,414 | 0.47% |
[ 16.5% - 17.0% ] 16.56% | 151,026 | 1.1% |
[ 17.5% - 18.0% ] 17.74% | 142,681 | 0.88% |
[ 19.0% - 19.5% ] 19.32% | 42,693 | 1.4% |
[ 19.5% - 20.0% ] 19.68% | 48,762 | 0.46% |
[ 19.5% - 20.0% ] 19.83% | 41,907 | 0.97% |
[ 20.5% - 21.0% ] 20.58% | 54,464 | 1.4% |
[ 20.5% - 21.0% ] 20.90% | 83,560 | 4.1% |
[ 21.0% - 21.5% ] 21.18% | 102,618 | 0.33% |
[ 21.5% - 22.0% ] 21.58% | 26,548 | 0.32% |
[ 22.0% - 22.5% ] 22.10% | 25,283 | 1.6% |
[ 22.5% - 23.0% ] 22.72% | 10,396 | 1.5% |
[ 23.0% - 23.5% ] 23.14% | 19,625 | 1.7% |
[ 23.0% - 23.5% ] 23.34% | 42,207 | 1.1% |
[ 24.5% - 25.0% ] 24.97% | 18,426 | 0.54% |
[ 25.0% - 25.5% ] 25.43% | 57,066 | 1.3% |
[ 27.5% - 28.0% ] 27.72% | 56,696 | 0.48% |
[ 28.0% - 28.5% ] 28.08% | 67,001 | 2.0% |
[ 29.5% - 30.0% ] 29.84% | 112,750 | 0.82% |