South American vs African Disability Age 5 to 17
COMPARE
South American
African
Disability Age 5 to 17
Disability Age 5 to 17 Comparison
South Americans
Africans
5.4%
DISABILITY AGE 5 TO 17
97.1/ 100
METRIC RATING
118th/ 347
METRIC RANK
6.5%
DISABILITY AGE 5 TO 17
0.0/ 100
METRIC RATING
320th/ 347
METRIC RANK
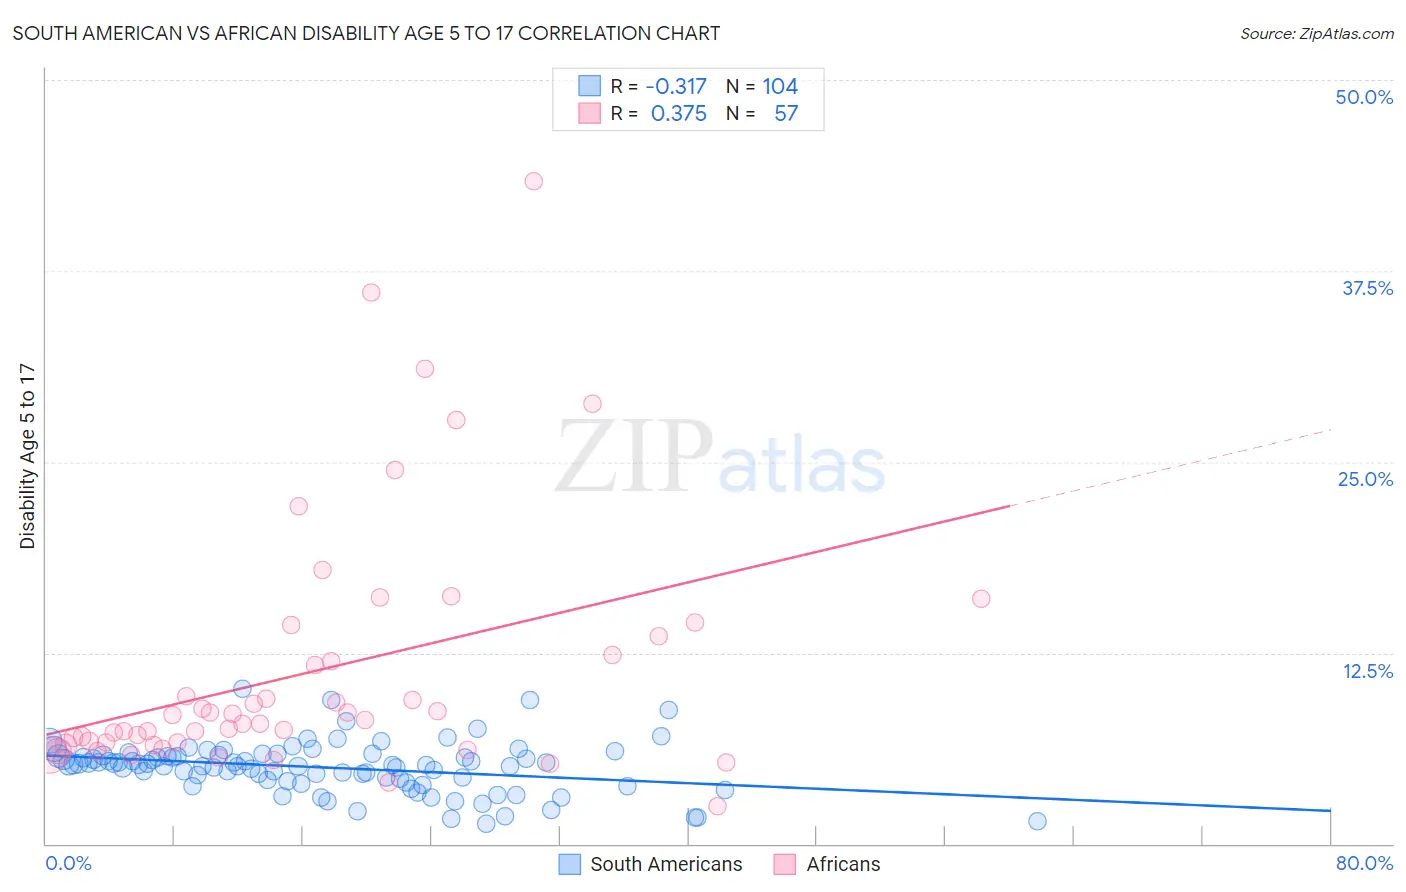
South American vs African Disability Age 5 to 17 Correlation Chart
The statistical analysis conducted on geographies consisting of 487,738,327 people shows a mild negative correlation between the proportion of South Americans and percentage of population with a disability between the ages 5 and 17 in the United States with a correlation coefficient (R) of -0.317 and weighted average of 5.4%. Similarly, the statistical analysis conducted on geographies consisting of 465,699,763 people shows a mild positive correlation between the proportion of Africans and percentage of population with a disability between the ages 5 and 17 in the United States with a correlation coefficient (R) of 0.375 and weighted average of 6.5%, a difference of 21.2%.
Disability Age 5 to 17 Correlation Summary
| Measurement | South American | African |
| Minimum | 1.3% | 2.5% |
| Maximum | 10.1% | 43.3% |
| Range | 8.8% | 40.9% |
| Mean | 5.0% | 11.3% |
| Median | 5.2% | 8.1% |
| Interquartile 25% (IQ1) | 4.1% | 6.5% |
| Interquartile 75% (IQ3) | 5.8% | 13.0% |
| Interquartile Range (IQR) | 1.7% | 6.5% |
| Standard Deviation (Sample) | 1.6% | 8.3% |
| Standard Deviation (Population) | 1.6% | 8.2% |
Similar Demographics by Disability Age 5 to 17
Demographics Similar to South Americans by Disability Age 5 to 17
In terms of disability age 5 to 17, the demographic groups most similar to South Americans are Immigrants from South America (5.4%, a difference of 0.010%), Immigrants (5.4%, a difference of 0.060%), Immigrants from Afghanistan (5.3%, a difference of 0.11%), Cypriot (5.3%, a difference of 0.27%), and Cuban (5.3%, a difference of 0.33%).
| Demographics | Rating | Rank | Disability Age 5 to 17 |
| Ethiopians | 97.9 /100 | #111 | Exceptional 5.3% |
| Immigrants | Latvia | 97.9 /100 | #112 | Exceptional 5.3% |
| Aleuts | 97.8 /100 | #113 | Exceptional 5.3% |
| Immigrants | Northern Europe | 97.8 /100 | #114 | Exceptional 5.3% |
| Cubans | 97.8 /100 | #115 | Exceptional 5.3% |
| Cypriots | 97.7 /100 | #116 | Exceptional 5.3% |
| Immigrants | Afghanistan | 97.4 /100 | #117 | Exceptional 5.3% |
| South Americans | 97.1 /100 | #118 | Exceptional 5.4% |
| Immigrants | South America | 97.1 /100 | #119 | Exceptional 5.4% |
| Immigrants | Immigrants | 97.0 /100 | #120 | Exceptional 5.4% |
| Maltese | 96.0 /100 | #121 | Exceptional 5.4% |
| Chileans | 95.8 /100 | #122 | Exceptional 5.4% |
| Immigrants | Ethiopia | 95.5 /100 | #123 | Exceptional 5.4% |
| Crow | 95.0 /100 | #124 | Exceptional 5.4% |
| Immigrants | Chile | 95.0 /100 | #125 | Exceptional 5.4% |
Demographics Similar to Africans by Disability Age 5 to 17
In terms of disability age 5 to 17, the demographic groups most similar to Africans are Delaware (6.5%, a difference of 0.19%), Tohono O'odham (6.5%, a difference of 0.35%), Slovak (6.5%, a difference of 0.36%), Osage (6.5%, a difference of 0.40%), and Dominican (6.5%, a difference of 0.48%).
| Demographics | Rating | Rank | Disability Age 5 to 17 |
| Apache | 0.0 /100 | #313 | Tragic 6.4% |
| French | 0.0 /100 | #314 | Tragic 6.4% |
| Immigrants | Portugal | 0.0 /100 | #315 | Tragic 6.4% |
| Immigrants | Dominican Republic | 0.0 /100 | #316 | Tragic 6.4% |
| Kiowa | 0.0 /100 | #317 | Tragic 6.4% |
| Comanche | 0.0 /100 | #318 | Tragic 6.4% |
| Delaware | 0.0 /100 | #319 | Tragic 6.5% |
| Africans | 0.0 /100 | #320 | Tragic 6.5% |
| Tohono O'odham | 0.0 /100 | #321 | Tragic 6.5% |
| Slovaks | 0.0 /100 | #322 | Tragic 6.5% |
| Osage | 0.0 /100 | #323 | Tragic 6.5% |
| Dominicans | 0.0 /100 | #324 | Tragic 6.5% |
| Americans | 0.0 /100 | #325 | Tragic 6.5% |
| Potawatomi | 0.0 /100 | #326 | Tragic 6.5% |
| French American Indians | 0.0 /100 | #327 | Tragic 6.6% |