South American College, Under 1 year
COMPARE
South American
Select to Compare
College, Under 1 year
South American College, Under 1 year
64.2%
COLLEGE, UNDER 1 YEAR
16.2/ 100
METRIC RATING
202nd/ 347
METRIC RANK
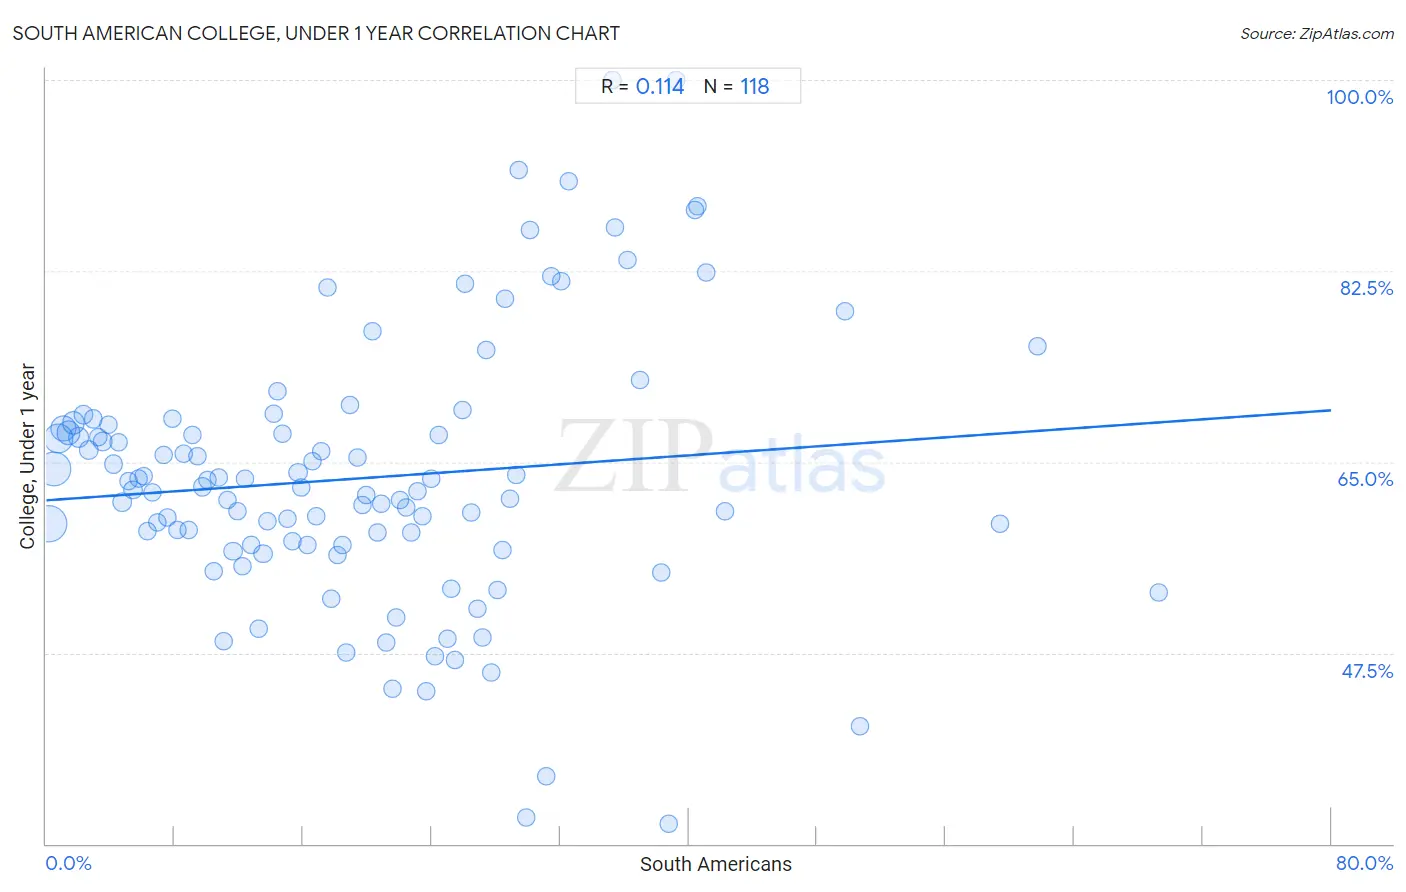
South American College, Under 1 year Correlation Chart
The statistical analysis conducted on geographies consisting of 494,173,553 people shows a poor positive correlation between the proportion of South Americans and percentage of population with at least college, under 1 year education in the United States with a correlation coefficient (R) of 0.114 and weighted average of 64.2%. On average, for every 1% (one percent) increase in South Americans within a typical geography, there is an increase of 0.10% in percentage of population with at least college, under 1 year education.
It is essential to understand that the correlation between the percentage of South Americans and percentage of population with at least college, under 1 year education does not imply a direct cause-and-effect relationship. It remains uncertain whether the presence of South Americans influences an upward or downward trend in the level of percentage of population with at least college, under 1 year education within an area, or if South Americans simply ended up residing in those areas with higher or lower levels of percentage of population with at least college, under 1 year education due to other factors.
Demographics Similar to South Americans by College, Under 1 year
In terms of college, under 1 year, the demographic groups most similar to South Americans are French Canadian (64.2%, a difference of 0.010%), Nigerian (64.3%, a difference of 0.040%), Uruguayan (64.2%, a difference of 0.050%), Panamanian (64.3%, a difference of 0.070%), and Tsimshian (64.3%, a difference of 0.13%).
| Demographics | Rating | Rank | College, Under 1 year |
| Immigrants from South Eastern Asia | 22.1 /100 | #195 | Fair 64.5% |
| Tongans | 21.2 /100 | #196 | Fair 64.5% |
| Costa Ricans | 19.6 /100 | #197 | Poor 64.4% |
| Tsimshian | 17.9 /100 | #198 | Poor 64.3% |
| Panamanians | 17.0 /100 | #199 | Poor 64.3% |
| Nigerians | 16.7 /100 | #200 | Poor 64.3% |
| French Canadians | 16.3 /100 | #201 | Poor 64.2% |
| South Americans | 16.2 /100 | #202 | Poor 64.2% |
| Uruguayans | 15.6 /100 | #203 | Poor 64.2% |
| Immigrants from Zaire | 14.6 /100 | #204 | Poor 64.1% |
| Peruvians | 13.7 /100 | #205 | Poor 64.1% |
| Whites/Caucasians | 12.8 /100 | #206 | Poor 64.0% |
| Colombians | 12.4 /100 | #207 | Poor 64.0% |
| Immigrants from Vietnam | 12.1 /100 | #208 | Poor 64.0% |
| Puget Sound Salish | 11.3 /100 | #209 | Poor 63.9% |
South American College, Under 1 year Correlation Summary
| Measurement | South American Data | College, Under 1 year Data |
| Minimum | 0.16% | 31.8% |
| Maximum | 69.3% | 100.0% |
| Range | 69.1% | 68.2% |
| Mean | 19.7% | 63.5% |
| Median | 18.3% | 62.6% |
| Interquartile 25% (IQ1) | 9.1% | 57.4% |
| Interquartile 75% (IQ3) | 27.4% | 68.1% |
| Interquartile Range (IQR) | 18.3% | 10.7% |
| Standard Deviation (Sample) | 13.6% | 12.3% |
| Standard Deviation (Population) | 13.6% | 12.3% |
Correlation Details
| South American Percentile | Sample Size | College, Under 1 year |
[ 0.0% - 0.5% ] 0.16% | 114,447,929 | 59.4% |
[ 0.0% - 0.5% ] 0.46% | 97,296,471 | 64.3% |
[ 0.5% - 1.0% ] 0.76% | 72,405,333 | 67.2% |
[ 1.0% - 1.5% ] 1.08% | 49,645,522 | 68.1% |
[ 1.0% - 1.5% ] 1.39% | 34,165,506 | 67.7% |
[ 1.5% - 2.0% ] 1.70% | 26,239,032 | 68.6% |
[ 2.0% - 2.5% ] 2.01% | 16,257,967 | 67.2% |
[ 2.0% - 2.5% ] 2.30% | 11,544,324 | 69.3% |
[ 2.5% - 3.0% ] 2.62% | 7,296,979 | 66.1% |
[ 2.5% - 3.0% ] 2.94% | 6,048,723 | 68.9% |
[ 3.0% - 3.5% ] 3.24% | 4,685,903 | 67.3% |
[ 3.5% - 4.0% ] 3.54% | 5,191,180 | 66.8% |
[ 3.5% - 4.0% ] 3.87% | 3,833,292 | 68.4% |
[ 4.0% - 4.5% ] 4.18% | 2,957,035 | 64.8% |
[ 4.0% - 4.5% ] 4.49% | 2,494,130 | 66.8% |
[ 4.5% - 5.0% ] 4.75% | 11,231,311 | 61.3% |
[ 5.0% - 5.5% ] 5.12% | 2,537,098 | 63.2% |
[ 5.0% - 5.5% ] 5.39% | 1,736,784 | 62.5% |
[ 5.5% - 6.0% ] 5.72% | 1,898,655 | 63.5% |
[ 6.0% - 6.5% ] 6.03% | 1,519,406 | 63.7% |
[ 6.0% - 6.5% ] 6.32% | 1,142,128 | 58.7% |
[ 6.5% - 7.0% ] 6.63% | 906,722 | 62.2% |
[ 6.5% - 7.0% ] 6.93% | 1,424,155 | 59.4% |
[ 7.0% - 7.5% ] 7.29% | 716,763 | 65.6% |
[ 7.5% - 8.0% ] 7.56% | 854,075 | 59.9% |
[ 7.5% - 8.0% ] 7.87% | 609,820 | 69.0% |
[ 8.0% - 8.5% ] 8.17% | 730,414 | 58.7% |
[ 8.5% - 9.0% ] 8.53% | 774,739 | 65.7% |
[ 8.5% - 9.0% ] 8.85% | 460,827 | 58.7% |
[ 9.0% - 9.5% ] 9.12% | 549,828 | 67.4% |
[ 9.0% - 9.5% ] 9.43% | 766,320 | 65.5% |
[ 9.5% - 10.0% ] 9.71% | 334,092 | 62.7% |
[ 10.0% - 10.5% ] 10.03% | 521,565 | 63.4% |
[ 10.0% - 10.5% ] 10.40% | 323,377 | 55.0% |
[ 10.5% - 11.0% ] 10.71% | 354,396 | 63.5% |
[ 11.0% - 11.5% ] 11.07% | 751,448 | 48.6% |
[ 11.0% - 11.5% ] 11.29% | 201,930 | 61.5% |
[ 11.5% - 12.0% ] 11.63% | 349,117 | 56.8% |
[ 11.5% - 12.0% ] 11.89% | 690,878 | 60.5% |
[ 12.0% - 12.5% ] 12.19% | 156,662 | 55.5% |
[ 12.0% - 12.5% ] 12.41% | 280,842 | 63.4% |
[ 12.5% - 13.0% ] 12.76% | 806,796 | 57.4% |
[ 13.0% - 13.5% ] 13.20% | 407,339 | 49.8% |
[ 13.5% - 14.0% ] 13.50% | 191,017 | 56.6% |
[ 13.5% - 14.0% ] 13.76% | 441,449 | 59.6% |
[ 14.0% - 14.5% ] 14.14% | 325,908 | 69.4% |
[ 14.0% - 14.5% ] 14.42% | 221,791 | 71.5% |
[ 14.5% - 15.0% ] 14.69% | 204,687 | 67.6% |
[ 14.5% - 15.0% ] 14.99% | 234,613 | 59.8% |
[ 15.0% - 15.5% ] 15.33% | 406,294 | 57.8% |
[ 15.5% - 16.0% ] 15.68% | 266,981 | 64.0% |
[ 15.5% - 16.0% ] 15.89% | 187,486 | 62.7% |
[ 16.0% - 16.5% ] 16.26% | 312,081 | 57.3% |
[ 16.5% - 17.0% ] 16.54% | 242,654 | 65.1% |
[ 16.5% - 17.0% ] 16.83% | 150,168 | 60.0% |
[ 17.0% - 17.5% ] 17.14% | 89,321 | 66.0% |
[ 17.5% - 18.0% ] 17.51% | 20,378 | 81.0% |
[ 17.5% - 18.0% ] 17.77% | 240,694 | 52.4% |
[ 18.0% - 18.5% ] 18.10% | 85,976 | 56.5% |
[ 18.0% - 18.5% ] 18.44% | 88,154 | 57.4% |
[ 18.5% - 19.0% ] 18.69% | 40,999 | 47.5% |
[ 18.5% - 19.0% ] 18.88% | 498 | 70.2% |
[ 19.0% - 19.5% ] 19.39% | 111,443 | 65.5% |
[ 19.5% - 20.0% ] 19.70% | 85,790 | 61.0% |
[ 19.5% - 20.0% ] 19.96% | 147,206 | 61.9% |
[ 20.0% - 20.5% ] 20.33% | 22,724 | 77.0% |
[ 20.5% - 21.0% ] 20.60% | 71,060 | 58.5% |
[ 20.5% - 21.0% ] 20.84% | 158,259 | 61.2% |
[ 21.0% - 21.5% ] 21.17% | 109,891 | 48.4% |
[ 21.5% - 22.0% ] 21.54% | 31,140 | 44.2% |
[ 21.5% - 22.0% ] 21.81% | 240,484 | 50.7% |
[ 22.0% - 22.5% ] 22.04% | 57,533 | 61.5% |
[ 22.0% - 22.5% ] 22.41% | 104,960 | 60.8% |
[ 22.5% - 23.0% ] 22.72% | 10,396 | 58.6% |
[ 23.0% - 23.5% ] 23.10% | 64,260 | 62.3% |
[ 23.0% - 23.5% ] 23.39% | 174,733 | 60.1% |
[ 23.5% - 24.0% ] 23.68% | 231,078 | 44.0% |
[ 23.5% - 24.0% ] 23.96% | 59,843 | 63.4% |
[ 24.0% - 24.5% ] 24.18% | 8,904 | 47.1% |
[ 24.0% - 24.5% ] 24.47% | 94 | 67.5% |
[ 24.5% - 25.0% ] 24.95% | 20,760 | 48.8% |
[ 25.0% - 25.5% ] 25.23% | 5,164 | 53.3% |
[ 25.0% - 25.5% ] 25.42% | 101,739 | 46.8% |
[ 25.5% - 26.0% ] 25.90% | 35,967 | 69.7% |
[ 26.0% - 26.5% ] 26.05% | 56,757 | 81.3% |
[ 26.0% - 26.5% ] 26.50% | 21,935 | 60.4% |
[ 26.5% - 27.0% ] 26.89% | 89,647 | 51.6% |
[ 27.0% - 27.5% ] 27.16% | 42,956 | 48.9% |
[ 27.0% - 27.5% ] 27.42% | 44,878 | 75.3% |
[ 27.5% - 28.0% ] 27.69% | 89,577 | 45.7% |
[ 28.0% - 28.5% ] 28.08% | 67,248 | 53.3% |
[ 28.0% - 28.5% ] 28.38% | 458 | 57.0% |
[ 28.5% - 29.0% ] 28.57% | 20,971 | 79.9% |
[ 28.5% - 29.0% ] 28.90% | 80,522 | 61.7% |
[ 29.0% - 29.5% ] 29.27% | 26,364 | 63.8% |
[ 29.0% - 29.5% ] 29.41% | 22,540 | 91.7% |
[ 29.5% - 30.0% ] 29.84% | 112,750 | 32.4% |
[ 30.0% - 30.5% ] 30.10% | 23,734 | 86.2% |
[ 31.0% - 31.5% ] 31.13% | 11,069 | 36.2% |
[ 31.0% - 31.5% ] 31.40% | 15,732 | 82.1% |
[ 32.0% - 32.5% ] 32.05% | 2,811 | 81.6% |
[ 32.5% - 33.0% ] 32.56% | 43 | 90.7% |
[ 35.0% - 35.5% ] 35.23% | 88 | 100.0% |
[ 35.0% - 35.5% ] 35.42% | 68,029 | 86.5% |
[ 36.0% - 36.5% ] 36.16% | 31,514 | 83.5% |
[ 36.5% - 37.0% ] 36.95% | 249 | 72.5% |
[ 38.0% - 38.5% ] 38.27% | 4,656 | 54.9% |
[ 38.5% - 39.0% ] 38.73% | 1,761 | 31.8% |
[ 39.0% - 39.5% ] 39.22% | 255 | 100.0% |
[ 40.0% - 40.5% ] 40.36% | 14,639 | 88.1% |
[ 40.5% - 41.0% ] 40.54% | 14,572 | 88.4% |
[ 41.0% - 41.5% ] 41.13% | 5,843 | 82.3% |
[ 42.0% - 42.5% ] 42.26% | 6,186 | 60.5% |
[ 49.5% - 50.0% ] 49.76% | 1,873 | 78.8% |
[ 50.5% - 51.0% ] 50.63% | 2,718 | 40.8% |
[ 59.0% - 59.5% ] 59.38% | 32 | 59.4% |
[ 61.5% - 62.0% ] 61.73% | 139,642 | 75.6% |
[ 69.0% - 69.5% ] 69.30% | 114 | 53.0% |