Malaysian vs Native Hawaiian Disability Age 5 to 17
COMPARE
Malaysian
Native Hawaiian
Disability Age 5 to 17
Disability Age 5 to 17 Comparison
Malaysians
Native Hawaiians
5.8%
DISABILITY AGE 5 TO 17
3.4/ 100
METRIC RATING
235th/ 347
METRIC RANK
5.2%
DISABILITY AGE 5 TO 17
99.6/ 100
METRIC RATING
81st/ 347
METRIC RANK
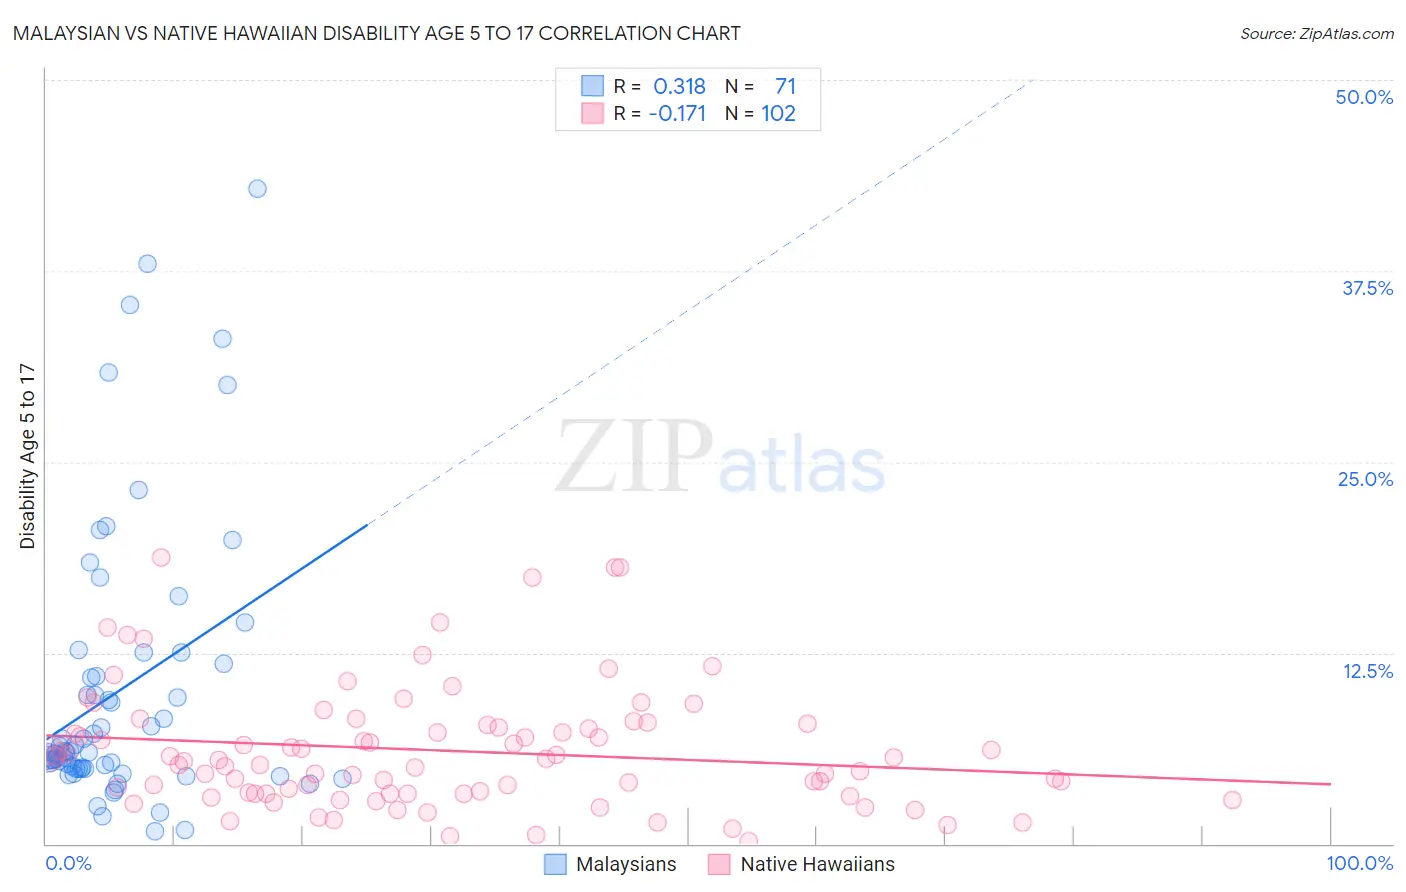
Malaysian vs Native Hawaiian Disability Age 5 to 17 Correlation Chart
The statistical analysis conducted on geographies consisting of 225,304,568 people shows a mild positive correlation between the proportion of Malaysians and percentage of population with a disability between the ages 5 and 17 in the United States with a correlation coefficient (R) of 0.318 and weighted average of 5.8%. Similarly, the statistical analysis conducted on geographies consisting of 329,860,359 people shows a poor negative correlation between the proportion of Native Hawaiians and percentage of population with a disability between the ages 5 and 17 in the United States with a correlation coefficient (R) of -0.171 and weighted average of 5.2%, a difference of 11.6%.
Disability Age 5 to 17 Correlation Summary
| Measurement | Malaysian | Native Hawaiian |
| Minimum | 0.84% | 0.15% |
| Maximum | 42.9% | 18.7% |
| Range | 42.0% | 18.6% |
| Mean | 10.0% | 6.1% |
| Median | 6.0% | 5.4% |
| Interquartile 25% (IQ1) | 4.9% | 3.3% |
| Interquartile 75% (IQ3) | 11.8% | 7.8% |
| Interquartile Range (IQR) | 6.9% | 4.5% |
| Standard Deviation (Sample) | 9.1% | 4.0% |
| Standard Deviation (Population) | 9.1% | 4.0% |
Similar Demographics by Disability Age 5 to 17
Demographics Similar to Malaysians by Disability Age 5 to 17
In terms of disability age 5 to 17, the demographic groups most similar to Malaysians are Immigrants from Kenya (5.8%, a difference of 0.010%), Immigrants from West Indies (5.8%, a difference of 0.050%), Immigrants from Brazil (5.8%, a difference of 0.060%), Immigrants from Laos (5.8%, a difference of 0.14%), and Sudanese (5.8%, a difference of 0.21%).
| Demographics | Rating | Rank | Disability Age 5 to 17 |
| Haitians | 4.8 /100 | #228 | Tragic 5.8% |
| Bangladeshis | 4.8 /100 | #229 | Tragic 5.8% |
| Ghanaians | 4.7 /100 | #230 | Tragic 5.8% |
| Europeans | 4.5 /100 | #231 | Tragic 5.8% |
| Immigrants | Laos | 3.8 /100 | #232 | Tragic 5.8% |
| Immigrants | West Indies | 3.5 /100 | #233 | Tragic 5.8% |
| Immigrants | Kenya | 3.4 /100 | #234 | Tragic 5.8% |
| Malaysians | 3.4 /100 | #235 | Tragic 5.8% |
| Immigrants | Brazil | 3.2 /100 | #236 | Tragic 5.8% |
| Sudanese | 2.9 /100 | #237 | Tragic 5.8% |
| Hungarians | 2.6 /100 | #238 | Tragic 5.8% |
| German Russians | 2.4 /100 | #239 | Tragic 5.9% |
| West Indians | 2.4 /100 | #240 | Tragic 5.9% |
| Immigrants | Caribbean | 2.1 /100 | #241 | Tragic 5.9% |
| Spaniards | 2.0 /100 | #242 | Tragic 5.9% |
Demographics Similar to Native Hawaiians by Disability Age 5 to 17
In terms of disability age 5 to 17, the demographic groups most similar to Native Hawaiians are Sri Lankan (5.2%, a difference of 0.040%), Afghan (5.2%, a difference of 0.070%), Immigrants from Cuba (5.2%, a difference of 0.10%), Immigrants from Kazakhstan (5.2%, a difference of 0.11%), and Immigrants from Sweden (5.2%, a difference of 0.11%).
| Demographics | Rating | Rank | Disability Age 5 to 17 |
| Immigrants | Romania | 99.7 /100 | #74 | Exceptional 5.2% |
| Immigrants | Moldova | 99.6 /100 | #75 | Exceptional 5.2% |
| Immigrants | Guyana | 99.6 /100 | #76 | Exceptional 5.2% |
| Immigrants | Kazakhstan | 99.6 /100 | #77 | Exceptional 5.2% |
| Immigrants | Cuba | 99.6 /100 | #78 | Exceptional 5.2% |
| Afghans | 99.6 /100 | #79 | Exceptional 5.2% |
| Sri Lankans | 99.6 /100 | #80 | Exceptional 5.2% |
| Native Hawaiians | 99.6 /100 | #81 | Exceptional 5.2% |
| Immigrants | Sweden | 99.5 /100 | #82 | Exceptional 5.2% |
| Immigrants | France | 99.5 /100 | #83 | Exceptional 5.2% |
| Immigrants | Nicaragua | 99.5 /100 | #84 | Exceptional 5.2% |
| Bulgarians | 99.4 /100 | #85 | Exceptional 5.2% |
| Immigrants | St. Vincent and the Grenadines | 99.4 /100 | #86 | Exceptional 5.2% |
| Eastern Europeans | 99.4 /100 | #87 | Exceptional 5.2% |
| Immigrants | Croatia | 99.4 /100 | #88 | Exceptional 5.2% |