Malaysian vs Native/Alaskan Disability Age 5 to 17
COMPARE
Malaysian
Native/Alaskan
Disability Age 5 to 17
Disability Age 5 to 17 Comparison
Malaysians
Natives/Alaskans
5.8%
DISABILITY AGE 5 TO 17
3.4/ 100
METRIC RATING
235th/ 347
METRIC RANK
6.3%
DISABILITY AGE 5 TO 17
0.0/ 100
METRIC RATING
305th/ 347
METRIC RANK
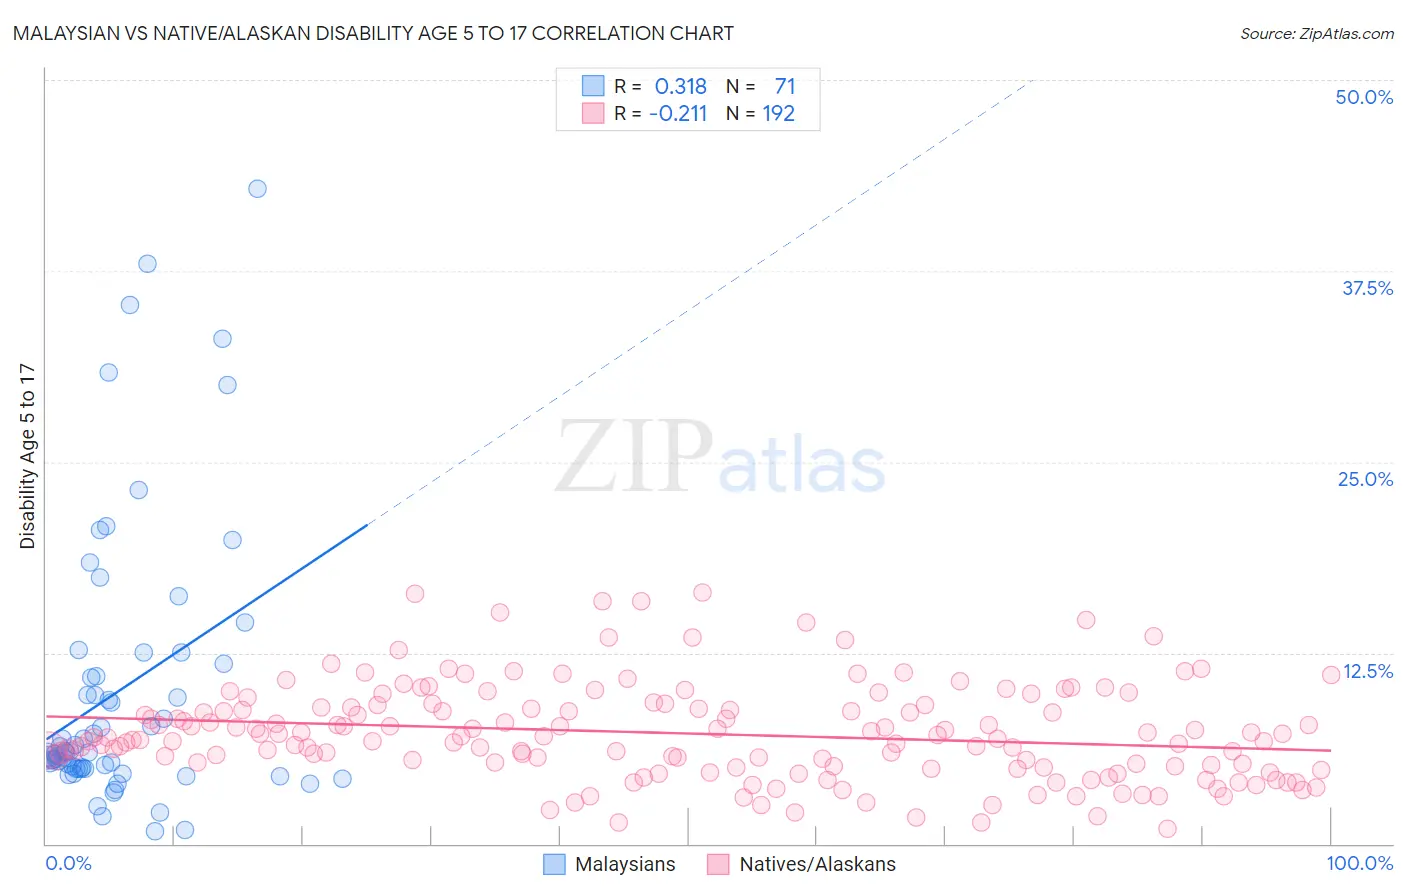
Malaysian vs Native/Alaskan Disability Age 5 to 17 Correlation Chart
The statistical analysis conducted on geographies consisting of 225,304,568 people shows a mild positive correlation between the proportion of Malaysians and percentage of population with a disability between the ages 5 and 17 in the United States with a correlation coefficient (R) of 0.318 and weighted average of 5.8%. Similarly, the statistical analysis conducted on geographies consisting of 506,009,662 people shows a weak negative correlation between the proportion of Natives/Alaskans and percentage of population with a disability between the ages 5 and 17 in the United States with a correlation coefficient (R) of -0.211 and weighted average of 6.3%, a difference of 8.1%.
Disability Age 5 to 17 Correlation Summary
| Measurement | Malaysian | Native/Alaskan |
| Minimum | 0.84% | 1.0% |
| Maximum | 42.9% | 16.4% |
| Range | 42.0% | 15.4% |
| Mean | 10.0% | 7.2% |
| Median | 6.0% | 6.9% |
| Interquartile 25% (IQ1) | 4.9% | 5.1% |
| Interquartile 75% (IQ3) | 11.8% | 8.9% |
| Interquartile Range (IQR) | 6.9% | 3.8% |
| Standard Deviation (Sample) | 9.1% | 3.1% |
| Standard Deviation (Population) | 9.1% | 3.1% |
Similar Demographics by Disability Age 5 to 17
Demographics Similar to Malaysians by Disability Age 5 to 17
In terms of disability age 5 to 17, the demographic groups most similar to Malaysians are Immigrants from Kenya (5.8%, a difference of 0.010%), Immigrants from West Indies (5.8%, a difference of 0.050%), Immigrants from Brazil (5.8%, a difference of 0.060%), Immigrants from Laos (5.8%, a difference of 0.14%), and Sudanese (5.8%, a difference of 0.21%).
| Demographics | Rating | Rank | Disability Age 5 to 17 |
| Haitians | 4.8 /100 | #228 | Tragic 5.8% |
| Bangladeshis | 4.8 /100 | #229 | Tragic 5.8% |
| Ghanaians | 4.7 /100 | #230 | Tragic 5.8% |
| Europeans | 4.5 /100 | #231 | Tragic 5.8% |
| Immigrants | Laos | 3.8 /100 | #232 | Tragic 5.8% |
| Immigrants | West Indies | 3.5 /100 | #233 | Tragic 5.8% |
| Immigrants | Kenya | 3.4 /100 | #234 | Tragic 5.8% |
| Malaysians | 3.4 /100 | #235 | Tragic 5.8% |
| Immigrants | Brazil | 3.2 /100 | #236 | Tragic 5.8% |
| Sudanese | 2.9 /100 | #237 | Tragic 5.8% |
| Hungarians | 2.6 /100 | #238 | Tragic 5.8% |
| German Russians | 2.4 /100 | #239 | Tragic 5.9% |
| West Indians | 2.4 /100 | #240 | Tragic 5.9% |
| Immigrants | Caribbean | 2.1 /100 | #241 | Tragic 5.9% |
| Spaniards | 2.0 /100 | #242 | Tragic 5.9% |
Demographics Similar to Natives/Alaskans by Disability Age 5 to 17
In terms of disability age 5 to 17, the demographic groups most similar to Natives/Alaskans are Nonimmigrants (6.3%, a difference of 0.10%), Senegalese (6.3%, a difference of 0.14%), Yakama (6.3%, a difference of 0.22%), Bahamian (6.3%, a difference of 0.24%), and Celtic (6.3%, a difference of 0.33%).
| Demographics | Rating | Rank | Disability Age 5 to 17 |
| Lumbee | 0.0 /100 | #298 | Tragic 6.2% |
| Welsh | 0.0 /100 | #299 | Tragic 6.3% |
| Carpatho Rusyns | 0.0 /100 | #300 | Tragic 6.3% |
| U.S. Virgin Islanders | 0.0 /100 | #301 | Tragic 6.3% |
| Celtics | 0.0 /100 | #302 | Tragic 6.3% |
| Yakama | 0.0 /100 | #303 | Tragic 6.3% |
| Senegalese | 0.0 /100 | #304 | Tragic 6.3% |
| Natives/Alaskans | 0.0 /100 | #305 | Tragic 6.3% |
| Immigrants | Nonimmigrants | 0.0 /100 | #306 | Tragic 6.3% |
| Bahamians | 0.0 /100 | #307 | Tragic 6.3% |
| Scotch-Irish | 0.0 /100 | #308 | Tragic 6.3% |
| Hmong | 0.0 /100 | #309 | Tragic 6.3% |
| Alaskan Athabascans | 0.0 /100 | #310 | Tragic 6.3% |
| Immigrants | Dominica | 0.0 /100 | #311 | Tragic 6.3% |
| Bermudans | 0.0 /100 | #312 | Tragic 6.4% |