Immigrants from Nicaragua vs Sudanese Disability Age 5 to 17
COMPARE
Immigrants from Nicaragua
Sudanese
Disability Age 5 to 17
Disability Age 5 to 17 Comparison
Immigrants from Nicaragua
Sudanese
5.2%
DISABILITY AGE 5 TO 17
99.5/ 100
METRIC RATING
84th/ 347
METRIC RANK
5.8%
DISABILITY AGE 5 TO 17
2.9/ 100
METRIC RATING
237th/ 347
METRIC RANK
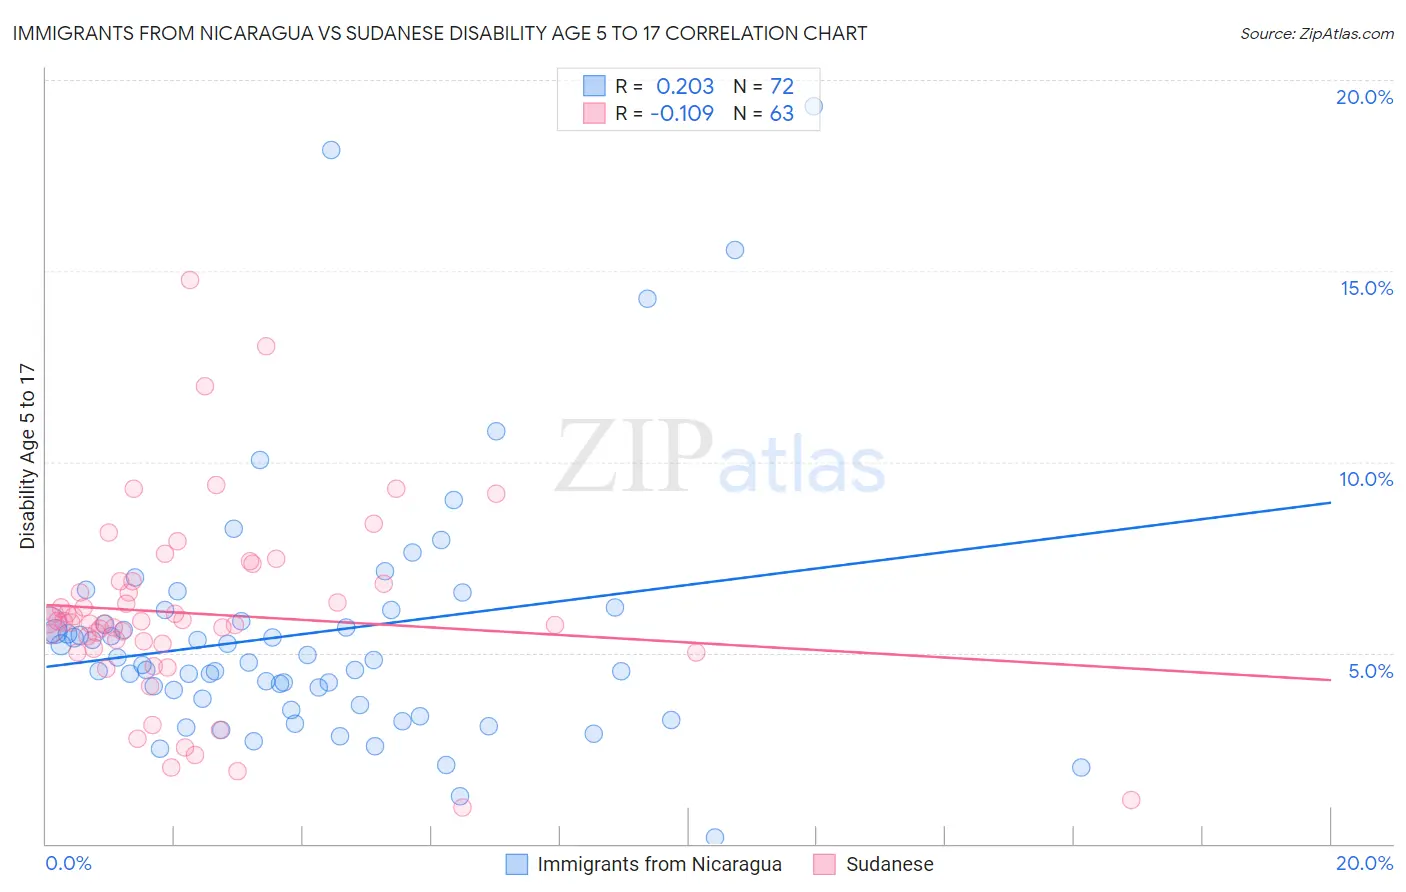
Immigrants from Nicaragua vs Sudanese Disability Age 5 to 17 Correlation Chart
The statistical analysis conducted on geographies consisting of 235,611,725 people shows a weak positive correlation between the proportion of Immigrants from Nicaragua and percentage of population with a disability between the ages 5 and 17 in the United States with a correlation coefficient (R) of 0.203 and weighted average of 5.2%. Similarly, the statistical analysis conducted on geographies consisting of 109,989,475 people shows a poor negative correlation between the proportion of Sudanese and percentage of population with a disability between the ages 5 and 17 in the United States with a correlation coefficient (R) of -0.109 and weighted average of 5.8%, a difference of 11.5%.
Disability Age 5 to 17 Correlation Summary
| Measurement | Immigrants from Nicaragua | Sudanese |
| Minimum | 0.17% | 0.94% |
| Maximum | 19.3% | 14.8% |
| Range | 19.1% | 13.8% |
| Mean | 5.5% | 6.0% |
| Median | 4.8% | 5.8% |
| Interquartile 25% (IQ1) | 3.7% | 5.1% |
| Interquartile 75% (IQ3) | 6.0% | 6.9% |
| Interquartile Range (IQR) | 2.3% | 1.7% |
| Standard Deviation (Sample) | 3.4% | 2.5% |
| Standard Deviation (Population) | 3.3% | 2.5% |
Similar Demographics by Disability Age 5 to 17
Demographics Similar to Immigrants from Nicaragua by Disability Age 5 to 17
In terms of disability age 5 to 17, the demographic groups most similar to Immigrants from Nicaragua are Immigrants from France (5.2%, a difference of 0.070%), Bulgarian (5.2%, a difference of 0.070%), Immigrants from St. Vincent and the Grenadines (5.2%, a difference of 0.11%), Eastern European (5.2%, a difference of 0.15%), and Immigrants from Sweden (5.2%, a difference of 0.16%).
| Demographics | Rating | Rank | Disability Age 5 to 17 |
| Immigrants | Kazakhstan | 99.6 /100 | #77 | Exceptional 5.2% |
| Immigrants | Cuba | 99.6 /100 | #78 | Exceptional 5.2% |
| Afghans | 99.6 /100 | #79 | Exceptional 5.2% |
| Sri Lankans | 99.6 /100 | #80 | Exceptional 5.2% |
| Native Hawaiians | 99.6 /100 | #81 | Exceptional 5.2% |
| Immigrants | Sweden | 99.5 /100 | #82 | Exceptional 5.2% |
| Immigrants | France | 99.5 /100 | #83 | Exceptional 5.2% |
| Immigrants | Nicaragua | 99.5 /100 | #84 | Exceptional 5.2% |
| Bulgarians | 99.4 /100 | #85 | Exceptional 5.2% |
| Immigrants | St. Vincent and the Grenadines | 99.4 /100 | #86 | Exceptional 5.2% |
| Eastern Europeans | 99.4 /100 | #87 | Exceptional 5.2% |
| Immigrants | Croatia | 99.4 /100 | #88 | Exceptional 5.2% |
| Immigrants | Spain | 99.4 /100 | #89 | Exceptional 5.2% |
| Immigrants | Kuwait | 99.4 /100 | #90 | Exceptional 5.3% |
| Mongolians | 99.2 /100 | #91 | Exceptional 5.3% |
Demographics Similar to Sudanese by Disability Age 5 to 17
In terms of disability age 5 to 17, the demographic groups most similar to Sudanese are Hungarian (5.8%, a difference of 0.10%), Immigrants from Brazil (5.8%, a difference of 0.15%), German Russian (5.9%, a difference of 0.20%), Malaysian (5.8%, a difference of 0.21%), and Immigrants from Kenya (5.8%, a difference of 0.22%).
| Demographics | Rating | Rank | Disability Age 5 to 17 |
| Ghanaians | 4.7 /100 | #230 | Tragic 5.8% |
| Europeans | 4.5 /100 | #231 | Tragic 5.8% |
| Immigrants | Laos | 3.8 /100 | #232 | Tragic 5.8% |
| Immigrants | West Indies | 3.5 /100 | #233 | Tragic 5.8% |
| Immigrants | Kenya | 3.4 /100 | #234 | Tragic 5.8% |
| Malaysians | 3.4 /100 | #235 | Tragic 5.8% |
| Immigrants | Brazil | 3.2 /100 | #236 | Tragic 5.8% |
| Sudanese | 2.9 /100 | #237 | Tragic 5.8% |
| Hungarians | 2.6 /100 | #238 | Tragic 5.8% |
| German Russians | 2.4 /100 | #239 | Tragic 5.9% |
| West Indians | 2.4 /100 | #240 | Tragic 5.9% |
| Immigrants | Caribbean | 2.1 /100 | #241 | Tragic 5.9% |
| Spaniards | 2.0 /100 | #242 | Tragic 5.9% |
| Indonesians | 2.0 /100 | #243 | Tragic 5.9% |
| Immigrants | Germany | 1.9 /100 | #244 | Tragic 5.9% |