Immigrants from Nicaragua vs Immigrants from Indonesia Disability Age 5 to 17
COMPARE
Immigrants from Nicaragua
Immigrants from Indonesia
Disability Age 5 to 17
Disability Age 5 to 17 Comparison
Immigrants from Nicaragua
Immigrants from Indonesia
5.2%
DISABILITY AGE 5 TO 17
99.5/ 100
METRIC RATING
84th/ 347
METRIC RANK
5.0%
DISABILITY AGE 5 TO 17
100.0/ 100
METRIC RATING
33rd/ 347
METRIC RANK
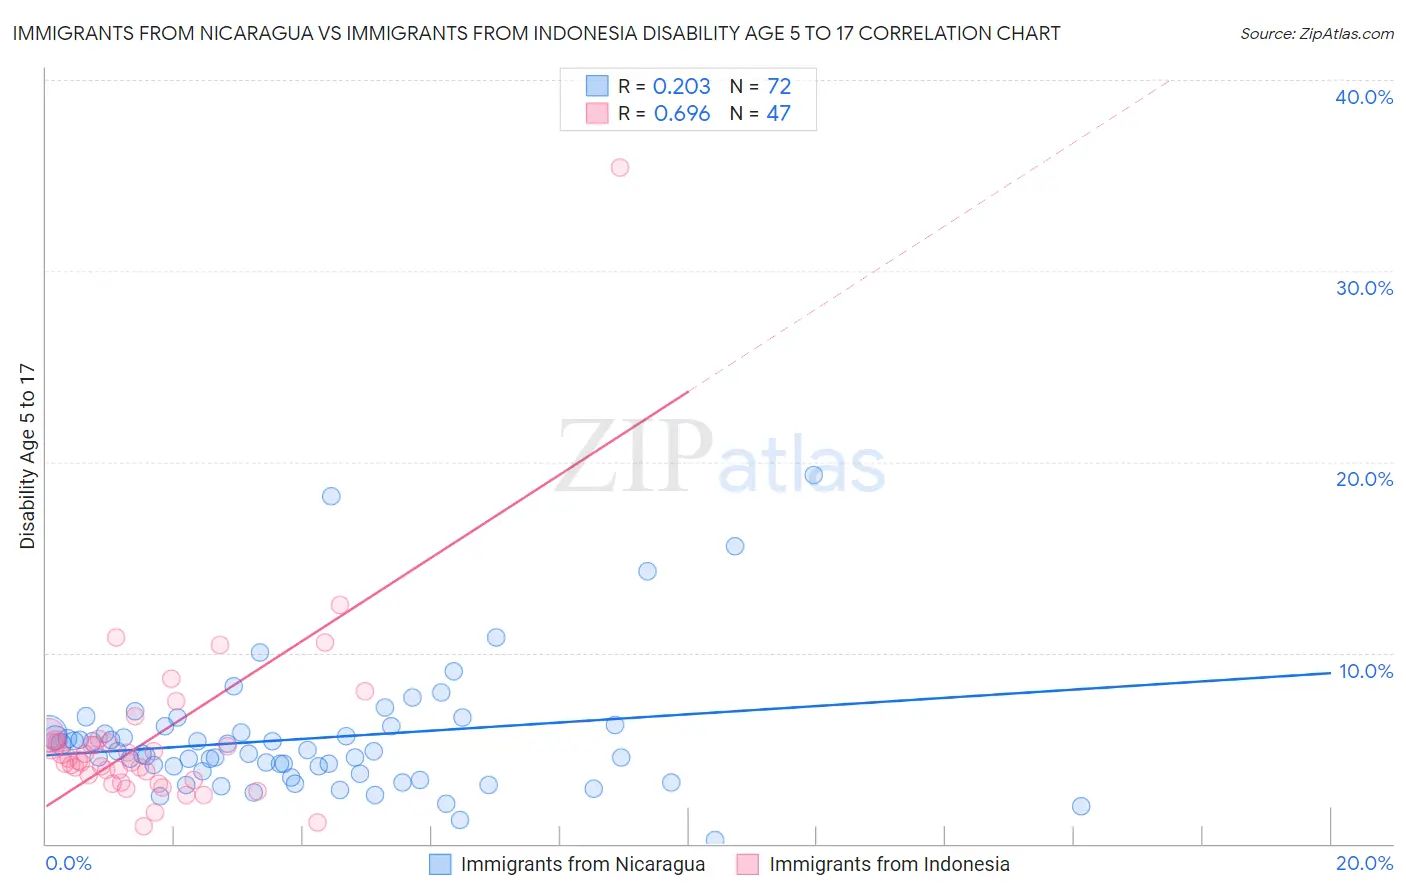
Immigrants from Nicaragua vs Immigrants from Indonesia Disability Age 5 to 17 Correlation Chart
The statistical analysis conducted on geographies consisting of 235,611,725 people shows a weak positive correlation between the proportion of Immigrants from Nicaragua and percentage of population with a disability between the ages 5 and 17 in the United States with a correlation coefficient (R) of 0.203 and weighted average of 5.2%. Similarly, the statistical analysis conducted on geographies consisting of 214,816,459 people shows a significant positive correlation between the proportion of Immigrants from Indonesia and percentage of population with a disability between the ages 5 and 17 in the United States with a correlation coefficient (R) of 0.696 and weighted average of 5.0%, a difference of 5.0%.
Disability Age 5 to 17 Correlation Summary
| Measurement | Immigrants from Nicaragua | Immigrants from Indonesia |
| Minimum | 0.17% | 0.90% |
| Maximum | 19.3% | 35.4% |
| Range | 19.1% | 34.5% |
| Mean | 5.5% | 5.5% |
| Median | 4.8% | 4.4% |
| Interquartile 25% (IQ1) | 3.7% | 3.3% |
| Interquartile 75% (IQ3) | 6.0% | 5.4% |
| Interquartile Range (IQR) | 2.3% | 2.0% |
| Standard Deviation (Sample) | 3.4% | 5.1% |
| Standard Deviation (Population) | 3.3% | 5.0% |
Similar Demographics by Disability Age 5 to 17
Demographics Similar to Immigrants from Nicaragua by Disability Age 5 to 17
In terms of disability age 5 to 17, the demographic groups most similar to Immigrants from Nicaragua are Immigrants from France (5.2%, a difference of 0.070%), Bulgarian (5.2%, a difference of 0.070%), Immigrants from St. Vincent and the Grenadines (5.2%, a difference of 0.11%), Eastern European (5.2%, a difference of 0.15%), and Immigrants from Sweden (5.2%, a difference of 0.16%).
| Demographics | Rating | Rank | Disability Age 5 to 17 |
| Immigrants | Kazakhstan | 99.6 /100 | #77 | Exceptional 5.2% |
| Immigrants | Cuba | 99.6 /100 | #78 | Exceptional 5.2% |
| Afghans | 99.6 /100 | #79 | Exceptional 5.2% |
| Sri Lankans | 99.6 /100 | #80 | Exceptional 5.2% |
| Native Hawaiians | 99.6 /100 | #81 | Exceptional 5.2% |
| Immigrants | Sweden | 99.5 /100 | #82 | Exceptional 5.2% |
| Immigrants | France | 99.5 /100 | #83 | Exceptional 5.2% |
| Immigrants | Nicaragua | 99.5 /100 | #84 | Exceptional 5.2% |
| Bulgarians | 99.4 /100 | #85 | Exceptional 5.2% |
| Immigrants | St. Vincent and the Grenadines | 99.4 /100 | #86 | Exceptional 5.2% |
| Eastern Europeans | 99.4 /100 | #87 | Exceptional 5.2% |
| Immigrants | Croatia | 99.4 /100 | #88 | Exceptional 5.2% |
| Immigrants | Spain | 99.4 /100 | #89 | Exceptional 5.2% |
| Immigrants | Kuwait | 99.4 /100 | #90 | Exceptional 5.3% |
| Mongolians | 99.2 /100 | #91 | Exceptional 5.3% |
Demographics Similar to Immigrants from Indonesia by Disability Age 5 to 17
In terms of disability age 5 to 17, the demographic groups most similar to Immigrants from Indonesia are Israeli (5.0%, a difference of 0.12%), Bolivian (5.0%, a difference of 0.30%), Soviet Union (5.0%, a difference of 0.32%), Immigrants from Egypt (5.0%, a difference of 0.35%), and Immigrants from Pakistan (5.0%, a difference of 0.36%).
| Demographics | Rating | Rank | Disability Age 5 to 17 |
| Bhutanese | 100.0 /100 | #26 | Exceptional 4.9% |
| Taiwanese | 100.0 /100 | #27 | Exceptional 4.9% |
| Immigrants | Japan | 100.0 /100 | #28 | Exceptional 4.9% |
| Immigrants | Serbia | 100.0 /100 | #29 | Exceptional 4.9% |
| Immigrants | Malaysia | 100.0 /100 | #30 | Exceptional 5.0% |
| Immigrants | Pakistan | 100.0 /100 | #31 | Exceptional 5.0% |
| Soviet Union | 100.0 /100 | #32 | Exceptional 5.0% |
| Immigrants | Indonesia | 100.0 /100 | #33 | Exceptional 5.0% |
| Israelis | 100.0 /100 | #34 | Exceptional 5.0% |
| Bolivians | 100.0 /100 | #35 | Exceptional 5.0% |
| Immigrants | Egypt | 100.0 /100 | #36 | Exceptional 5.0% |
| Immigrants | Belarus | 100.0 /100 | #37 | Exceptional 5.0% |
| Immigrants | Philippines | 100.0 /100 | #38 | Exceptional 5.0% |
| Immigrants | Argentina | 100.0 /100 | #39 | Exceptional 5.0% |
| Okinawans | 100.0 /100 | #40 | Exceptional 5.0% |