Immigrants from Kazakhstan vs Indonesian Disability Age 5 to 17
COMPARE
Immigrants from Kazakhstan
Indonesian
Disability Age 5 to 17
Disability Age 5 to 17 Comparison
Immigrants from Kazakhstan
Indonesians
5.2%
DISABILITY AGE 5 TO 17
99.6/ 100
METRIC RATING
77th/ 347
METRIC RANK
5.9%
DISABILITY AGE 5 TO 17
2.0/ 100
METRIC RATING
243rd/ 347
METRIC RANK
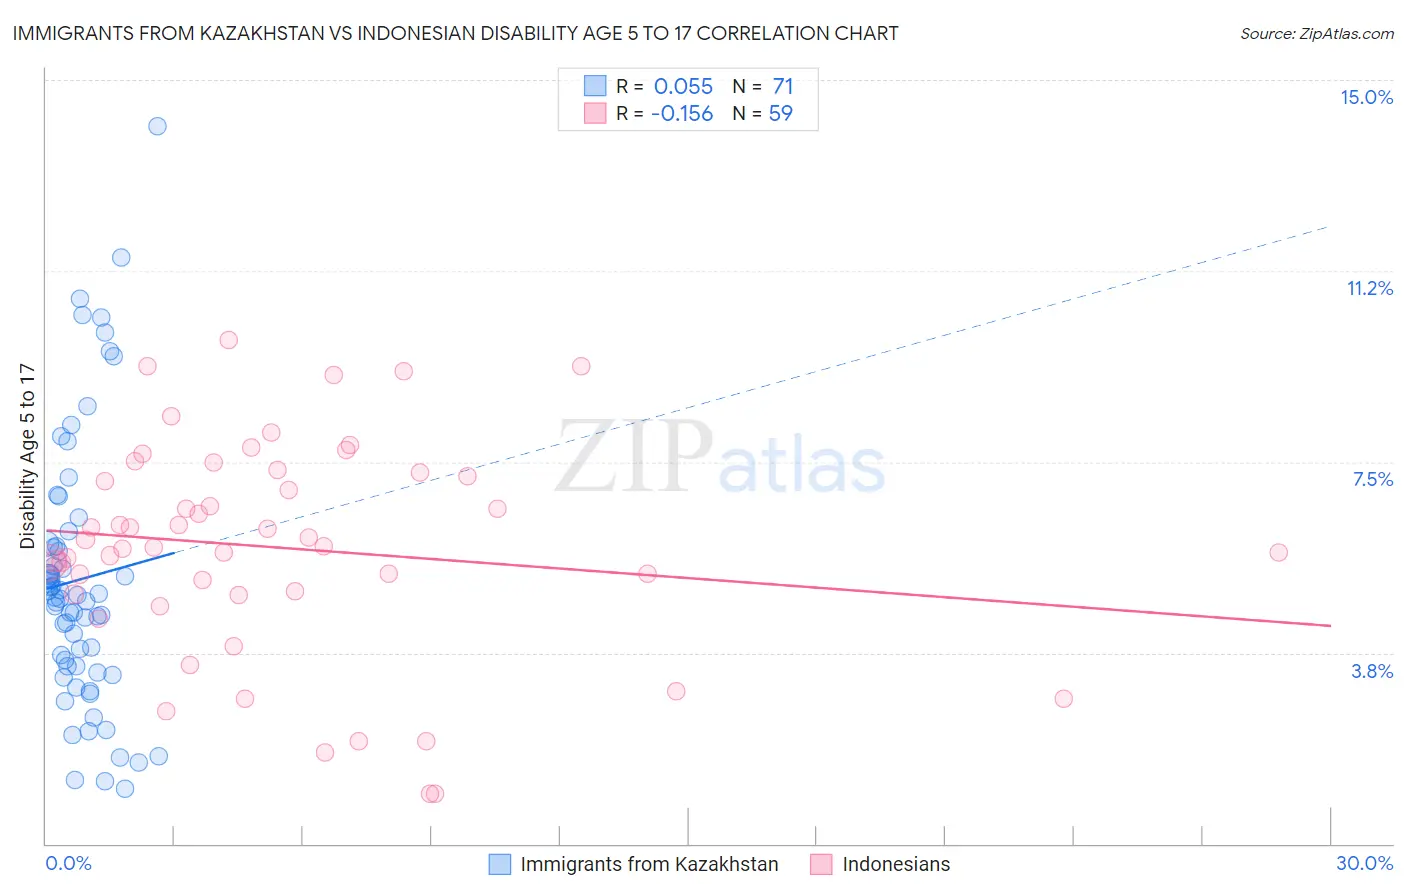
Immigrants from Kazakhstan vs Indonesian Disability Age 5 to 17 Correlation Chart
The statistical analysis conducted on geographies consisting of 124,141,808 people shows a slight positive correlation between the proportion of Immigrants from Kazakhstan and percentage of population with a disability between the ages 5 and 17 in the United States with a correlation coefficient (R) of 0.055 and weighted average of 5.2%. Similarly, the statistical analysis conducted on geographies consisting of 162,352,811 people shows a poor negative correlation between the proportion of Indonesians and percentage of population with a disability between the ages 5 and 17 in the United States with a correlation coefficient (R) of -0.156 and weighted average of 5.9%, a difference of 12.5%.
Disability Age 5 to 17 Correlation Summary
| Measurement | Immigrants from Kazakhstan | Indonesian |
| Minimum | 1.1% | 0.98% |
| Maximum | 14.1% | 9.9% |
| Range | 13.0% | 8.9% |
| Mean | 5.2% | 5.8% |
| Median | 4.8% | 5.8% |
| Interquartile 25% (IQ1) | 3.5% | 4.9% |
| Interquartile 75% (IQ3) | 5.9% | 7.3% |
| Interquartile Range (IQR) | 2.4% | 2.4% |
| Standard Deviation (Sample) | 2.6% | 2.1% |
| Standard Deviation (Population) | 2.6% | 2.1% |
Similar Demographics by Disability Age 5 to 17
Demographics Similar to Immigrants from Kazakhstan by Disability Age 5 to 17
In terms of disability age 5 to 17, the demographic groups most similar to Immigrants from Kazakhstan are Immigrants from Cuba (5.2%, a difference of 0.010%), Immigrants from Guyana (5.2%, a difference of 0.030%), Afghan (5.2%, a difference of 0.050%), Immigrants from Moldova (5.2%, a difference of 0.070%), and Sri Lankan (5.2%, a difference of 0.070%).
| Demographics | Rating | Rank | Disability Age 5 to 17 |
| Immigrants | Belgium | 99.7 /100 | #70 | Exceptional 5.2% |
| Jordanians | 99.7 /100 | #71 | Exceptional 5.2% |
| Immigrants | Vietnam | 99.7 /100 | #72 | Exceptional 5.2% |
| Immigrants | Czechoslovakia | 99.7 /100 | #73 | Exceptional 5.2% |
| Immigrants | Romania | 99.7 /100 | #74 | Exceptional 5.2% |
| Immigrants | Moldova | 99.6 /100 | #75 | Exceptional 5.2% |
| Immigrants | Guyana | 99.6 /100 | #76 | Exceptional 5.2% |
| Immigrants | Kazakhstan | 99.6 /100 | #77 | Exceptional 5.2% |
| Immigrants | Cuba | 99.6 /100 | #78 | Exceptional 5.2% |
| Afghans | 99.6 /100 | #79 | Exceptional 5.2% |
| Sri Lankans | 99.6 /100 | #80 | Exceptional 5.2% |
| Native Hawaiians | 99.6 /100 | #81 | Exceptional 5.2% |
| Immigrants | Sweden | 99.5 /100 | #82 | Exceptional 5.2% |
| Immigrants | France | 99.5 /100 | #83 | Exceptional 5.2% |
| Immigrants | Nicaragua | 99.5 /100 | #84 | Exceptional 5.2% |
Demographics Similar to Indonesians by Disability Age 5 to 17
In terms of disability age 5 to 17, the demographic groups most similar to Indonesians are Spaniard (5.9%, a difference of 0.010%), Immigrants from Germany (5.9%, a difference of 0.060%), Immigrants from Micronesia (5.9%, a difference of 0.060%), Tlingit-Haida (5.9%, a difference of 0.060%), and Immigrants from Caribbean (5.9%, a difference of 0.090%).
| Demographics | Rating | Rank | Disability Age 5 to 17 |
| Immigrants | Brazil | 3.2 /100 | #236 | Tragic 5.8% |
| Sudanese | 2.9 /100 | #237 | Tragic 5.8% |
| Hungarians | 2.6 /100 | #238 | Tragic 5.8% |
| German Russians | 2.4 /100 | #239 | Tragic 5.9% |
| West Indians | 2.4 /100 | #240 | Tragic 5.9% |
| Immigrants | Caribbean | 2.1 /100 | #241 | Tragic 5.9% |
| Spaniards | 2.0 /100 | #242 | Tragic 5.9% |
| Indonesians | 2.0 /100 | #243 | Tragic 5.9% |
| Immigrants | Germany | 1.9 /100 | #244 | Tragic 5.9% |
| Immigrants | Micronesia | 1.9 /100 | #245 | Tragic 5.9% |
| Tlingit-Haida | 1.9 /100 | #246 | Tragic 5.9% |
| Immigrants | Honduras | 1.8 /100 | #247 | Tragic 5.9% |
| British | 1.7 /100 | #248 | Tragic 5.9% |
| Immigrants | Ghana | 1.7 /100 | #249 | Tragic 5.9% |
| Poles | 1.5 /100 | #250 | Tragic 5.9% |