Immigrants from Kazakhstan vs Immigrants from Uruguay Disability Age 5 to 17
COMPARE
Immigrants from Kazakhstan
Immigrants from Uruguay
Disability Age 5 to 17
Disability Age 5 to 17 Comparison
Immigrants from Kazakhstan
Immigrants from Uruguay
5.2%
DISABILITY AGE 5 TO 17
99.6/ 100
METRIC RATING
77th/ 347
METRIC RANK
5.6%
DISABILITY AGE 5 TO 17
37.7/ 100
METRIC RATING
180th/ 347
METRIC RANK
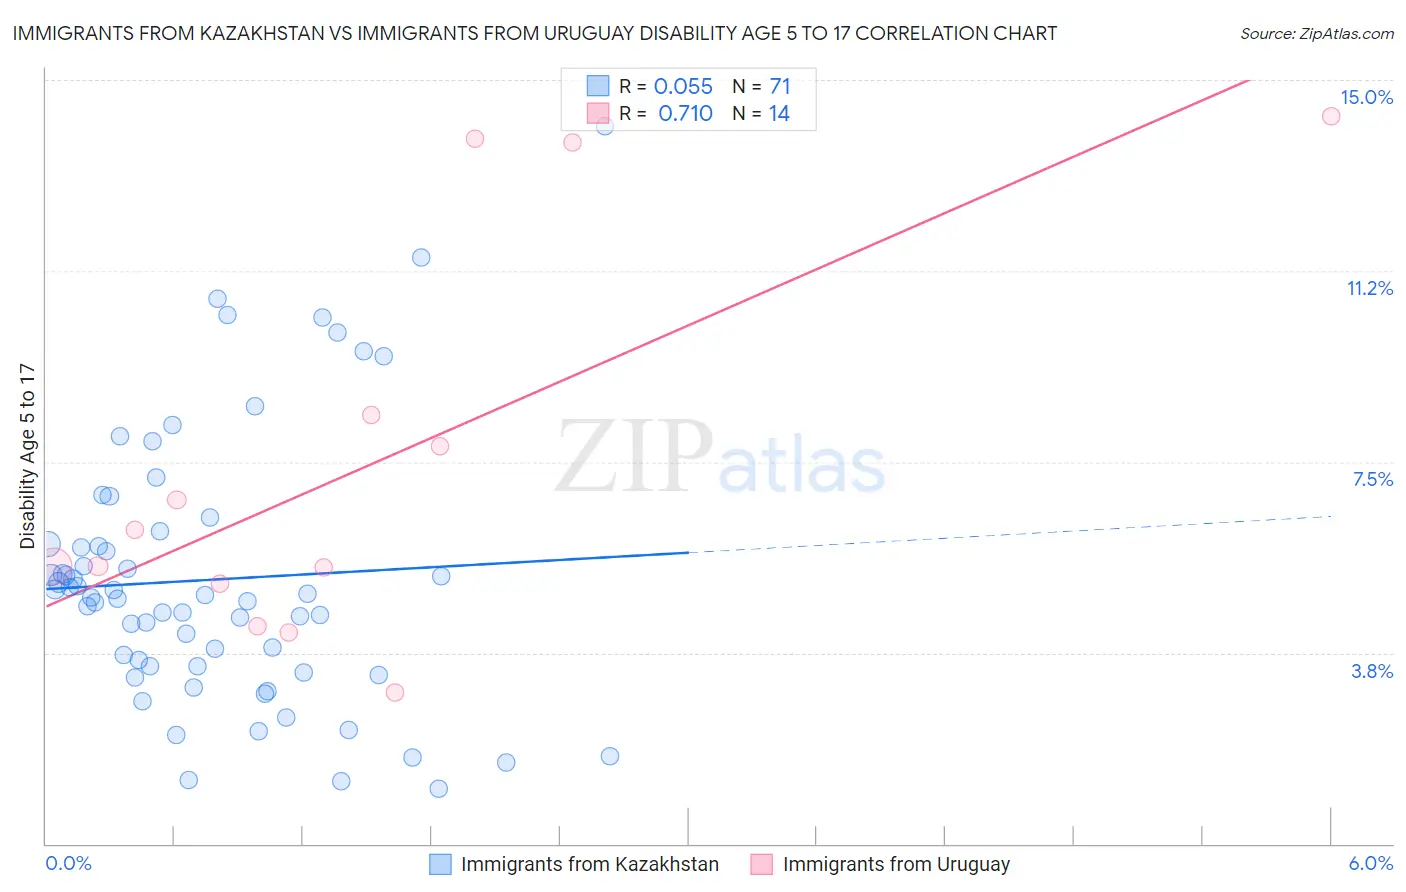
Immigrants from Kazakhstan vs Immigrants from Uruguay Disability Age 5 to 17 Correlation Chart
The statistical analysis conducted on geographies consisting of 124,141,808 people shows a slight positive correlation between the proportion of Immigrants from Kazakhstan and percentage of population with a disability between the ages 5 and 17 in the United States with a correlation coefficient (R) of 0.055 and weighted average of 5.2%. Similarly, the statistical analysis conducted on geographies consisting of 132,989,103 people shows a strong positive correlation between the proportion of Immigrants from Uruguay and percentage of population with a disability between the ages 5 and 17 in the United States with a correlation coefficient (R) of 0.710 and weighted average of 5.6%, a difference of 8.0%.
Disability Age 5 to 17 Correlation Summary
| Measurement | Immigrants from Kazakhstan | Immigrants from Uruguay |
| Minimum | 1.1% | 3.0% |
| Maximum | 14.1% | 14.3% |
| Range | 13.0% | 11.3% |
| Mean | 5.2% | 7.4% |
| Median | 4.8% | 5.8% |
| Interquartile 25% (IQ1) | 3.5% | 5.1% |
| Interquartile 75% (IQ3) | 5.9% | 8.4% |
| Interquartile Range (IQR) | 2.4% | 3.3% |
| Standard Deviation (Sample) | 2.6% | 3.8% |
| Standard Deviation (Population) | 2.6% | 3.7% |
Similar Demographics by Disability Age 5 to 17
Demographics Similar to Immigrants from Kazakhstan by Disability Age 5 to 17
In terms of disability age 5 to 17, the demographic groups most similar to Immigrants from Kazakhstan are Immigrants from Cuba (5.2%, a difference of 0.010%), Immigrants from Guyana (5.2%, a difference of 0.030%), Afghan (5.2%, a difference of 0.050%), Immigrants from Moldova (5.2%, a difference of 0.070%), and Sri Lankan (5.2%, a difference of 0.070%).
| Demographics | Rating | Rank | Disability Age 5 to 17 |
| Immigrants | Belgium | 99.7 /100 | #70 | Exceptional 5.2% |
| Jordanians | 99.7 /100 | #71 | Exceptional 5.2% |
| Immigrants | Vietnam | 99.7 /100 | #72 | Exceptional 5.2% |
| Immigrants | Czechoslovakia | 99.7 /100 | #73 | Exceptional 5.2% |
| Immigrants | Romania | 99.7 /100 | #74 | Exceptional 5.2% |
| Immigrants | Moldova | 99.6 /100 | #75 | Exceptional 5.2% |
| Immigrants | Guyana | 99.6 /100 | #76 | Exceptional 5.2% |
| Immigrants | Kazakhstan | 99.6 /100 | #77 | Exceptional 5.2% |
| Immigrants | Cuba | 99.6 /100 | #78 | Exceptional 5.2% |
| Afghans | 99.6 /100 | #79 | Exceptional 5.2% |
| Sri Lankans | 99.6 /100 | #80 | Exceptional 5.2% |
| Native Hawaiians | 99.6 /100 | #81 | Exceptional 5.2% |
| Immigrants | Sweden | 99.5 /100 | #82 | Exceptional 5.2% |
| Immigrants | France | 99.5 /100 | #83 | Exceptional 5.2% |
| Immigrants | Nicaragua | 99.5 /100 | #84 | Exceptional 5.2% |
Demographics Similar to Immigrants from Uruguay by Disability Age 5 to 17
In terms of disability age 5 to 17, the demographic groups most similar to Immigrants from Uruguay are Immigrants from England (5.6%, a difference of 0.070%), Mexican American Indian (5.6%, a difference of 0.13%), Immigrants from Barbados (5.6%, a difference of 0.14%), Immigrants from Latin America (5.6%, a difference of 0.18%), and Syrian (5.6%, a difference of 0.21%).
| Demographics | Rating | Rank | Disability Age 5 to 17 |
| Uruguayans | 51.0 /100 | #173 | Average 5.6% |
| Costa Ricans | 50.0 /100 | #174 | Average 5.6% |
| Shoshone | 49.4 /100 | #175 | Average 5.6% |
| Immigrants | Central America | 49.4 /100 | #176 | Average 5.6% |
| Immigrants | Western Europe | 47.8 /100 | #177 | Average 5.6% |
| Immigrants | Trinidad and Tobago | 47.6 /100 | #178 | Average 5.6% |
| Immigrants | Barbados | 40.5 /100 | #179 | Average 5.6% |
| Immigrants | Uruguay | 37.7 /100 | #180 | Fair 5.6% |
| Immigrants | England | 36.4 /100 | #181 | Fair 5.6% |
| Mexican American Indians | 35.2 /100 | #182 | Fair 5.6% |
| Immigrants | Latin America | 34.3 /100 | #183 | Fair 5.6% |
| Syrians | 33.8 /100 | #184 | Fair 5.6% |
| Immigrants | Mexico | 33.7 /100 | #185 | Fair 5.6% |
| Fijians | 31.7 /100 | #186 | Fair 5.7% |
| Immigrants | Thailand | 30.2 /100 | #187 | Fair 5.7% |