Immigrants from Israel 2 or more Vehicles in Household
COMPARE
Immigrants from Israel
Select to Compare
2 or more Vehicles in Household
Immigrants from Israel 2 or more Vehicles in Household
49.2%
2+ VEHICLES AVAILABLE
0.0/ 100
METRIC RATING
306th/ 347
METRIC RANK
Immigrants from Israel 2 or more Vehicles in Household Correlation Chart
The statistical analysis conducted on geographies consisting of 209,979,242 people shows a moderate positive correlation between the proportion of Immigrants from Israel and percentage of households with 2 or more vehicles available in the United States with a correlation coefficient (R) of 0.422 and weighted average of 49.2%. On average, for every 1% (one percent) increase in Immigrants from Israel within a typical geography, there is an increase of 2.6% in percentage of households with 2 or more vehicles available.
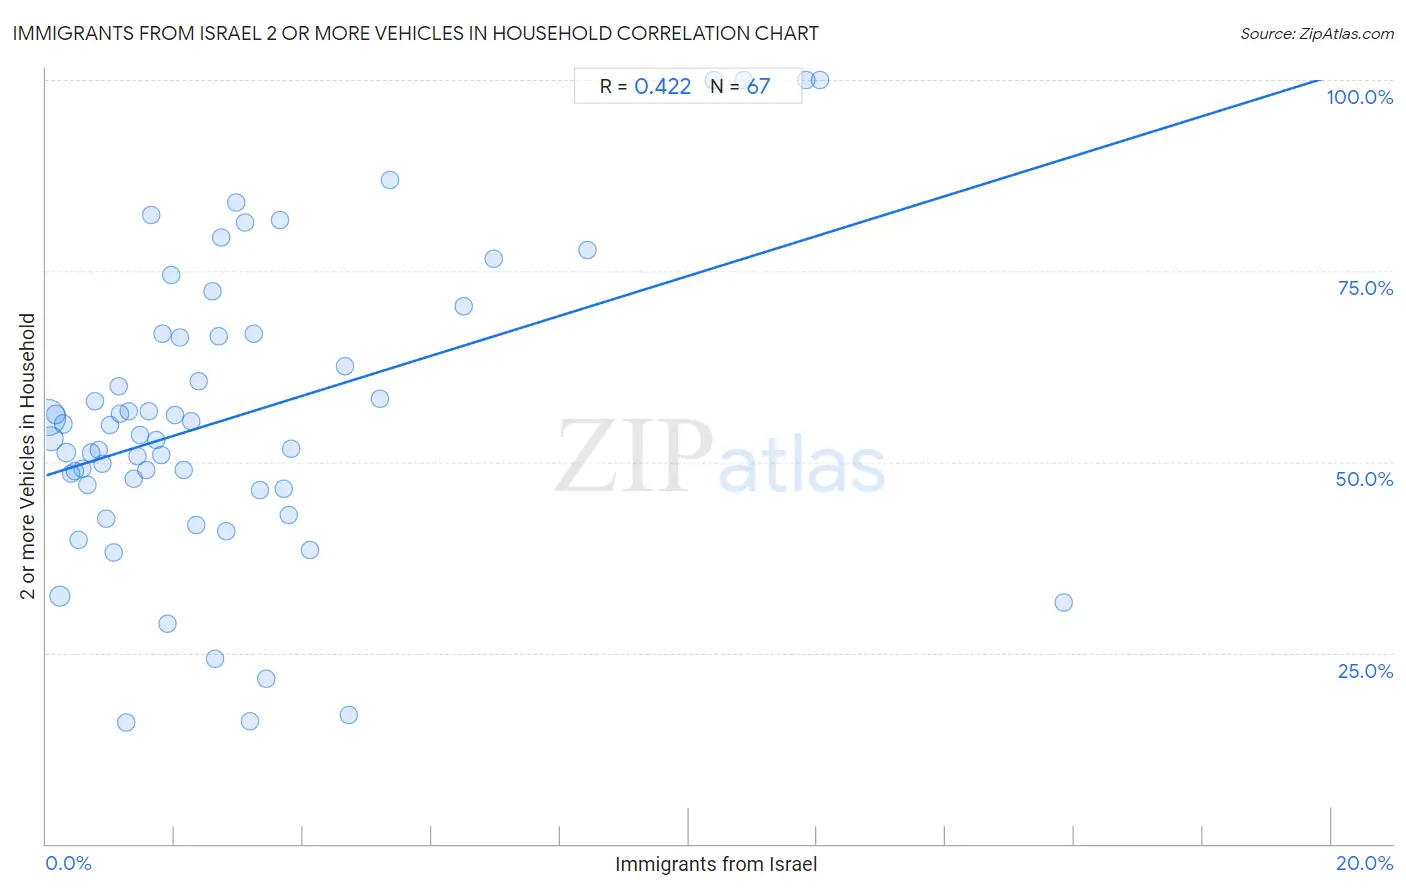
It is essential to understand that the correlation between the percentage of Immigrants from Israel and percentage of households with 2 or more vehicles available does not imply a direct cause-and-effect relationship. It remains uncertain whether the presence of Immigrants from Israel influences an upward or downward trend in the level of percentage of households with 2 or more vehicles available within an area, or if Immigrants from Israel simply ended up residing in those areas with higher or lower levels of percentage of households with 2 or more vehicles available due to other factors.
Demographics Similar to Immigrants from Israel by 2 or more Vehicles in Household
In terms of 2 or more vehicles in household, the demographic groups most similar to Immigrants from Israel are Immigrants from Western Africa (49.4%, a difference of 0.26%), Hopi (49.0%, a difference of 0.43%), Albanian (49.0%, a difference of 0.50%), Moroccan (48.8%, a difference of 0.85%), and Immigrants from Belize (49.9%, a difference of 1.3%).
| Demographics | Rating | Rank | 2 or more Vehicles in Household |
| Immigrants from Morocco | 0.0 /100 | #299 | Tragic 50.3% |
| Immigrants from Russia | 0.0 /100 | #300 | Tragic 50.3% |
| Immigrants from Greece | 0.0 /100 | #301 | Tragic 50.2% |
| Immigrants from South America | 0.0 /100 | #302 | Tragic 50.2% |
| Tohono O'odham | 0.0 /100 | #303 | Tragic 50.0% |
| Immigrants from Belize | 0.0 /100 | #304 | Tragic 49.9% |
| Immigrants from Western Africa | 0.0 /100 | #305 | Tragic 49.4% |
| Immigrants from Israel | 0.0 /100 | #306 | Tragic 49.2% |
| Hopi | 0.0 /100 | #307 | Tragic 49.0% |
| Albanians | 0.0 /100 | #308 | Tragic 49.0% |
| Moroccans | 0.0 /100 | #309 | Tragic 48.8% |
| Ghanaians | 0.0 /100 | #310 | Tragic 48.0% |
| Immigrants from Belarus | 0.0 /100 | #311 | Tragic 47.9% |
| Haitians | 0.0 /100 | #312 | Tragic 47.6% |
| U.S. Virgin Islanders | 0.0 /100 | #313 | Tragic 47.5% |
Immigrants from Israel 2 or more Vehicles in Household Correlation Summary
| Measurement | Immigrants from Israel Data | 2 or more Vehicles in Household Data |
| Minimum | 0.027% | 15.9% |
| Maximum | 15.8% | 100.0% |
| Range | 15.8% | 84.1% |
| Mean | 3.0% | 56.1% |
| Median | 2.0% | 53.6% |
| Interquartile 25% (IQ1) | 1.00% | 46.4% |
| Interquartile 75% (IQ3) | 3.6% | 66.7% |
| Interquartile Range (IQR) | 2.6% | 20.3% |
| Standard Deviation (Sample) | 3.2% | 19.7% |
| Standard Deviation (Population) | 3.2% | 19.5% |
Correlation Details
| Immigrants from Israel Percentile | Sample Size | 2 or more Vehicles in Household |
[ 0.0% - 0.5% ] 0.027% | 115,562,536 | 55.9% |
[ 0.0% - 0.5% ] 0.087% | 38,220,884 | 53.0% |
[ 0.0% - 0.5% ] 0.15% | 13,703,659 | 56.2% |
[ 0.0% - 0.5% ] 0.22% | 16,526,886 | 32.4% |
[ 0.0% - 0.5% ] 0.27% | 6,129,412 | 55.0% |
[ 0.0% - 0.5% ] 0.32% | 7,161,453 | 51.3% |
[ 0.0% - 0.5% ] 0.39% | 2,285,474 | 48.5% |
[ 0.0% - 0.5% ] 0.45% | 1,617,333 | 48.7% |
[ 0.5% - 1.0% ] 0.51% | 1,378,845 | 39.8% |
[ 0.5% - 1.0% ] 0.57% | 823,330 | 49.2% |
[ 0.5% - 1.0% ] 0.63% | 967,050 | 46.9% |
[ 0.5% - 1.0% ] 0.70% | 603,201 | 51.2% |
[ 0.5% - 1.0% ] 0.76% | 645,270 | 57.9% |
[ 0.5% - 1.0% ] 0.81% | 480,292 | 51.6% |
[ 0.5% - 1.0% ] 0.87% | 631,732 | 49.7% |
[ 0.5% - 1.0% ] 0.94% | 652,056 | 42.5% |
[ 0.5% - 1.0% ] 1.00% | 218,851 | 54.8% |
[ 1.0% - 1.5% ] 1.06% | 260,244 | 38.1% |
[ 1.0% - 1.5% ] 1.12% | 348,001 | 59.9% |
[ 1.0% - 1.5% ] 1.15% | 186,632 | 56.3% |
[ 1.0% - 1.5% ] 1.24% | 112,624 | 15.9% |
[ 1.0% - 1.5% ] 1.28% | 149,842 | 56.6% |
[ 1.0% - 1.5% ] 1.36% | 88,001 | 47.8% |
[ 1.0% - 1.5% ] 1.41% | 100,014 | 50.8% |
[ 1.0% - 1.5% ] 1.47% | 40,861 | 53.6% |
[ 1.5% - 2.0% ] 1.55% | 87,458 | 49.0% |
[ 1.5% - 2.0% ] 1.59% | 113,181 | 56.6% |
[ 1.5% - 2.0% ] 1.63% | 1,350 | 82.3% |
[ 1.5% - 2.0% ] 1.71% | 49,604 | 52.9% |
[ 1.5% - 2.0% ] 1.78% | 121,872 | 50.9% |
[ 1.5% - 2.0% ] 1.81% | 81,900 | 66.7% |
[ 1.5% - 2.0% ] 1.89% | 8,141 | 28.8% |
[ 1.5% - 2.0% ] 1.95% | 59,070 | 74.5% |
[ 2.0% - 2.5% ] 2.01% | 1,445 | 56.1% |
[ 2.0% - 2.5% ] 2.08% | 6,244 | 66.2% |
[ 2.0% - 2.5% ] 2.14% | 57,847 | 48.9% |
[ 2.0% - 2.5% ] 2.27% | 56,391 | 55.4% |
[ 2.0% - 2.5% ] 2.34% | 13,401 | 41.8% |
[ 2.0% - 2.5% ] 2.37% | 20,180 | 60.5% |
[ 2.5% - 3.0% ] 2.58% | 16,190 | 72.3% |
[ 2.5% - 3.0% ] 2.62% | 62,698 | 24.2% |
[ 2.5% - 3.0% ] 2.69% | 74,332 | 66.4% |
[ 2.5% - 3.0% ] 2.73% | 1,136 | 79.3% |
[ 2.5% - 3.0% ] 2.81% | 39,621 | 40.9% |
[ 2.5% - 3.0% ] 2.96% | 5,070 | 83.9% |
[ 3.0% - 3.5% ] 3.09% | 6,764 | 81.4% |
[ 3.0% - 3.5% ] 3.17% | 42,155 | 16.1% |
[ 3.0% - 3.5% ] 3.23% | 31,910 | 66.7% |
[ 3.0% - 3.5% ] 3.33% | 32,881 | 46.2% |
[ 3.0% - 3.5% ] 3.43% | 962 | 21.6% |
[ 3.5% - 4.0% ] 3.65% | 1,207 | 81.7% |
[ 3.5% - 4.0% ] 3.70% | 54 | 46.4% |
[ 3.5% - 4.0% ] 3.77% | 106 | 43.1% |
[ 3.5% - 4.0% ] 3.82% | 2,750 | 51.8% |
[ 4.0% - 4.5% ] 4.10% | 20,411 | 38.5% |
[ 4.5% - 5.0% ] 4.66% | 1,438 | 62.5% |
[ 4.5% - 5.0% ] 4.70% | 31,517 | 16.8% |
[ 5.0% - 5.5% ] 5.20% | 3,440 | 58.2% |
[ 5.0% - 5.5% ] 5.35% | 1,066 | 86.8% |
[ 6.0% - 6.5% ] 6.49% | 18,210 | 70.4% |
[ 6.5% - 7.0% ] 6.96% | 9,860 | 76.6% |
[ 8.0% - 8.5% ] 8.42% | 1,366 | 77.7% |
[ 10.0% - 10.5% ] 10.39% | 308 | 100.0% |
[ 10.5% - 11.0% ] 10.85% | 295 | 100.0% |
[ 11.5% - 12.0% ] 11.83% | 93 | 100.0% |
[ 12.0% - 12.5% ] 12.03% | 349 | 100.0% |
[ 15.5% - 16.0% ] 15.84% | 486 | 31.6% |