Immigrants from Israel vs Immigrants from Liberia Disability Age 5 to 17
COMPARE
Immigrants from Israel
Immigrants from Liberia
Disability Age 5 to 17
Disability Age 5 to 17 Comparison
Immigrants from Israel
Immigrants from Liberia
4.5%
DISABILITY AGE 5 TO 17
100.0/ 100
METRIC RATING
6th/ 347
METRIC RANK
6.1%
DISABILITY AGE 5 TO 17
0.1/ 100
METRIC RATING
278th/ 347
METRIC RANK
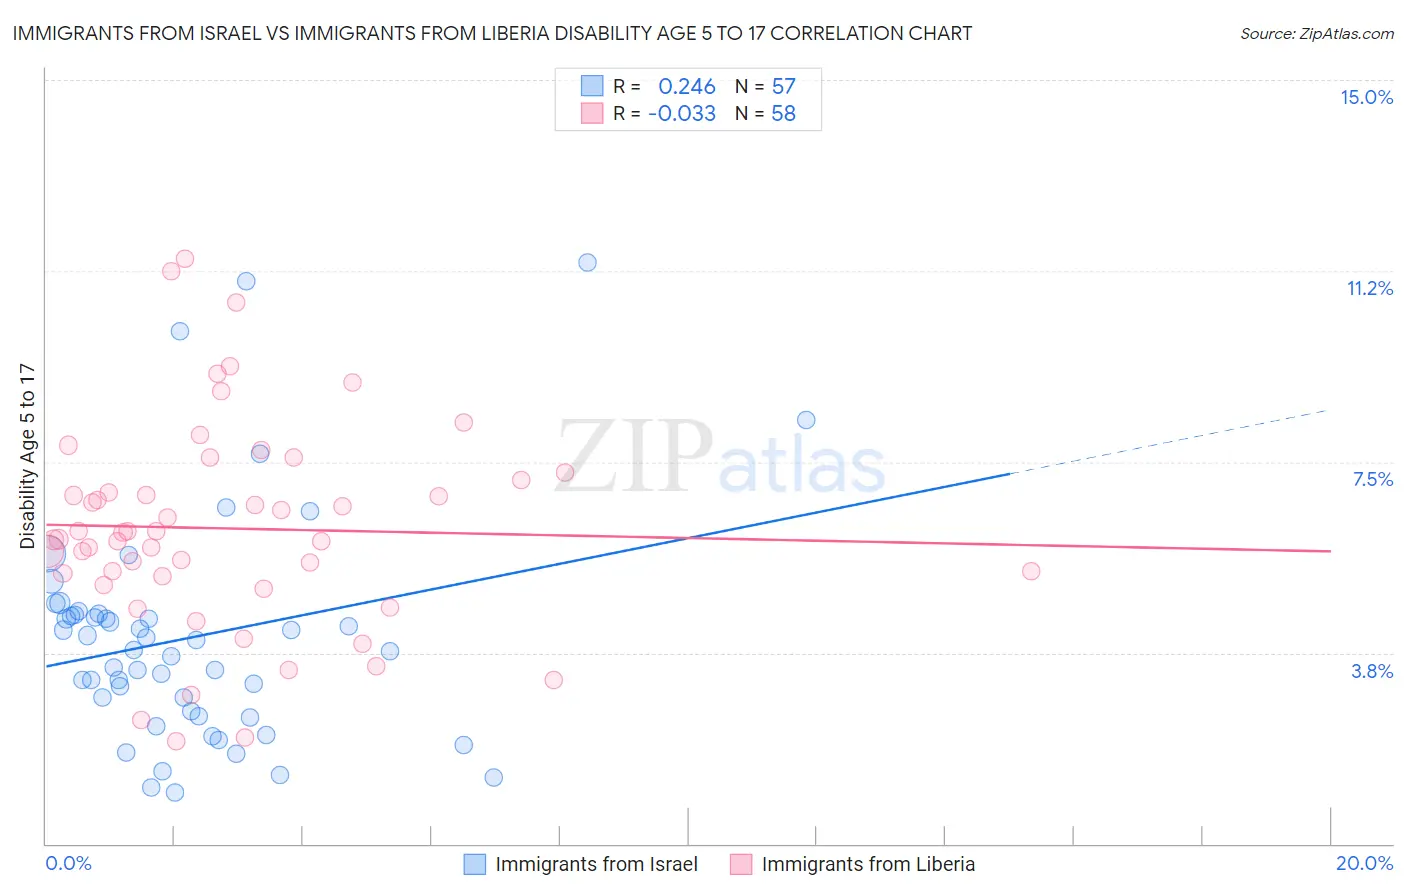
Immigrants from Israel vs Immigrants from Liberia Disability Age 5 to 17 Correlation Chart
The statistical analysis conducted on geographies consisting of 208,803,975 people shows a weak positive correlation between the proportion of Immigrants from Israel and percentage of population with a disability between the ages 5 and 17 in the United States with a correlation coefficient (R) of 0.246 and weighted average of 4.5%. Similarly, the statistical analysis conducted on geographies consisting of 135,071,303 people shows no correlation between the proportion of Immigrants from Liberia and percentage of population with a disability between the ages 5 and 17 in the United States with a correlation coefficient (R) of -0.033 and weighted average of 6.1%, a difference of 35.2%.
Disability Age 5 to 17 Correlation Summary
| Measurement | Immigrants from Israel | Immigrants from Liberia |
| Minimum | 1.0% | 2.0% |
| Maximum | 11.4% | 11.5% |
| Range | 10.4% | 9.5% |
| Mean | 4.1% | 6.2% |
| Median | 3.8% | 6.0% |
| Interquartile 25% (IQ1) | 2.6% | 5.3% |
| Interquartile 75% (IQ3) | 4.5% | 7.1% |
| Interquartile Range (IQR) | 1.9% | 1.9% |
| Standard Deviation (Sample) | 2.2% | 2.0% |
| Standard Deviation (Population) | 2.2% | 2.0% |
Similar Demographics by Disability Age 5 to 17
Demographics Similar to Immigrants from Israel by Disability Age 5 to 17
In terms of disability age 5 to 17, the demographic groups most similar to Immigrants from Israel are Immigrants from China (4.5%, a difference of 0.31%), Indian (Asian) (4.6%, a difference of 1.2%), Immigrants from Eastern Asia (4.6%, a difference of 1.6%), Immigrants from India (4.6%, a difference of 1.7%), and Armenian (4.6%, a difference of 1.8%).
| Demographics | Rating | Rank | Disability Age 5 to 17 |
| Immigrants | Armenia | 100.0 /100 | #1 | Exceptional 4.1% |
| Immigrants | Taiwan | 100.0 /100 | #2 | Exceptional 4.2% |
| Immigrants | Hong Kong | 100.0 /100 | #3 | Exceptional 4.3% |
| Filipinos | 100.0 /100 | #4 | Exceptional 4.3% |
| Immigrants | Iran | 100.0 /100 | #5 | Exceptional 4.4% |
| Immigrants | Israel | 100.0 /100 | #6 | Exceptional 4.5% |
| Immigrants | China | 100.0 /100 | #7 | Exceptional 4.5% |
| Indians (Asian) | 100.0 /100 | #8 | Exceptional 4.6% |
| Immigrants | Eastern Asia | 100.0 /100 | #9 | Exceptional 4.6% |
| Immigrants | India | 100.0 /100 | #10 | Exceptional 4.6% |
| Armenians | 100.0 /100 | #11 | Exceptional 4.6% |
| Iranians | 100.0 /100 | #12 | Exceptional 4.6% |
| Thais | 100.0 /100 | #13 | Exceptional 4.7% |
| Immigrants | Korea | 100.0 /100 | #14 | Exceptional 4.7% |
| Chinese | 100.0 /100 | #15 | Exceptional 4.7% |
Demographics Similar to Immigrants from Liberia by Disability Age 5 to 17
In terms of disability age 5 to 17, the demographic groups most similar to Immigrants from Liberia are Puget Sound Salish (6.1%, a difference of 0.080%), Immigrants from Jamaica (6.1%, a difference of 0.14%), Portuguese (6.1%, a difference of 0.28%), Scottish (6.1%, a difference of 0.53%), and German (6.1%, a difference of 0.78%).
| Demographics | Rating | Rank | Disability Age 5 to 17 |
| Immigrants | Zaire | 0.2 /100 | #271 | Tragic 6.0% |
| Finns | 0.2 /100 | #272 | Tragic 6.0% |
| Alaska Natives | 0.2 /100 | #273 | Tragic 6.0% |
| Cheyenne | 0.2 /100 | #274 | Tragic 6.0% |
| Dutch | 0.2 /100 | #275 | Tragic 6.0% |
| Japanese | 0.1 /100 | #276 | Tragic 6.1% |
| Puget Sound Salish | 0.1 /100 | #277 | Tragic 6.1% |
| Immigrants | Liberia | 0.1 /100 | #278 | Tragic 6.1% |
| Immigrants | Jamaica | 0.1 /100 | #279 | Tragic 6.1% |
| Portuguese | 0.1 /100 | #280 | Tragic 6.1% |
| Scottish | 0.0 /100 | #281 | Tragic 6.1% |
| Germans | 0.0 /100 | #282 | Tragic 6.1% |
| Ugandans | 0.0 /100 | #283 | Tragic 6.2% |
| Sub-Saharan Africans | 0.0 /100 | #284 | Tragic 6.2% |
| English | 0.0 /100 | #285 | Tragic 6.2% |