Immigrants from Israel vs Immigrants from Belarus Disability Age 5 to 17
COMPARE
Immigrants from Israel
Immigrants from Belarus
Disability Age 5 to 17
Disability Age 5 to 17 Comparison
Immigrants from Israel
Immigrants from Belarus
4.5%
DISABILITY AGE 5 TO 17
100.0/ 100
METRIC RATING
6th/ 347
METRIC RANK
5.0%
DISABILITY AGE 5 TO 17
100.0/ 100
METRIC RATING
37th/ 347
METRIC RANK
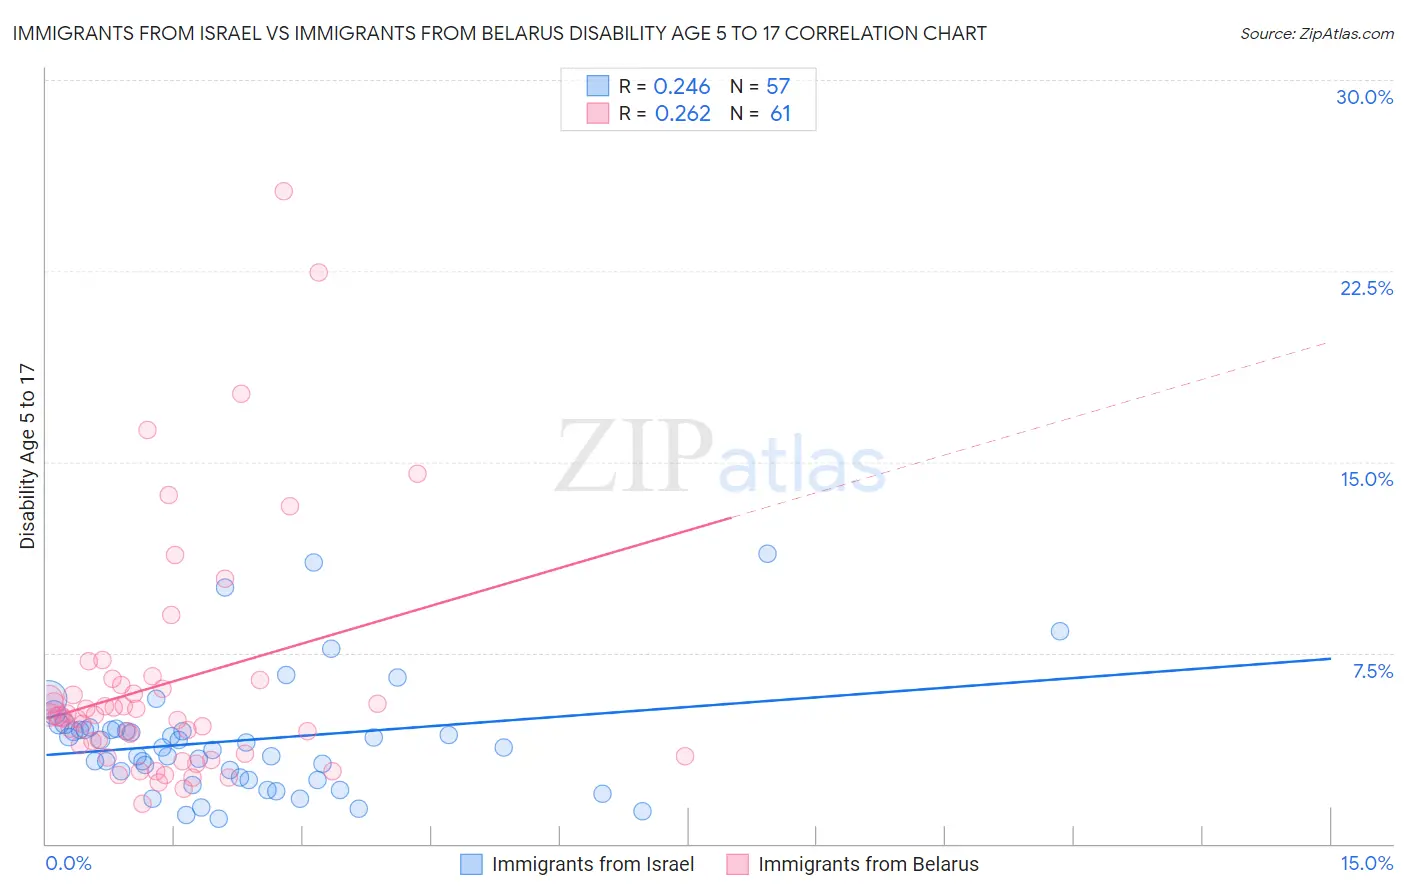
Immigrants from Israel vs Immigrants from Belarus Disability Age 5 to 17 Correlation Chart
The statistical analysis conducted on geographies consisting of 208,803,975 people shows a weak positive correlation between the proportion of Immigrants from Israel and percentage of population with a disability between the ages 5 and 17 in the United States with a correlation coefficient (R) of 0.246 and weighted average of 4.5%. Similarly, the statistical analysis conducted on geographies consisting of 149,676,434 people shows a weak positive correlation between the proportion of Immigrants from Belarus and percentage of population with a disability between the ages 5 and 17 in the United States with a correlation coefficient (R) of 0.262 and weighted average of 5.0%, a difference of 11.0%.
Disability Age 5 to 17 Correlation Summary
| Measurement | Immigrants from Israel | Immigrants from Belarus |
| Minimum | 1.0% | 1.6% |
| Maximum | 11.4% | 25.7% |
| Range | 10.4% | 24.1% |
| Mean | 4.1% | 6.3% |
| Median | 3.8% | 5.0% |
| Interquartile 25% (IQ1) | 2.6% | 3.5% |
| Interquartile 75% (IQ3) | 4.5% | 6.3% |
| Interquartile Range (IQR) | 1.9% | 2.9% |
| Standard Deviation (Sample) | 2.2% | 4.7% |
| Standard Deviation (Population) | 2.2% | 4.7% |
Similar Demographics by Disability Age 5 to 17
Demographics Similar to Immigrants from Israel by Disability Age 5 to 17
In terms of disability age 5 to 17, the demographic groups most similar to Immigrants from Israel are Immigrants from China (4.5%, a difference of 0.31%), Indian (Asian) (4.6%, a difference of 1.2%), Immigrants from Eastern Asia (4.6%, a difference of 1.6%), Immigrants from India (4.6%, a difference of 1.7%), and Armenian (4.6%, a difference of 1.8%).
| Demographics | Rating | Rank | Disability Age 5 to 17 |
| Immigrants | Armenia | 100.0 /100 | #1 | Exceptional 4.1% |
| Immigrants | Taiwan | 100.0 /100 | #2 | Exceptional 4.2% |
| Immigrants | Hong Kong | 100.0 /100 | #3 | Exceptional 4.3% |
| Filipinos | 100.0 /100 | #4 | Exceptional 4.3% |
| Immigrants | Iran | 100.0 /100 | #5 | Exceptional 4.4% |
| Immigrants | Israel | 100.0 /100 | #6 | Exceptional 4.5% |
| Immigrants | China | 100.0 /100 | #7 | Exceptional 4.5% |
| Indians (Asian) | 100.0 /100 | #8 | Exceptional 4.6% |
| Immigrants | Eastern Asia | 100.0 /100 | #9 | Exceptional 4.6% |
| Immigrants | India | 100.0 /100 | #10 | Exceptional 4.6% |
| Armenians | 100.0 /100 | #11 | Exceptional 4.6% |
| Iranians | 100.0 /100 | #12 | Exceptional 4.6% |
| Thais | 100.0 /100 | #13 | Exceptional 4.7% |
| Immigrants | Korea | 100.0 /100 | #14 | Exceptional 4.7% |
| Chinese | 100.0 /100 | #15 | Exceptional 4.7% |
Demographics Similar to Immigrants from Belarus by Disability Age 5 to 17
In terms of disability age 5 to 17, the demographic groups most similar to Immigrants from Belarus are Immigrants from Egypt (5.0%, a difference of 0.030%), Immigrants from Philippines (5.0%, a difference of 0.040%), Immigrants from Argentina (5.0%, a difference of 0.050%), Bolivian (5.0%, a difference of 0.070%), and Okinawan (5.0%, a difference of 0.13%).
| Demographics | Rating | Rank | Disability Age 5 to 17 |
| Immigrants | Malaysia | 100.0 /100 | #30 | Exceptional 5.0% |
| Immigrants | Pakistan | 100.0 /100 | #31 | Exceptional 5.0% |
| Soviet Union | 100.0 /100 | #32 | Exceptional 5.0% |
| Immigrants | Indonesia | 100.0 /100 | #33 | Exceptional 5.0% |
| Israelis | 100.0 /100 | #34 | Exceptional 5.0% |
| Bolivians | 100.0 /100 | #35 | Exceptional 5.0% |
| Immigrants | Egypt | 100.0 /100 | #36 | Exceptional 5.0% |
| Immigrants | Belarus | 100.0 /100 | #37 | Exceptional 5.0% |
| Immigrants | Philippines | 100.0 /100 | #38 | Exceptional 5.0% |
| Immigrants | Argentina | 100.0 /100 | #39 | Exceptional 5.0% |
| Okinawans | 100.0 /100 | #40 | Exceptional 5.0% |
| Immigrants | Australia | 100.0 /100 | #41 | Exceptional 5.0% |
| Immigrants | Sri Lanka | 100.0 /100 | #42 | Exceptional 5.0% |
| Immigrants | Russia | 100.0 /100 | #43 | Exceptional 5.0% |
| Egyptians | 100.0 /100 | #44 | Exceptional 5.0% |