Immigrants from Eastern Europe vs Menominee Disability Age 5 to 17
COMPARE
Immigrants from Eastern Europe
Menominee
Disability Age 5 to 17
Disability Age 5 to 17 Comparison
Immigrants from Eastern Europe
Menominee
5.1%
DISABILITY AGE 5 TO 17
99.9/ 100
METRIC RATING
60th/ 347
METRIC RANK
5.3%
DISABILITY AGE 5 TO 17
98.7/ 100
METRIC RATING
101st/ 347
METRIC RANK
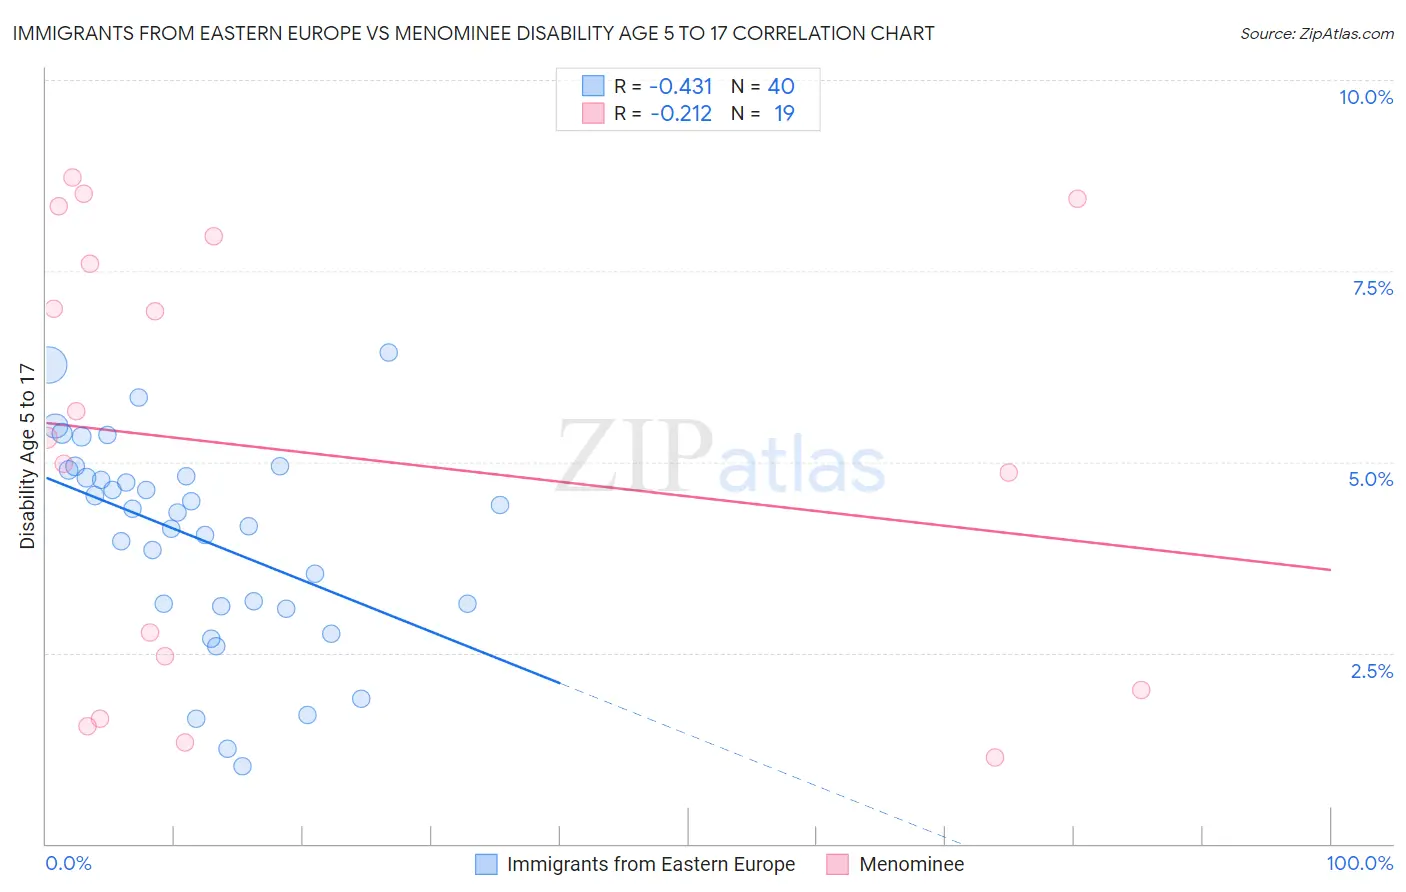
Immigrants from Eastern Europe vs Menominee Disability Age 5 to 17 Correlation Chart
The statistical analysis conducted on geographies consisting of 469,560,483 people shows a moderate negative correlation between the proportion of Immigrants from Eastern Europe and percentage of population with a disability between the ages 5 and 17 in the United States with a correlation coefficient (R) of -0.431 and weighted average of 5.1%. Similarly, the statistical analysis conducted on geographies consisting of 45,659,634 people shows a weak negative correlation between the proportion of Menominee and percentage of population with a disability between the ages 5 and 17 in the United States with a correlation coefficient (R) of -0.212 and weighted average of 5.3%, a difference of 3.2%.
Disability Age 5 to 17 Correlation Summary
| Measurement | Immigrants from Eastern Europe | Menominee |
| Minimum | 1.0% | 1.1% |
| Maximum | 6.4% | 8.7% |
| Range | 5.4% | 7.6% |
| Mean | 4.0% | 5.1% |
| Median | 4.4% | 5.3% |
| Interquartile 25% (IQ1) | 3.1% | 2.0% |
| Interquartile 75% (IQ3) | 4.9% | 8.0% |
| Interquartile Range (IQR) | 1.7% | 5.9% |
| Standard Deviation (Sample) | 1.3% | 2.8% |
| Standard Deviation (Population) | 1.3% | 2.8% |
Similar Demographics by Disability Age 5 to 17
Demographics Similar to Immigrants from Eastern Europe by Disability Age 5 to 17
In terms of disability age 5 to 17, the demographic groups most similar to Immigrants from Eastern Europe are Immigrants from North Macedonia (5.1%, a difference of 0.11%), Immigrants from Ukraine (5.1%, a difference of 0.29%), Immigrants from Poland (5.1%, a difference of 0.38%), Immigrants from Switzerland (5.2%, a difference of 0.48%), and Immigrants from Turkey (5.1%, a difference of 0.52%).
| Demographics | Rating | Rank | Disability Age 5 to 17 |
| Immigrants | Lithuania | 99.9 /100 | #53 | Exceptional 5.1% |
| Paraguayans | 99.9 /100 | #54 | Exceptional 5.1% |
| Laotians | 99.9 /100 | #55 | Exceptional 5.1% |
| Immigrants | Turkey | 99.9 /100 | #56 | Exceptional 5.1% |
| Immigrants | Poland | 99.9 /100 | #57 | Exceptional 5.1% |
| Immigrants | Ukraine | 99.9 /100 | #58 | Exceptional 5.1% |
| Immigrants | North Macedonia | 99.9 /100 | #59 | Exceptional 5.1% |
| Immigrants | Eastern Europe | 99.9 /100 | #60 | Exceptional 5.1% |
| Immigrants | Switzerland | 99.8 /100 | #61 | Exceptional 5.2% |
| Immigrants | Ireland | 99.8 /100 | #62 | Exceptional 5.2% |
| Immigrants | Bangladesh | 99.8 /100 | #63 | Exceptional 5.2% |
| Immigrants | South Eastern Asia | 99.8 /100 | #64 | Exceptional 5.2% |
| Immigrants | Greece | 99.8 /100 | #65 | Exceptional 5.2% |
| Palestinians | 99.8 /100 | #66 | Exceptional 5.2% |
| Macedonians | 99.8 /100 | #67 | Exceptional 5.2% |
Demographics Similar to Menominee by Disability Age 5 to 17
In terms of disability age 5 to 17, the demographic groups most similar to Menominee are Nepalese (5.3%, a difference of 0.020%), Nicaraguan (5.3%, a difference of 0.080%), Salvadoran (5.3%, a difference of 0.11%), Cambodian (5.3%, a difference of 0.18%), and Peruvian (5.3%, a difference of 0.18%).
| Demographics | Rating | Rank | Disability Age 5 to 17 |
| Immigrants | Jordan | 99.1 /100 | #94 | Exceptional 5.3% |
| Immigrants | Grenada | 99.1 /100 | #95 | Exceptional 5.3% |
| Immigrants | El Salvador | 99.0 /100 | #96 | Exceptional 5.3% |
| Immigrants | Europe | 99.0 /100 | #97 | Exceptional 5.3% |
| Immigrants | Austria | 98.9 /100 | #98 | Exceptional 5.3% |
| Cambodians | 98.8 /100 | #99 | Exceptional 5.3% |
| Nepalese | 98.7 /100 | #100 | Exceptional 5.3% |
| Menominee | 98.7 /100 | #101 | Exceptional 5.3% |
| Nicaraguans | 98.6 /100 | #102 | Exceptional 5.3% |
| Salvadorans | 98.6 /100 | #103 | Exceptional 5.3% |
| Peruvians | 98.5 /100 | #104 | Exceptional 5.3% |
| Immigrants | Italy | 98.4 /100 | #105 | Exceptional 5.3% |
| Immigrants | Yemen | 98.2 /100 | #106 | Exceptional 5.3% |
| Russians | 98.2 /100 | #107 | Exceptional 5.3% |
| Immigrants | South Africa | 98.1 /100 | #108 | Exceptional 5.3% |