Immigrants from Eastern Europe vs Immigrants from Caribbean Disability Age 5 to 17
COMPARE
Immigrants from Eastern Europe
Immigrants from Caribbean
Disability Age 5 to 17
Disability Age 5 to 17 Comparison
Immigrants from Eastern Europe
Immigrants from Caribbean
5.1%
DISABILITY AGE 5 TO 17
99.9/ 100
METRIC RATING
60th/ 347
METRIC RANK
5.9%
DISABILITY AGE 5 TO 17
2.1/ 100
METRIC RATING
241st/ 347
METRIC RANK
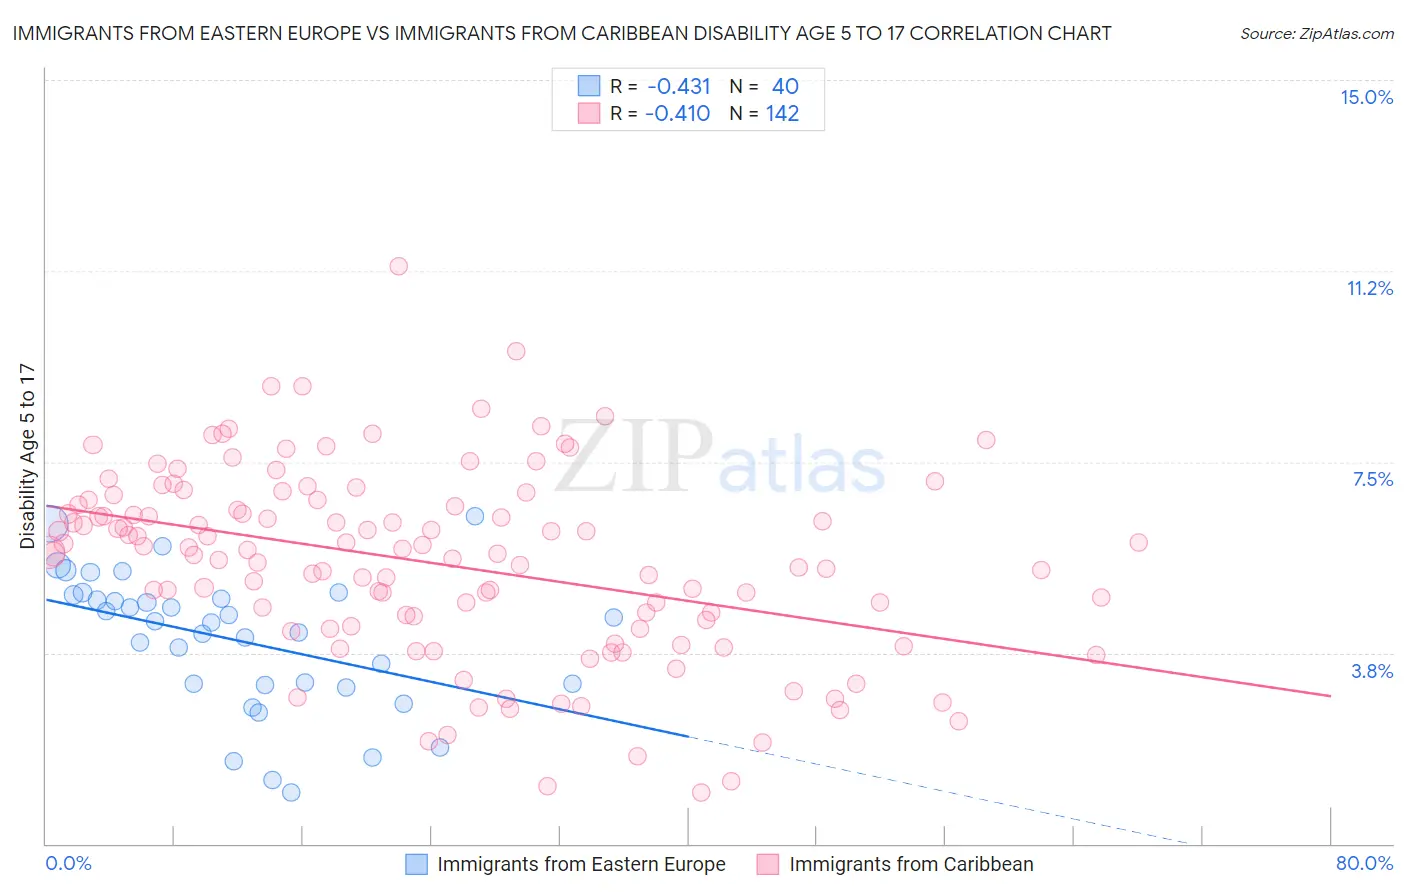
Immigrants from Eastern Europe vs Immigrants from Caribbean Disability Age 5 to 17 Correlation Chart
The statistical analysis conducted on geographies consisting of 469,560,483 people shows a moderate negative correlation between the proportion of Immigrants from Eastern Europe and percentage of population with a disability between the ages 5 and 17 in the United States with a correlation coefficient (R) of -0.431 and weighted average of 5.1%. Similarly, the statistical analysis conducted on geographies consisting of 445,217,348 people shows a moderate negative correlation between the proportion of Immigrants from Caribbean and percentage of population with a disability between the ages 5 and 17 in the United States with a correlation coefficient (R) of -0.410 and weighted average of 5.9%, a difference of 14.1%.
Disability Age 5 to 17 Correlation Summary
| Measurement | Immigrants from Eastern Europe | Immigrants from Caribbean |
| Minimum | 1.0% | 1.0% |
| Maximum | 6.4% | 11.3% |
| Range | 5.4% | 10.3% |
| Mean | 4.0% | 5.5% |
| Median | 4.4% | 5.7% |
| Interquartile 25% (IQ1) | 3.1% | 4.3% |
| Interquartile 75% (IQ3) | 4.9% | 6.7% |
| Interquartile Range (IQR) | 1.7% | 2.4% |
| Standard Deviation (Sample) | 1.3% | 1.9% |
| Standard Deviation (Population) | 1.3% | 1.8% |
Similar Demographics by Disability Age 5 to 17
Demographics Similar to Immigrants from Eastern Europe by Disability Age 5 to 17
In terms of disability age 5 to 17, the demographic groups most similar to Immigrants from Eastern Europe are Immigrants from North Macedonia (5.1%, a difference of 0.11%), Immigrants from Ukraine (5.1%, a difference of 0.29%), Immigrants from Poland (5.1%, a difference of 0.38%), Immigrants from Switzerland (5.2%, a difference of 0.48%), and Immigrants from Turkey (5.1%, a difference of 0.52%).
| Demographics | Rating | Rank | Disability Age 5 to 17 |
| Immigrants | Lithuania | 99.9 /100 | #53 | Exceptional 5.1% |
| Paraguayans | 99.9 /100 | #54 | Exceptional 5.1% |
| Laotians | 99.9 /100 | #55 | Exceptional 5.1% |
| Immigrants | Turkey | 99.9 /100 | #56 | Exceptional 5.1% |
| Immigrants | Poland | 99.9 /100 | #57 | Exceptional 5.1% |
| Immigrants | Ukraine | 99.9 /100 | #58 | Exceptional 5.1% |
| Immigrants | North Macedonia | 99.9 /100 | #59 | Exceptional 5.1% |
| Immigrants | Eastern Europe | 99.9 /100 | #60 | Exceptional 5.1% |
| Immigrants | Switzerland | 99.8 /100 | #61 | Exceptional 5.2% |
| Immigrants | Ireland | 99.8 /100 | #62 | Exceptional 5.2% |
| Immigrants | Bangladesh | 99.8 /100 | #63 | Exceptional 5.2% |
| Immigrants | South Eastern Asia | 99.8 /100 | #64 | Exceptional 5.2% |
| Immigrants | Greece | 99.8 /100 | #65 | Exceptional 5.2% |
| Palestinians | 99.8 /100 | #66 | Exceptional 5.2% |
| Macedonians | 99.8 /100 | #67 | Exceptional 5.2% |
Demographics Similar to Immigrants from Caribbean by Disability Age 5 to 17
In terms of disability age 5 to 17, the demographic groups most similar to Immigrants from Caribbean are Spaniard (5.9%, a difference of 0.080%), Indonesian (5.9%, a difference of 0.090%), West Indian (5.9%, a difference of 0.13%), German Russian (5.9%, a difference of 0.15%), and Immigrants from Germany (5.9%, a difference of 0.15%).
| Demographics | Rating | Rank | Disability Age 5 to 17 |
| Immigrants | Kenya | 3.4 /100 | #234 | Tragic 5.8% |
| Malaysians | 3.4 /100 | #235 | Tragic 5.8% |
| Immigrants | Brazil | 3.2 /100 | #236 | Tragic 5.8% |
| Sudanese | 2.9 /100 | #237 | Tragic 5.8% |
| Hungarians | 2.6 /100 | #238 | Tragic 5.8% |
| German Russians | 2.4 /100 | #239 | Tragic 5.9% |
| West Indians | 2.4 /100 | #240 | Tragic 5.9% |
| Immigrants | Caribbean | 2.1 /100 | #241 | Tragic 5.9% |
| Spaniards | 2.0 /100 | #242 | Tragic 5.9% |
| Indonesians | 2.0 /100 | #243 | Tragic 5.9% |
| Immigrants | Germany | 1.9 /100 | #244 | Tragic 5.9% |
| Immigrants | Micronesia | 1.9 /100 | #245 | Tragic 5.9% |
| Tlingit-Haida | 1.9 /100 | #246 | Tragic 5.9% |
| Immigrants | Honduras | 1.8 /100 | #247 | Tragic 5.9% |
| British | 1.7 /100 | #248 | Tragic 5.9% |