Immigrants from Cambodia vs Ghanaian Disability Age 5 to 17
COMPARE
Immigrants from Cambodia
Ghanaian
Disability Age 5 to 17
Disability Age 5 to 17 Comparison
Immigrants from Cambodia
Ghanaians
5.9%
DISABILITY AGE 5 TO 17
1.5/ 100
METRIC RATING
251st/ 347
METRIC RANK
5.8%
DISABILITY AGE 5 TO 17
4.7/ 100
METRIC RATING
230th/ 347
METRIC RANK
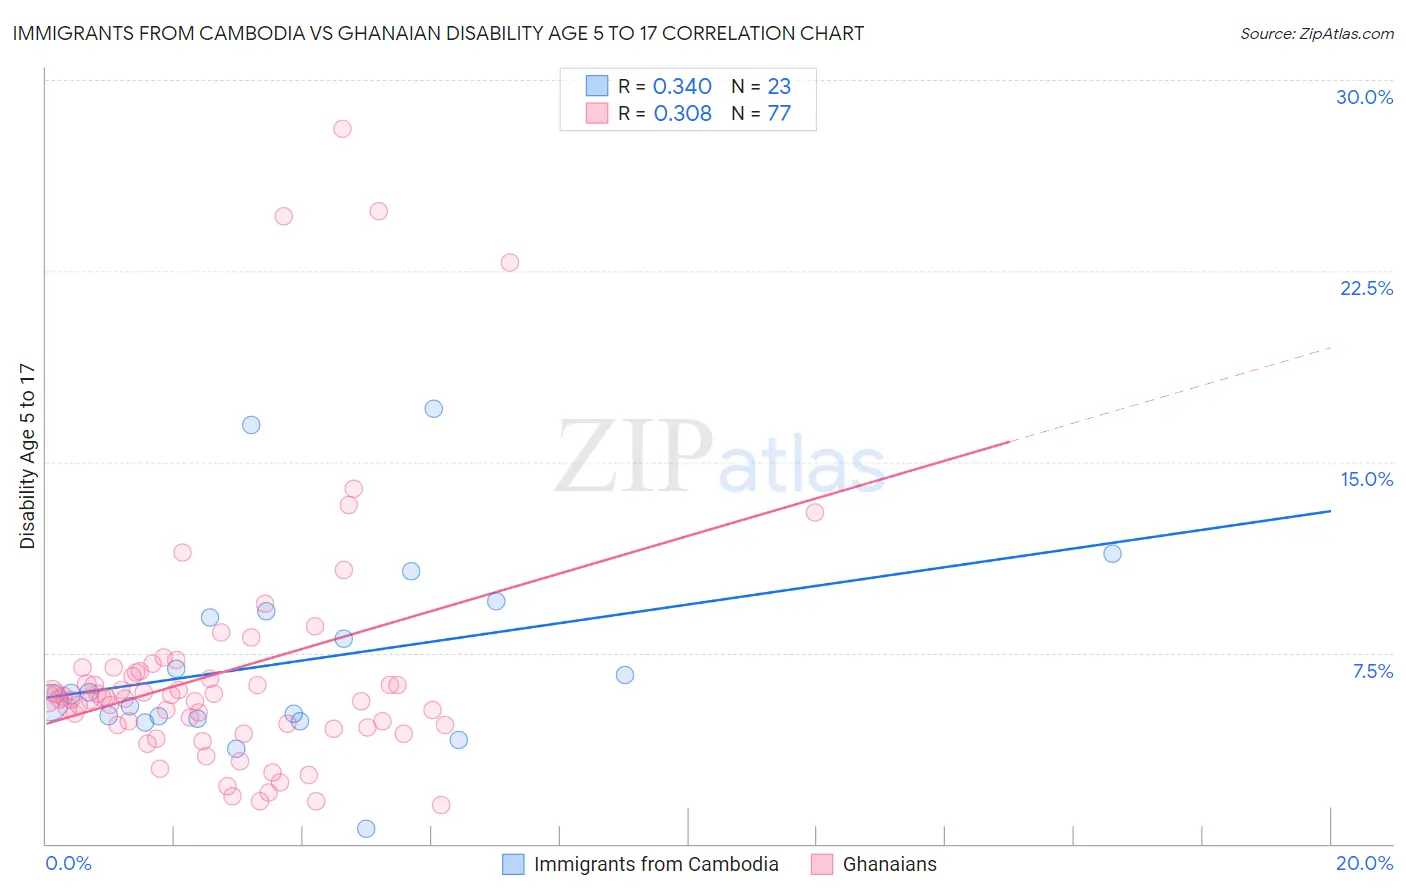
Immigrants from Cambodia vs Ghanaian Disability Age 5 to 17 Correlation Chart
The statistical analysis conducted on geographies consisting of 204,706,701 people shows a mild positive correlation between the proportion of Immigrants from Cambodia and percentage of population with a disability between the ages 5 and 17 in the United States with a correlation coefficient (R) of 0.340 and weighted average of 5.9%. Similarly, the statistical analysis conducted on geographies consisting of 189,962,788 people shows a mild positive correlation between the proportion of Ghanaians and percentage of population with a disability between the ages 5 and 17 in the United States with a correlation coefficient (R) of 0.308 and weighted average of 5.8%, a difference of 1.4%.
Disability Age 5 to 17 Correlation Summary
| Measurement | Immigrants from Cambodia | Ghanaian |
| Minimum | 0.58% | 1.5% |
| Maximum | 17.1% | 28.1% |
| Range | 16.5% | 26.6% |
| Mean | 7.2% | 6.7% |
| Median | 5.9% | 5.7% |
| Interquartile 25% (IQ1) | 4.9% | 4.6% |
| Interquartile 75% (IQ3) | 9.1% | 6.8% |
| Interquartile Range (IQR) | 4.2% | 2.1% |
| Standard Deviation (Sample) | 3.9% | 5.0% |
| Standard Deviation (Population) | 3.8% | 4.9% |
Similar Demographics by Disability Age 5 to 17
Demographics Similar to Immigrants from Cambodia by Disability Age 5 to 17
In terms of disability age 5 to 17, the demographic groups most similar to Immigrants from Cambodia are Polish (5.9%, a difference of 0.020%), Honduran (5.9%, a difference of 0.020%), Scandinavian (5.9%, a difference of 0.090%), Immigrants from Ghana (5.9%, a difference of 0.14%), and British (5.9%, a difference of 0.16%).
| Demographics | Rating | Rank | Disability Age 5 to 17 |
| Immigrants | Germany | 1.9 /100 | #244 | Tragic 5.9% |
| Immigrants | Micronesia | 1.9 /100 | #245 | Tragic 5.9% |
| Tlingit-Haida | 1.9 /100 | #246 | Tragic 5.9% |
| Immigrants | Honduras | 1.8 /100 | #247 | Tragic 5.9% |
| British | 1.7 /100 | #248 | Tragic 5.9% |
| Immigrants | Ghana | 1.7 /100 | #249 | Tragic 5.9% |
| Poles | 1.5 /100 | #250 | Tragic 5.9% |
| Immigrants | Cambodia | 1.5 /100 | #251 | Tragic 5.9% |
| Hondurans | 1.5 /100 | #252 | Tragic 5.9% |
| Scandinavians | 1.4 /100 | #253 | Tragic 5.9% |
| Barbadians | 1.3 /100 | #254 | Tragic 5.9% |
| Italians | 1.2 /100 | #255 | Tragic 5.9% |
| Hopi | 1.0 /100 | #256 | Tragic 5.9% |
| Hispanics or Latinos | 1.0 /100 | #257 | Tragic 5.9% |
| Brazilians | 0.9 /100 | #258 | Tragic 5.9% |
Demographics Similar to Ghanaians by Disability Age 5 to 17
In terms of disability age 5 to 17, the demographic groups most similar to Ghanaians are Bangladeshi (5.8%, a difference of 0.010%), Haitian (5.8%, a difference of 0.020%), European (5.8%, a difference of 0.070%), Swiss (5.8%, a difference of 0.10%), and British West Indian (5.8%, a difference of 0.18%).
| Demographics | Rating | Rank | Disability Age 5 to 17 |
| Alsatians | 6.0 /100 | #223 | Tragic 5.8% |
| Mexicans | 5.7 /100 | #224 | Tragic 5.8% |
| Guamanians/Chamorros | 5.6 /100 | #225 | Tragic 5.8% |
| British West Indians | 5.4 /100 | #226 | Tragic 5.8% |
| Swiss | 5.1 /100 | #227 | Tragic 5.8% |
| Haitians | 4.8 /100 | #228 | Tragic 5.8% |
| Bangladeshis | 4.8 /100 | #229 | Tragic 5.8% |
| Ghanaians | 4.7 /100 | #230 | Tragic 5.8% |
| Europeans | 4.5 /100 | #231 | Tragic 5.8% |
| Immigrants | Laos | 3.8 /100 | #232 | Tragic 5.8% |
| Immigrants | West Indies | 3.5 /100 | #233 | Tragic 5.8% |
| Immigrants | Kenya | 3.4 /100 | #234 | Tragic 5.8% |
| Malaysians | 3.4 /100 | #235 | Tragic 5.8% |
| Immigrants | Brazil | 3.2 /100 | #236 | Tragic 5.8% |
| Sudanese | 2.9 /100 | #237 | Tragic 5.8% |