Immigrants from Cambodia vs Immigrants from Scotland Disability Age 5 to 17
COMPARE
Immigrants from Cambodia
Immigrants from Scotland
Disability Age 5 to 17
Disability Age 5 to 17 Comparison
Immigrants from Cambodia
Immigrants from Scotland
5.9%
DISABILITY AGE 5 TO 17
1.5/ 100
METRIC RATING
251st/ 347
METRIC RANK
5.6%
DISABILITY AGE 5 TO 17
61.9/ 100
METRIC RATING
164th/ 347
METRIC RANK
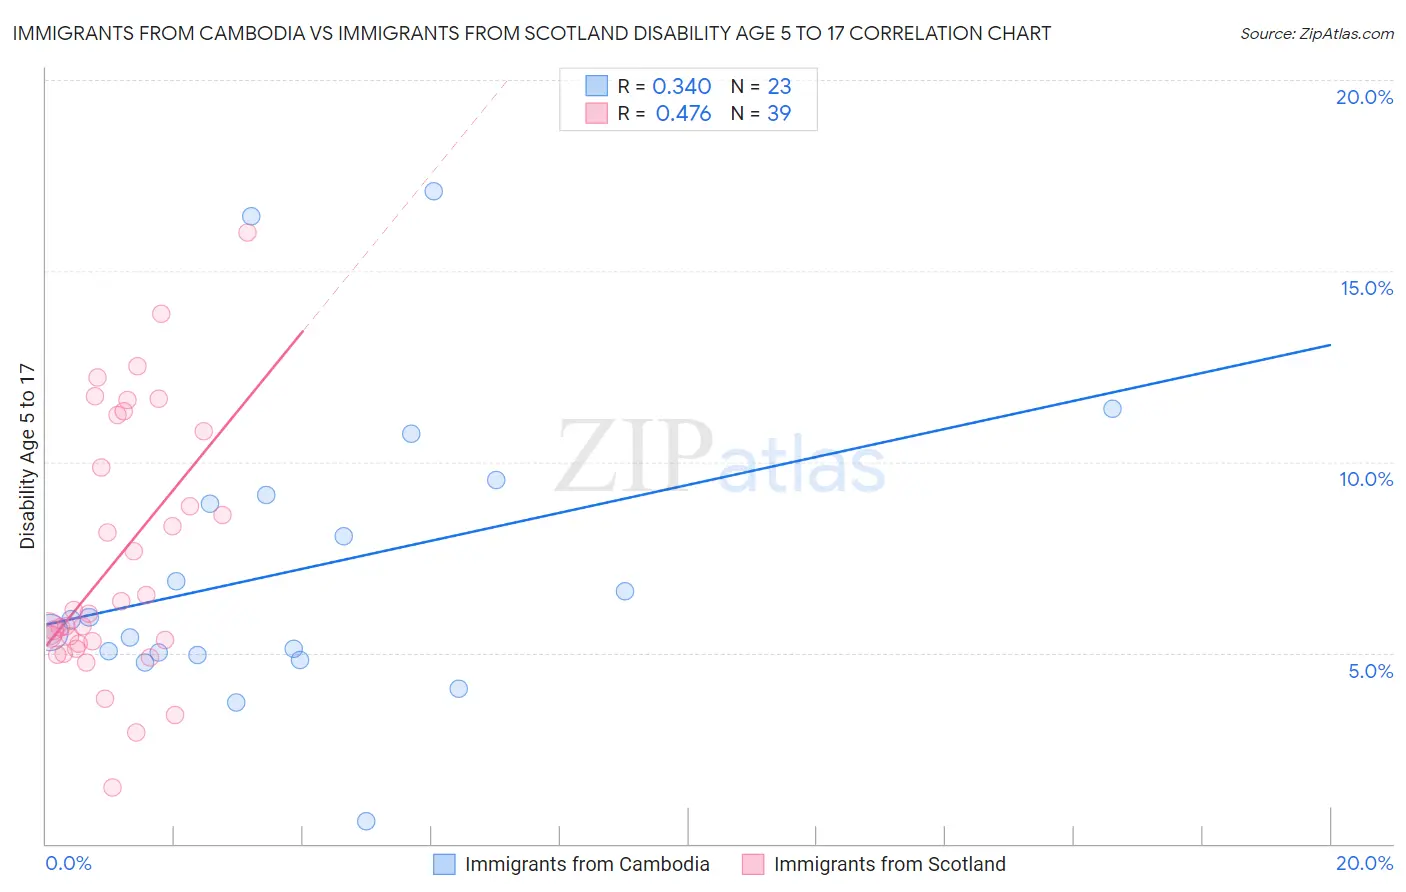
Immigrants from Cambodia vs Immigrants from Scotland Disability Age 5 to 17 Correlation Chart
The statistical analysis conducted on geographies consisting of 204,706,701 people shows a mild positive correlation between the proportion of Immigrants from Cambodia and percentage of population with a disability between the ages 5 and 17 in the United States with a correlation coefficient (R) of 0.340 and weighted average of 5.9%. Similarly, the statistical analysis conducted on geographies consisting of 195,273,569 people shows a moderate positive correlation between the proportion of Immigrants from Scotland and percentage of population with a disability between the ages 5 and 17 in the United States with a correlation coefficient (R) of 0.476 and weighted average of 5.6%, a difference of 5.8%.
Disability Age 5 to 17 Correlation Summary
| Measurement | Immigrants from Cambodia | Immigrants from Scotland |
| Minimum | 0.58% | 1.5% |
| Maximum | 17.1% | 16.0% |
| Range | 16.5% | 14.5% |
| Mean | 7.2% | 7.4% |
| Median | 5.9% | 6.0% |
| Interquartile 25% (IQ1) | 4.9% | 5.2% |
| Interquartile 75% (IQ3) | 9.1% | 10.8% |
| Interquartile Range (IQR) | 4.2% | 5.6% |
| Standard Deviation (Sample) | 3.9% | 3.4% |
| Standard Deviation (Population) | 3.8% | 3.3% |
Similar Demographics by Disability Age 5 to 17
Demographics Similar to Immigrants from Cambodia by Disability Age 5 to 17
In terms of disability age 5 to 17, the demographic groups most similar to Immigrants from Cambodia are Polish (5.9%, a difference of 0.020%), Honduran (5.9%, a difference of 0.020%), Scandinavian (5.9%, a difference of 0.090%), Immigrants from Ghana (5.9%, a difference of 0.14%), and British (5.9%, a difference of 0.16%).
| Demographics | Rating | Rank | Disability Age 5 to 17 |
| Immigrants | Germany | 1.9 /100 | #244 | Tragic 5.9% |
| Immigrants | Micronesia | 1.9 /100 | #245 | Tragic 5.9% |
| Tlingit-Haida | 1.9 /100 | #246 | Tragic 5.9% |
| Immigrants | Honduras | 1.8 /100 | #247 | Tragic 5.9% |
| British | 1.7 /100 | #248 | Tragic 5.9% |
| Immigrants | Ghana | 1.7 /100 | #249 | Tragic 5.9% |
| Poles | 1.5 /100 | #250 | Tragic 5.9% |
| Immigrants | Cambodia | 1.5 /100 | #251 | Tragic 5.9% |
| Hondurans | 1.5 /100 | #252 | Tragic 5.9% |
| Scandinavians | 1.4 /100 | #253 | Tragic 5.9% |
| Barbadians | 1.3 /100 | #254 | Tragic 5.9% |
| Italians | 1.2 /100 | #255 | Tragic 5.9% |
| Hopi | 1.0 /100 | #256 | Tragic 5.9% |
| Hispanics or Latinos | 1.0 /100 | #257 | Tragic 5.9% |
| Brazilians | 0.9 /100 | #258 | Tragic 5.9% |
Demographics Similar to Immigrants from Scotland by Disability Age 5 to 17
In terms of disability age 5 to 17, the demographic groups most similar to Immigrants from Scotland are Lebanese (5.6%, a difference of 0.030%), Greek (5.6%, a difference of 0.070%), Immigrants from Southern Europe (5.6%, a difference of 0.11%), Immigrants from Burma/Myanmar (5.6%, a difference of 0.13%), and Zimbabwean (5.5%, a difference of 0.29%).
| Demographics | Rating | Rank | Disability Age 5 to 17 |
| Immigrants | Costa Rica | 77.9 /100 | #157 | Good 5.5% |
| Immigrants | Nepal | 77.1 /100 | #158 | Good 5.5% |
| Immigrants | Zimbabwe | 75.3 /100 | #159 | Good 5.5% |
| South Africans | 73.3 /100 | #160 | Good 5.5% |
| Immigrants | Saudi Arabia | 69.1 /100 | #161 | Good 5.5% |
| Zimbabweans | 67.2 /100 | #162 | Good 5.5% |
| Immigrants | Southern Europe | 64.0 /100 | #163 | Good 5.6% |
| Immigrants | Scotland | 61.9 /100 | #164 | Good 5.6% |
| Lebanese | 61.4 /100 | #165 | Good 5.6% |
| Greeks | 60.6 /100 | #166 | Good 5.6% |
| Immigrants | Burma/Myanmar | 59.3 /100 | #167 | Average 5.6% |
| Iraqis | 56.0 /100 | #168 | Average 5.6% |
| Immigrants | Norway | 55.7 /100 | #169 | Average 5.6% |
| Serbians | 54.0 /100 | #170 | Average 5.6% |
| Immigrants | Iraq | 53.9 /100 | #171 | Average 5.6% |